 Open Access Article
Green approach for the fabrication of a ternary nanocatalyst (Ag-ZnONPs@Cy) for visible light-induced photocatalytic reduction of nitroarenes to aminoarenes†
Dana A. Kader *ab
*ab
aDepartment of Chemistry, College of Education, University of Sulaimani, Old Campus, Kurdistan Region, 46001, Iraq. E-mail: dana.kader@univsul.edu.iq
bPharmacy Department, Komar University of Science and Technology, Kurdistan Region, Sulaimani 46001, Iraq
First published on 30th November 2023
Abstract
In recent times, the incorporation of metal oxide nanoparticles with organic dyes has piqued the interest of numerous researchers due to their diverse applications under visible light instead of UV radiation. This investigation employed a three-step methodology to fabricate cyanidin-sensitized silver-doped zinc oxide nanoparticles (Ag-ZnO@Cy). Initially, cyanidin dye was extracted from fresh black mulberry fruit, followed by the eco-friendly synthesis of Ag-ZnO nanoparticles (Ag-ZnONPs). The successful integration of the prepared cyanidin dye with Ag-ZnONPs was achieved through a straightforward, environmentally benign, and cost-efficient procedure. The resultant ternary composite underwent comprehensive characterization and confirmation utilizing various techniques, such as SEM, FT-IR, EDX, DRS, elemental mapping, and XRD. The experimental results for Ag-ZnONPs@Cy demonstrated that the nanocrystalline wurtzite exhibited spherical shapes with an average crystal size of 27.42 nm. Moreover, the photocatalytic activity of the synthesized Ag-ZnONPs@Cy was meticulously investigated under blue LED light irradiation. This inquiry encompassed examinations of catalyst amount, regeneration, stability, reusability, and the influence of light source on the hydrogenation of nitroarenes to the corresponding aminoarenes. The findings shed light on the potential of this composite for diverse photocatalytic applications.
1. Introduction
Over the past few years, organic dyes have played a crucial role in advancing the application of metal oxide nanoparticles. These nanoparticles have found diverse uses, such as acting as efficient photocatalysts for the removal of organic pollutants,1 contributing to the design of more efficient solar cells,2 facilitating dye degradation processes,3 enabling hydrogen production,4 and promoting various organic transformations.5 The realm of semiconductor photocatalysis, a subset of photochemistry, has attracted considerable interest owing to its optimistic capacity for producing valuable chemicals. This distinct method leverages the potency of light as an economical energy resource, facilitating the transformation of demanding reaction conditions into gentler and eco-friendlier alternatives. As a result, researchers have been increasingly focusing their efforts on developing photochemical reactions that can be initiated under visible light, aligning with the principles of green chemistry and sustainable practices. This pursuit aims to reduce the reliance on conventional energy-intensive processes and pave the way for more sustainable and eco-friendly chemical transformations.3,6A wide array of metal oxide nanoparticles, including MnO, CdS, TiO2, MgO, ZnO, and WO3, have been extensively utilized as photocatalytic materials in organic transformations. The reason behind their widespread adoption lies in their exceptional attributes, such as remarkable chemical stability, potent catalytic capabilities, low toxicity, and cost-effectiveness. As a result, these materials are highly sought after for promoting a diverse range of organic reactions through photocatalysis.7–15
Zinc oxide nanoparticles (ZnONPs) have established their versatility as an oxide material, finding extensive applications across diverse domains. These include uses in sunscreens and cosmetics,16 antibacterial coatings,17 electronics and optoelectronics,18 textiles,19 nanomedicine,20 anti-corrosion coatings,21 gas sensors,22 transparent conductive films,23 piezoelectric devices,24 and photocatalysis.25,26 Although there are several advantages to using ZnONPs as a photocatalyst, they also come with certain drawbacks.27 The most significant drawback is that ZnONPs can only participate in photochemical reactions when activated by UV light. Unfortunately, UV light is not an abundant source of radiation, and both green sources of light and sunlight typically contain only 5–8% of UV,28 which limits the efficiency of ZnONPs in these conditions. The effectiveness of photocatalysis relies heavily on two key factors related to ZnO nanostructures. First, it depends on how much of the solar spectrum these nanostructures can capture. Efficient utilization of a broader range of wavelengths ensures better overall performance. Second, the life-time of the formed electron–hole pair during the photocatalytic process plays a crucial role. The longer the pair remains separated without recombination, the higher the photocatalytic efficiency achieved.
A three-pronged strategy can be embraced to heighten the efficiency of zinc oxide nanoparticles, which encounter constraints due to their wide band-gap. Firstly, the absorption of sunlight can be elongated to engender a larger number of electron–hole pairs. Secondly, the photons-to-electrons conversion can be fine-tuned to augment proficiency further. Lastly, prolonging the photo-generated electron–hole lifespan pairs can sustain their activity for an extended period.29–38 Overcoming these challenges demands the implementation of modifications involving an assortment of additives, such as organic dyes, metal complexes, and metal or non-metal ions. These adjustments present a promising resolution to address the aforementioned limitations.39
Photosensitization involves a process where a photosensitizer is adsorbed onto the surface of a semiconductor. This photosensitizer absorbs light energy and then converts it into chemical energy. Under favorable conditions, this energy is transferred to typically unreactive substrates through photochemical reactions. Among the most extensively studied visible light photosensitizers are diverse organic dyes like riboflavin, Eosin-Y, alizarin red S, rose bengal, inorganic sensitizers, and inorganic metal complexes. When a sensitizer absorbs light, it becomes excited and injects an electron into the conduction band of the semiconductor.40
The hydrogenation of nitro aromatics to produce corresponding amines is a crucial organic transformation widely employed in industries, serving as a starting material for synthesizing a diverse array of organic compounds. However, traditional reduction methods involve using environmentally hazardous chemicals and often lead to undesirable toxic metal sludge generation. Fortunately, advancements have been made in recent times towards greener methodologies for reducing nitroarenes, particularly under visible light conditions. These greener approaches aim to minimize the environmental impact while achieving efficient and sustainable transformations.
This study synthesized a ternary visible light-responsive hybrid catalyst, cyaniding dye-sensitized silver doped zinc oxide nanoparticles denoted as Ag-ZnONPs@Cy, using an entirely green approach. The sensitizer, cyanidin dye, was extracted from fresh black mulberry fruit and utilized to activate pre-fabricated Ag-ZnONPs. The resulting ternary composite was employed to hydrogenate nitroarenes to form the corresponding aminoarenes but with a notable distinction. Instead of using UV light, the catalytic reactions were carried out under blue light irradiation. This innovative approach not only enhances the photocatalytic activity but also underscores the eco-friendly nature of the overall process.
2. Experimental part
2.1. Chemicals, materials, and characterization methodology
All chemical compounds and solvents obtained from Sigma-Aldrich were of analytical quality and utilized as received without additional purification steps. Zinc chloride (CAS#: 7646-85-7, ≥98%, molecular weight: 136.30 g mol−1), silver nitrate (CAS#: 7761-88-8, ≥99%, molecular weight: 168.87 g mol−1), acetonitrile (CAS#: 75-05-8, ≥99.9%, molecular weight: 41.05 g mol−1), acetone (CAS#: 67-64-1, ≥99.5%, molecular weight: 58.08 g mol−1), ethanol (CAS#: 64-17-5, 95%, molecular weight: 46.07 g mol−1) nitroarenes (CAS#: 98-95-3, 586-78-7, 41085-43-2, 7149-70-4, 100-17-4, 100-02-7, 619-72-7, 5401-94-5, 613-50-3, 22280-56-4, 16013-85-7, 38533-61-8). 5 W LED strip lights were employed for irradiation, consisting of a red lamp, a green lamp, a blue lamp, and a white light. The 1H-NMR and 13C-NMR spectra were recorded using a 400 MHz Bruker Avance DRX spectrometer (Billerica, MA, USA). The PerkinElmer spectrophotometer and FT-IR spectra were acquired (Waltham, MA, USA). For structural analysis, an X-ray diffractometer (PANalytical X’PERT-PRO MRD) equipped with a Cu Kα (λ = 0.15406 nm) radiation source was used to scan between 10° and 80° at a rate of 2° min−1. The absorption spectrum was analyzed using a UV–vis diffuse reflectance spectrophotometer (UV-Vis-DRS, SCINCO Model S-4100). For Nanostructural and chemical analyses of the fabricated catalysts, scanning electron microscopy (LV-SEM, JSM-6380LV; JEOL; Sollentuna, Sweden) and energy-dispersive X-ray spectroscopy (EDX, INCAx-sight; Oxford Instruments; Abingdon, United Kingdom) techniques were employed.2.2. Preparation of neem leaf extract
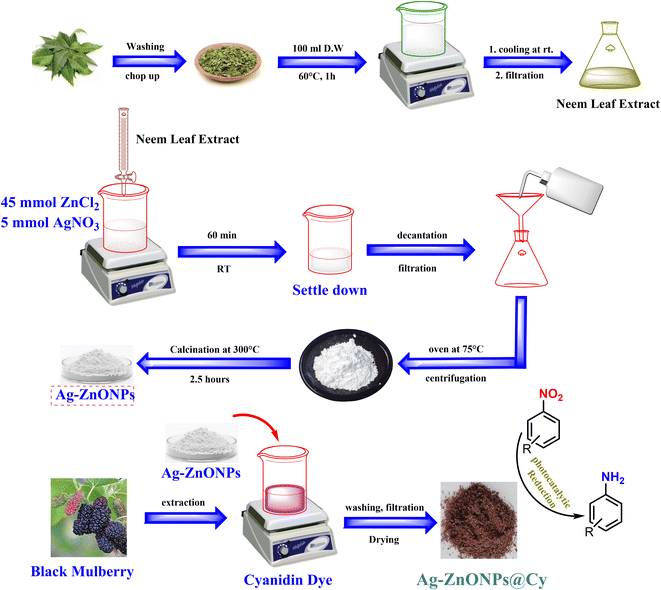
In Sulaimani, Iraq, a batch of fifteen grams of freshly harvested Neem leaves underwent a rigorous washing procedure with distilled water to ensure the removal of any impurities. Following this thorough washing, the leaves were finely chopped and combined with 100 mL of distilled water. The mixture was then heated for approximately one hour at a temperature of 60 °C. After the heating process, the extracts were allowed to cool down before being filtrated using Whatman filter paper. Finally, the filtered extracts were stored and fully prepared for future use.2.3. Procedure for fabrication of Ag-ZnONPs
Silver-doped zinc oxide nanoparticles (Ag-ZnONPs) were produced by combining 45 millimoles of ZnCl2 and 5 millimoles of AgNO3 in a beaker containing 50 milliliters of distilled water (DW) under continuous stirring. The stirring persisted until a clear solution emerged, indicating the complete dissolution of the initial substances. Gradually, the neem leaf extract, previously prepared (100 mL), was added drop by drop from a burette into the stirred solution, maintaining the stirring for approximately 45 minutes. Afterwards, the resulting precipitate settled overnight and was subsequently separated through decantation. The separated precipitate underwent a sequential washing process involving acetone, ethanol, and water. The pure precipitate was then obtained through centrifugation at 4500 rpm for 10 minutes. To achieve Ag-doped ZnONPs in dry powder form, the previously obtained precipitate was placed in an oven at 75 °C for 4 hours. Following this, the material underwent calcination at 300 °C for 2.5 hours.2.4. Procedure for fabrication of Ag-ZnONPs@Cy
A novel ternary composite (Ag-ZnONPs@Cy) was synthesized through a straightforward, green, and cost-effective process. The procedure involved the following steps: To begin, 25 grams of freshly collected black mulberry fruit were carefully washed with water to eliminate any dust or impurities. Subsequently, the black mulberries were placed onto a piece of cotton fabric (cheesecloth) and pressed until all the fruit juice was extracted. Following the successful extraction of the cyanidin dye, the resulting black-violet mulberry juice was combined with 25 mL of distilled water. The mixture was then filtered to eliminate impurities, and the extract was subsequently evaporated and dried in an oven at 75 °C to obtain the powdered form of the cyanidin dye. Subsequently, a 1000 ppm (1 g in 1 L) solution of the dye was prepared. For the adsorption process, 250 mL of this dye solution was taken, and 2 grams of pre-fabricated Ag-ZnONPs were introduced. The mixture was subjected to boiling for 30 minutes. The successful combination of the cyanidin dye from the black mulberry and the silver-doped zinc oxide nanoparticles was confirmed by the change in particle color from white to reddish brown. Following this, the synthesized Ag-ZnONPs@Cy composite was separated using a centrifuge at 4500 rpm for 15 minutes. It was subsequently washed three times with 10 mL of distilled water in each wash. Additional washing steps were carried out using ethanol and acetone to ensure the removal of any remaining impurities. Finally, the composite was dried at 100 °C for 4 hours to obtain the desired product.2.5. Photocatalytic activity: reduction of nitroarenes
The photocatalytic reduction of nitroarenes in the presence of triethanolamine (TEOA) was carried out under blue light irradiation (λ > 425 nm). To initiate the reaction, a fixed amount of catalyst (10 mg) was added to a mixture of 15 mL acetonitrile solution containing 1 mmol (1 equiv.) of nitroarenes and 10 equiv. of TEOA in a test tube. Before commencing the reaction, N2 gas was bubbled into the solution for 45 minutes, and then the reaction vessel was sealed. The reaction was performed under steady stirring (500 rpm), with the reaction mixture exposed to visible light (λ > 425 nm) using a 5 W LEDs light placed 5 cm away from the reaction vessel at room temperature. The progress of the reactions was monitored using UV-vis spectroscopy. Following the completion of the reaction, the photocatalyst was recovered by subjecting the mixture to centrifugation at 5000 rpm for 15 minutes. The solvent was evaporated under reduced pressure, and the resulting product was isolated using silica-gel column chromatography with hexane-ethyl acetate as the eluent. The product yield percentage was determined using the following formula:| Yield (%) = [actual yield (mg)/theoretical yield (mg)] × 100 |
The purity and identity of the resulting products (1b–12b) were analyzed using 1H-NMR and 13C-NMR techniques. An illustrative representation of the complete fabrication and application process of Ag-ZnONPs@Cy in Scheme 1.
3. Results and discussion
3.1. Fabrication of Ag-ZnONPs@Cy
The ternary nanocatalyst was synthesized through a three-step process. Firstly, fresh black mulberry fruit was locally sourced, and its cyanidin dye juice was extracted. Secondly, Ag-ZnONPs were synthesized through an eco-friendly and uncomplicated approach employing neem leaf extract. This extract aids in converting the chemical salt into nanoparticles while also serving as a capping agent during the reduction process.41 Lastly, the Ag-ZnONPs@Cy composite was synthesized through a simple procedure, and further details can be found in the experimental section. Various methods such as DRS, SEM, elemental mapping, XRD, FT-IR, EDX, and UV-visible spectroscopy were employed to characterize the photocatalyst comprehensively. These techniques provided insights into the structural and chemical properties of the nanocatalyst.3.2. Complexation strategy between ZnONPs and cyanidin (Cy) dye
Cyanidin dye, possessing multiple hydroxyl groups, can bind to the surface of zinc oxide nanoparticles through chelation or bridging, releasing water molecules (dehydration), as depicted in Fig. 1. The high electron affinity of zinc compared to titanium makes zinc more prone to exhibit a stronger interaction with ligands.42 The formation of surface complexes occurs between ZnO and the phenolic hydroxyl groups of cyanidin, akin to the observed interactions reported with other phenolic compounds.42–45 | ||
| Fig. 1 Potential approaches for complexation between ZnONPs and cyanidin (Cy) dye are being explored. | ||
The quantity of cyanidin dye in the ternary nano catalyst was determined as follow:
After the adsorption process, the residual dye was separated from Ag-ZnONPs@Cy through centrifugation. The concentration of the dye was determined using UV-Vis spectroscopy at the lambda max (530 nm) of the cyanidin dye. Following the calculation, the concentration was found to be 723 ppm. The amount of adsorbed dye (in milligrams) on the surface of Ag-ZnONPs was then computed using the following equation:
| Adsorbed cyanidin dye (mg g−1) = (C0 − Ce) × V/m |
C0 is the initial concentration of the dye solution (ppm). Ce is the final concentration of the dye solution after adsorption (ppm). V is the volume of the dye solution (L). m is the mass of the metal oxide (g).
The determined amount was found to be 34.625 mg g−1 of cyanidin on Ag-ZnONPs.
3.3. Characterizations
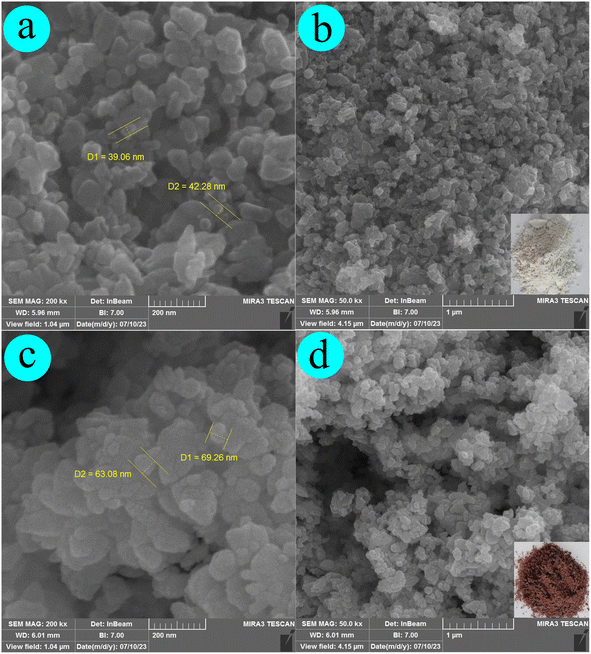
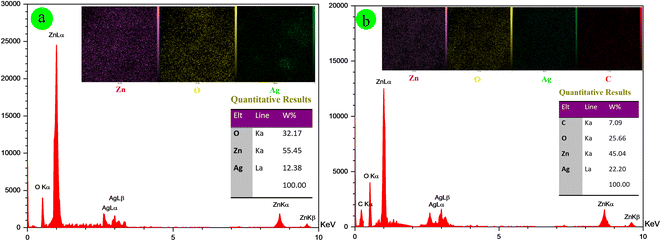
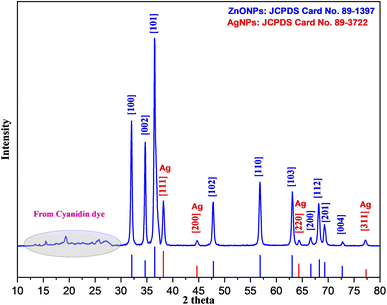
Fig. 2c, d, and 3b depict the SEM, EDX, and elemental mapping results of the composite material Ag-ZnONPs@Cy. Compared with Ag-ZnONPs, an observable growth in particle size (ranging from 60 to 80 nm) is apparent; however, the fundamental shape and morphology remain consistent. The elemental composition analysis reveals the presence of Zn (45.04 W%), O (25.66 W%), Ag (22.20 W%), and C (7.09 W%) elements in Ag-ZnONPs@Cy, confirming the successful synthesis of the composite without any undesirable impurities. These findings are in alignment with those obtained through the X-ray diffraction (XRD) technique.
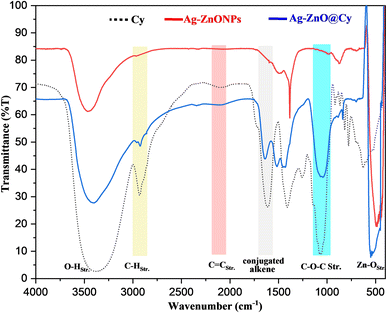
In the spectra of all three compounds, an intense broad peak appeared around 3400 cm−1, attributed to OH stretching vibrations. Additionally, vibrational C–H stretching was observed near 3000 cm−1, C![[double bond, length as m-dash]](https://www.rsc.org/images/entities/char_e001.gif) C stretching was present at 2109 cm−1, and conjugated alkene vibrations were found at 1615 cm−1. Moreover, C–O–C stretching was observed at 1105 cm−1 in both Cy and Ag-ZnO@Cy spectra but was absent in Ag-ZnO. An interesting observation was an intense band in the 500–600 cm−1 range, which served as a characteristic peak for Zn–O stretching in both Ag-ZnO and Ag-ZnO@Cy, but was not present in the cyanidin dye spectrum. These results strongly suggest that cyanidin dye was successfully conjugated with Ag-ZnONPs, as indicated by the presence of specific peaks in Ag-ZnO@Cy that were absent in Ag-ZnO and cyanidin dye spectra.
C stretching was present at 2109 cm−1, and conjugated alkene vibrations were found at 1615 cm−1. Moreover, C–O–C stretching was observed at 1105 cm−1 in both Cy and Ag-ZnO@Cy spectra but was absent in Ag-ZnO. An interesting observation was an intense band in the 500–600 cm−1 range, which served as a characteristic peak for Zn–O stretching in both Ag-ZnO and Ag-ZnO@Cy, but was not present in the cyanidin dye spectrum. These results strongly suggest that cyanidin dye was successfully conjugated with Ag-ZnONPs, as indicated by the presence of specific peaks in Ag-ZnO@Cy that were absent in Ag-ZnO and cyanidin dye spectra.
![[thin space (1/6-em)]](https://www.rsc.org/images/entities/char_2009.gif) cos
cos![[thin space (1/6-em)]](https://www.rsc.org/images/entities/char_2009.gif) θ). Here, D signifies the crystal size, with k representing the crystal shape constant set at 0.90, λ denoting the X-ray wavelength at 0.15406 nm, β indicating the full width at half maximum (FWHM), and θ corresponding to the diffraction angle. The application of this equation yields an average crystallite size of 27.42 nm for the ternary composite.
θ). Here, D signifies the crystal size, with k representing the crystal shape constant set at 0.90, λ denoting the X-ray wavelength at 0.15406 nm, β indicating the full width at half maximum (FWHM), and θ corresponding to the diffraction angle. The application of this equation yields an average crystallite size of 27.42 nm for the ternary composite.
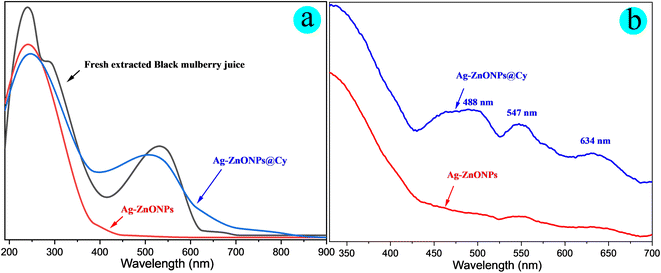
In this study, the optical properties of the fabricated catalysts, unmodified Ag-ZnONPs and Ag-ZnONPs@Cy, were investigated using UV-visible spectroscopy and diffuse reflection spectroscopy (UV-vis DRS) in both liquid and solid states. The obtained results, depicted in Fig. 6, clearly demonstrated that Ag-ZnONPs lacked effective absorption of visible light. In contrast, Ag-ZnO@Cy exhibited a substantial extension of its visible light-harvesting range, attributed to the broad overlap of the dye (Cy) with the visible light spectrum (350–650 nm). This enhanced visible light absorption confirmed the successful combination of ZnONPs with the dye (Cy) in Ag-ZnO@Cy. Due to its ability to efficiently harness visible light, Ag-ZnO@Cy presents itself as a promising candidate for catalyzing organic transformations under green conditions with different visible light sources.
3.4. Photocatalytic activity
The powders of Ag-ZnONPs and Ag-ZnONPs@Cy exhibited colors of white and reddish-brown, respectively, as shown in Fig. S1 of the ESI.† The UV-vis and diffuse reflectance spectra (DRS) of Ag-ZnONPs and Ag-ZnONPs@Cy are depicted in Fig. 6a and b. In Fig. 6a, the UV-vis spectroscopy of the synthesized catalyst, both before and after being coupled with the cyanidin dye, is explained. Ag-ZnONPs@Cy displayed wide absorption bands in the visible light range (350–650 nm), with a peak absorption wavelength of around 495 nm. On the other hand, unmodified Ag-ZnONPs showed no significant absorption activity. It is worth noting that the λmax (peak absorption wavelength) of Ag-ZnONPs@Cy was shifted towards the blue region compared to the free cyanidin (Cy) dye. The solid-phase diffuse reflectance spectroscopy (DRS) analysis of the catalysts is illustrated in Fig. 6b. Interestingly, the modified Ag-ZnONPs exhibited a λmax at 488 nm, and two additional peaks were observed at 547 nm and 634 nm. In contrast, the unmodified Ag-ZnONPs displayed a weak absorption peak. This phenomenon can be attributed to the surface plasmon resonance (SPR) of silver (Ag) nanoparticles or atom clusters located on the surface of the metal oxides, as described by previous studies.55,56Initially, the photocatalytic performance of Cy, Ag-ZnONPs, and Ag-ZnONPs@Cy in catalyzing the reduction of nitrobenzene to produce aniline under visible light irradiation (λ > 425 nm) was examined. The reaction conditions for converting nitrobenzene to aniline are outlined in Scheme 2. When Cy dye was used alone, no products were detected. In contrast, employing the Ag-ZnONPs catalyst resulted in an isolated yield of 18% in the presence of TEOA after 30 minutes. Notably, in the case of Ag-ZnONPs@Cy, an impressive yield of 98% was achieved.
The efficiency of photocatalysis for both catalysts was assessed in the context of reducing nitrobenzene (NB) to generate aniline (AN) using acetonitrile as the solvent. Upon initiating the reaction, the maximum absorption of NB was noted at a wavelength of 270 nm. The UV-vis spectra illustrating the photo-reduction process of NB to AN were provided in Fig. 7a and b for Ag-ZnONPs and Ag-ZnONPs@Cy, respectively.
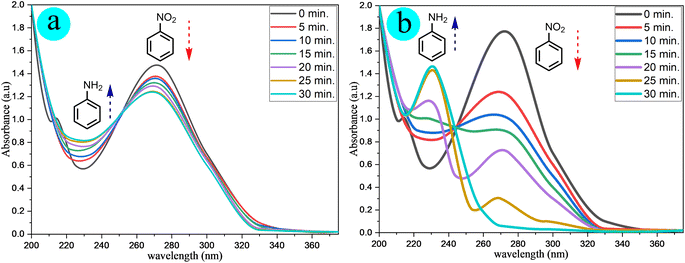 | ||
| Fig. 7 UV-visible spectra obtained after 30 minutes for the transformation of NB to AN using (a) Ag-ZnONPs and (b) Ag-ZnONPs@Cy. | ||
As the reaction commenced, a new peak emerged at 230 nm, corresponding to aniline formation, while the intensity of the 270 nm peak diminished. This reduction in intensity indicates the conversion of NB to AN, aligning with findings reported in prior investigations.57,58
Drawing from the results of the conversion analysis, it can be inferred that the integration of the cyanidin dye significantly amplifies the photocatalytic effectiveness of Ag-ZnONPs. Consequently, throughout this study, Ag-ZnONPs@Cy was employed for hydrogenating aromatic nitro compounds into their corresponding amino compounds.
Several control experiments were also performed to determine the optimum condition before using the catalyst for hydrogenation of nitrobenzene derivatives which is summarized in Table 1, which includes performing the reaction in the dark, testing different LED light sources, solvent effect, amount of catalyst loading for the conversion, sacrificial electron donor (TEOA), the presence of O2 as electron trapper.
| Entry | Light source | Cat. (X mg) | Solvent | Yield (%) |
|---|---|---|---|---|
| a Standard condition: NB (1 mmol, 1 equiv.), CH3CN (15 mL), TEOA (10 equiv.) blue LEDs (3 W, λ > 425 nm) under N2 and the reaction vessel was sealed. The reaction was carried out at room temperature in 30 min reaction time.b The reaction performed in air.c The reaction was conducted without TEOA.d The reaction time was 2 h. | ||||
| 1 | White LEDs-3W | 10 | CH3CN | 42 |
| 2 | Green LEDs-3W | 10 | CH3CN | 74 |
| 3 | Blue LEDs-3W | 10 | CH3CN | 98 |
| 4 | Red LEDs-3W | 10 | CH3CN | 19 |
| 5 | Dark | 10 | CH3CN | 0 |
| 6 | Blue LEDs-3W | — | CH3CN | 2 |
| 7 | Blue LEDs-3W | 2 | CH3CN | 25 |
| 8 | Blue LEDs-3W | 3 | CH3CN | 48 |
| 9 | Blue LEDs-3W | 5 | CH3CN | 83 |
| 10 | Blue LEDs-3W | 10 | CH3CN | 98 |
| 11 | Blue LEDs-3W | 15 | CH3CN | 72 |
| 12 | Blue LEDs-3W | 10 | H2O | Trace |
| 13 | Blue LEDs-3W | 10 | EtOH | 31 |
| 14 | Blue LEDs-3W | 10 | DMSO | 51 |
| 15 | Blue LEDs-3W | 10 | EtOAc | 56 |
| 16b | Blue LEDs-3W | 10 | CH3CN | 29 |
| 17c | Blue LEDs-3W | 10 | CH3CN | 0 |
| 18d | Blue LEDs-3W | 10 | CH3CN | 98 |
Observations were made indicating that the reaction does not proceed in the absence of light (Table 1, entry 5). Conversely, using blue LED light leads to a higher yield percentage (Table 1, entry 3) compared to the outcomes with white, green, and red LEDs (Table 1, entries 1, 2, and 4). Various solvents, including ethanol, acetonitrile, DMSO, ethyl acetate, and water, were tested, and CH3CN emerged as the optimal solvent, providing a superior yield percentage (Table 1, entry 3). Notably, using 10 mg of the loaded catalyst yielded improved results (Table 1, entry 3). The multifunctional character of TEOA has been demonstrated in previous studies,58,59 serving as an electron donor to the dye sensitizer to restore the oxidized form to its original state and also acting as a proton source for hydrogenation of nitroarenes to aminoarenes.60,61 The absence of TEOA led to the non-formation of the product in the reaction (Table 1, entry 17). Similarly, conducting the reaction in the presence of atmospheric O2 instead of N2 did not yield the desired product (Table 1, entry 16).
Utilizing the optimal conditions (Table 1, entry 3) for the reduction of nitroarenes to aminoarenes (as shown in Table 2), the desired products were obtained successfully, achieving remarkable percentage yields. These initial outcomes from the developed ternary composite (Ag-ZnONPs@Cy) for efficient hydrogenation provide strong motivation for further explorations in the realm of photoredox catalysis, encompassing a diverse array of organic transformations.
| Entry | Substrate | Product | Time (min) | Isolated yield (%) |
|---|---|---|---|---|
| a The reaction condition: nitroarene (1 mmol, 1 equiv.), TEOA (10 equiv.), catalyst (10 mg), solvent; CH3CN (15 mL), N2 gas, blue LEDs light (3 W, λ > 425 nm) and room temperature. | ||||
| 1 |  |
 |
30 | 98 |
| 2 |  |
 |
40 | 96 |
| 3 |  |
 |
55 | 89 |
| 4 |  |
 |
45 | 93 |
| 5 |  |
 |
75 | 95 |
| 6 |  |
 |
35 | 91 |
| 7 |  |
 |
25 | 97 |
| 8 |  |
 |
60 | 90 |
| 9 |  |
 |
85 | 98 |
| 10 |  |
 |
65 | 94 |
| 11 |  |
 |
50 | 82 |
| 12 |  |
 |
55 | 85 |
3.5. Regeneration and reusability of the catalyst
The practical application of photocatalysts heavily relies on their reusability, making it a pivotal aspect to investigate. In this context, the recyclability of Ag-ZnONPs@Cy was examined through a series of six recycling experiments involving NB reduction. After each reduction process, the photocatalyst was retrieved through centrifugation, followed by washing, drying, and subsequent utilization in the succeeding cycle.Fig. 8a and b depict the IR spectrum and XRD patterns of the ternary catalyst, both before initial use and after undergoing six usage cycles. It is evident that there are no significant alterations in the structure of the catalyst. This observation serves as a confirmation of the exceptional stability over prolonged usage periods. Fig. 8c displays the progressive photo reduction of NB to AN by Ag-ZnONPs@Cy across six successive cycles. Notably, there is no discernible decline in the photocatalytic efficiency, with only a marginal 2.5% decrease in efficacy. These results validate the remarkable and consistent photocatalytic stability of Ag-ZnONPs@Cy over multiple cycles, alongside its exceptional performance.
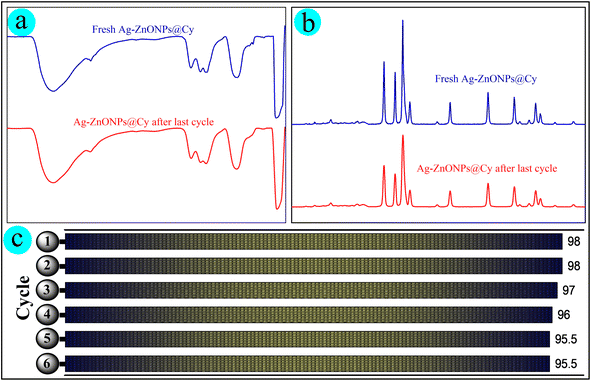 | ||
| Fig. 8 Representation of (a) infrared spectra, (b) X-ray diffraction patterns, and (c) the reusability of Ag-ZnONPs@Cy after six cycles, recovering at the end of each reduction cycle. | ||
3.6. Mechanistic study
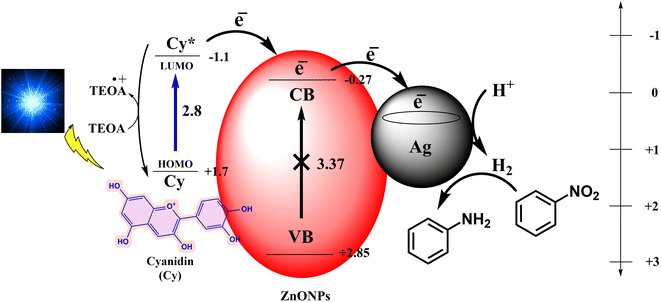
Utilizing findings from UV-vis and DRS investigations, along with insights from comprehensive literature reviews,51–54 it is evident that the cyanidin dye exhibits a band-gap energy situated within the visible light spectrum, as depicted in Fig. 6a and b. This characteristic renders the dye proficient in absorbing photonic energy, converting it into electronic energy. Furthermore, in the context of a photo-redox catalysis system, the cyanidin dye demonstrates the ultrafast capability to inject electrons into the associated metal oxides, thereby facilitating efficient electron transfer.62To uncover the inherent reaction mechanism, the utilization of 1,4-benzoquinone served as a means to determine if the process adheres to a radical pathway. Notably, benzoquinone is recognized for its capability to quench superoxide radicals.63 Despite this, it was noted that the introduction of benzoquinone had no impact on the reaction rate. Consequently, it is reasonable to deduce that the reaction mechanism does not rely on a radical pathway.
Based on the findings derived from this study, along with a comprehensive review of the literature,40,59,61,64,65 as well as quenching and control experiments, we have formulated a mechanistic proposal for the conversion of nitroarenes to aminoarenes utilizing cyanidin dye-sensitized Ag-ZnONPs. The sequence is outlined as follows: upon exposure to blue light, the cyanidin dye transitions from its ground state (Cy) to an excited state (Cy*). In this excited state, the dye molecule injects electrons into the conduction band of ZnONPs. Subsequently, these electrons are transferred to the surface of Ag, leading to the generation of H2 by extracting a proton from the sacrificial donor (TEOA), thereby facilitating the reduction process. The catalytic cycle concludes as the sacrificial donor reduces the excited dye back to its initial state (Cy), thus completing the cycle. A comprehensive depiction of this process can be found in Fig. 9.
4. Conclusion
This study presents the successful modification of Ag-doped ZnONPs into a visible-light-active hybrid photocatalyst by integrating them with the cyanidin (Cy) dye sensitizer. The resulting ternary material (Ag-ZnONPs@Cy) was synthesized using a multistep, straightforward, and environmentally conscious green method. Various characterization techniques such as FT-IR, XRD, SEM, elemental mapping, EDX, UV-Vis, and DRS were employed to ascertain the identity and photocatalytic efficacy of the produced ternary composite. Subsequently, this composite was employed as a photocatalyst to reduce aromatic nitro compounds into their corresponding amines under blue light irradiation. Impressively, the reaction demonstrated remarkably short completion times (25–85 minutes) along with good to excellent isolated yield percentages. Introducing a sacrificial electron donor (TEOA) facilitated electron and proton mediation within the reaction. A series of control experiments were conducted to elucidate the mechanistic pathway, revealing that the reaction proceeded through an electron transfer route. Given the pivotal importance of recovery and reusability in heterogeneous photocatalysts, the regeneration and reusability of the fabricated catalyst were explored. The results indicated that the catalyst maintained excellent photocatalytic activity for at least six cycles upon regeneration. Overall, the outcomes from this study underscore the potential of the ternary composite Ag-ZnONPs@Cy as a promising photocatalyst for diverse organic transformations under visible light exposure. This approach offers a straightforward, cost-effective, and environmentally friendly avenue for achieving these transformations.Conflicts of interest
The author declares no conflict of interest.References
- Z. Long, Q. Li, T. Wei, G. Zhang and Z. Ren, J. Hazard. Mater., 2020, 395, 122599 CrossRef CAS PubMed.
- M. Kokkonen, P. Talebi, J. Zhou, S. Asgari, S. A. Soomro, F. Elsehrawy, J. Halme, S. Ahmad, A. Hagfeldt and S. G. Hashmi, J. Mater. Chem. A, 2021, 9, 10527–10545 RSC.
- D. A. Kader, S. O. Rashid and K. M. Omer, RSC Adv., 2023, 13, 9963–9977 RSC.
- J. J. Samuel and F. K. Yam, Mater. Res. Express, 2020, 7, 015051 CrossRef CAS.
- P. Riente and T. Noël, Catal. Sci. Technol., 2019, 9, 5186–5232 RSC.
- D. A. Kader and S. Omer, Mol. Catal., 2023, 547, 113409 CrossRef CAS.
- P. V. Govardhana Reddy, B. Rajendra Prasad Reddy, M. Venkata Krishna Reddy, K. Raghava Reddy, N. P. Shetti, T. A. Saleh and T. M. Aminabhavi, J. Environ. Manage., 2021, 279, 111603 CrossRef CAS PubMed.
- C. Anushree, D. Nanda Gopala Krishna and J. Philip, J. Mol. Liq., 2021, 337, 116429 CrossRef CAS.
- H. Dabhane, S. Ghotekar, P. Tambade, S. Pansambal, R. Oza and V. Medhane, Eurasian J. Chem., 2021, 12, 86–108 CAS.
- M. Nasrollahzadeh, Z. Nezafat, M. G. Gorab and M. Sajjadi, Mol. Catal., 2020, 484, 110758 CrossRef.
- P. Chen, Z. Guo, X. Liu, H. Lv, Y. Che, R. Bai, Y. Chi and H. Xing, J. Mater. Chem. A, 2019, 7, 27074–27080 RSC.
- Y. Rangraz, F. Nemati and A. Elhampour, Appl. Surf. Sci., 2020, 507, 145164 CrossRef CAS.
- K. Kombaiah, J. J. Vijaya, L. J. Kennedy, K. Kaviyarasu, R. J. Ramalingam and H. A. Al-Lohedan, J. Nanosci. Nanotechnol., 2018, 19, 2590–2598 CrossRef PubMed.
- R. Akbari, J. Mater. Sci.: Mater. Electron., 2021, 32, 15801–15813 CrossRef CAS.
- V. Cittrarasu, D. Kaliannan, K. Dharman, V. Maluventhen, M. Easwaran, W. C. Liu, B. Balasubramanian and M. Arumugam, Sci. Rep., 2021, 11, 1–15 CrossRef PubMed.
- S. Pan, T. B. Goudoulas, J. Jeevanandam, K. X. Tan, S. Chowdhury and M. K. Danquah, Front. Bioeng. Biotechnol., 2021, 9, 1–9 CrossRef.
- N. Maity, N. Bruchiel-Spanier, O. Sharabani-Yosef, D. Mandler and N. Eliaz, Mater. Adv., 2023, 4, 3026–3036 RSC.
- P. Mahadevi and S. Sumathi, Results Chem., 2023, 6, 101026 CrossRef CAS.
- A. A. Mohamed, A. Fouda, M. A. Abdel-Rahman, S. E. D. Hassan, M. S. El-Gamal, S. S. Salem and T. I. Shaheen, Biocatal. Agric. Biotechnol., 2019, 19, 101103 CrossRef.
- M. Carofiglio, S. Barui, V. Cauda and M. Laurenti, Appl. Sci., 2020, 10, 5194 CrossRef CAS PubMed.
- R. Aboorvakani, S. J. Kennady Vethanathan and K. U. Madhu, J. Alloys Compd., 2020, 834, 155078 CrossRef CAS.
- Q. A. Drmosh, I. Olanrewaju Alade, M. Qamar and S. Akbar, Chem. – Asian J., 2021, 16, 1519–1538 CrossRef CAS PubMed.
- R. Liu, Y. Chen, S. Ding, Y. Li and Y. Tian, Sol. Energy Mater. Sol. Cells, 2019, 203, 110161 CrossRef CAS.
- A. M. Chandran, S. Varun, S. C. Karumuthil, S. Varghese and P. K. S. Mural, ACS Appl. Nano Mater., 2021, 4, 1798–1809 CrossRef CAS.
- M. Goswami, Opt. Mater., 2020, 109, 110400 CrossRef CAS.
- T. Varadavenkatesan, E. Lyubchik, S. Pai, A. Pugazhendhi, R. Vinayagam and R. Selvaraj, J. Photochem. Photobiol., B, 2019, 199, 111621 CrossRef CAS PubMed.
- K. Singh, Neha, M. Kumar, H. Singh and G. Singh, Mater. Today: Proc., 2023 DOI:10.1016/j.matpr.2023.03.002.
- I. Kohli, R. Zubair, A. B. Lyons, A. F. Nahhas, T. L. Braunberger, M. Mokhtari, E. Ruvolo, H. W. Lim and I. H. Hamzavi, Photochem. Photobiol., 2019, 95, 1285–1287 CrossRef CAS PubMed.
- K. R. Reddy, M. Hassan and V. G. Gomes, Appl. Catal., A, 2015, 489, 1–16 CrossRef CAS.
- A. Dhakshinamoorthy, Z. Li and H. Garcia, Chem. Soc. Rev., 2018, 47, 8134–8172 RSC.
- X. Yu and S. M. Cohen, J. Am. Chem. Soc., 2016, 138, 12320–12323 CrossRef CAS PubMed.
- X. Lang, J. Zhao and X. Chen, Angew. Chem., Int. Ed., 2016, 55, 4697–4700 CrossRef CAS PubMed.
- M. Hosseini-Sarvari, M. Koohgard, S. Firoozi, A. Mohajeri and H. Tavakolian, New J. Chem., 2018, 42, 6880–6888 RSC.
- C. Xu, P. Ravi Anusuyadevi, C. Aymonier, R. Luque and S. Marre, Chem. Soc. Rev., 2019, 48, 3868–3902 RSC.
- J. Luo, S. Zhang, M. Sun, L. Yang, S. Luo and J. C. Crittenden, ACS Nano, 2019, 13, 9811–9840 CrossRef CAS PubMed.
- A. Truppi, F. Petronella, T. Placido, M. Striccoli, A. Agostiano, M. L. Curri and R. Comparelli, Catalysts, 2017, 7, 100 CrossRef.
- G. Zhang, G. Kim and W. Choi, Energy Environ. Sci., 2014, 7, 954–966 RSC.
- N. Zhou, V. López-Puente, Q. Wang, L. Polavarapu, I. Pastoriza-Santos and Q. H. Xu, RSC Adv., 2015, 5, 29076–29097 RSC.
- R. Medhi, M. D. Marquez and T. R. Lee, ACS Appl. Nano Mater., 2020, 3, 6156–6185 CrossRef CAS.
- S. Bhar and R. Ananthakrishnan, RSC Adv., 2015, 5, 20704–20711 RSC.
- S. Slathia, T. Gupta and R. P. Chauhan, Phys. B, 2021, 621, 413287 CrossRef CAS.
- H. Nishikiori, D. Natori, H. Ebara, K. Teshima and T. Fujii, J. Photochem. Photobiol., A, 2016, 327, 51–57 CrossRef CAS.
- M. Ben Manaa, N. Issaoui, Y. O. Al-Ghamdi, H. Belmabrouk and A. Ben Lamine, RSC Adv., 2020, 10, 27615–27632 RSC.
- H. Shahroosvand, P. Abbasi, M. Ameri and M. Riahi, Int. J. Photoenergy, 2011, 2011, 1–10 CrossRef.
- T. Kamegawa, H. Seto, S. Matsuura and H. Yamashita, ACS Appl. Mater. Interfaces, 2012, 4, 6635–6639 CrossRef CAS PubMed.
- S. Jeyaram and T. Geethakrishnan, Results Opt., 2020, 1, 100010 CrossRef.
- E. Shah, P. Mahapatra, A. V. Bedekar and H. P. Soni, RSC Adv., 2015, 5, 26291–26300 RSC.
- P. K. Khanna, N. Singh, D. Kulkarni, S. Deshmukh, S. Charan and P. V. Adhyapak, Mater. Lett., 2007, 61, 3366–3370 CrossRef CAS.
- R. Aladpoosh and M. Montazer, Carbohydr. Polym., 2015, 126, 122–129 CrossRef CAS PubMed.
- T. Tchouank Tekou Carol, A. Srivastava, J. Mohammed, S. Sharma, G. Mukhtar and A. K. Srivastava, SN Appl. Sci., 2020, 2, 1–8 Search PubMed.
- M. Bužančić Milosavljević, A. Mravak, M. Perić Bakulić and V. Bonačić-Koutecký, RSC Adv., 2023, 13, 6010–6016 RSC.
- K. Galappaththi, A. Lim, P. Ekanayake and M. I. Petra, Int. J. Photoenergy, 2017, 2017, 1–6 CrossRef.
- P. Ekanayake, M. R. R. Kooh, N. T. R. N. Kumara, A. Lim, M. I. Petra, V. N. Yoong and L. C. Ming, Chem. Phys. Lett., 2013, 585, 121–127 CrossRef CAS.
- K. Galappaththi, P. Ekanayake and M. I. Petra, Sol. Energy, 2018, 161, 83–89 CrossRef CAS.
- I. Ahmad, E. Ahmed and M. Ahmad, SN Appl. Sci., 2019, 1, 1–12 Search PubMed.
- W. Liu, D. Chen, S. H. Yoo and S. O. Cho, Nanotechnology, 2013, 24, 405706 CrossRef PubMed.
- J. Zhang, T. Yao, H. Zhang, X. Zhang and J. Wu, Nanoscale, 2016, 8, 18693–18702 RSC.
- T. Akhtar, H. Nasir, E. Sitara, S. A. B. Bukhari and J. W. Schwank, Surf. Interfaces, 2023, 39, 102997 CrossRef CAS.
- S. Füldner, T. Mitkina, T. Trottmann, A. Frimberger, M. Gruber and B. König, Photochem. Photobiol. Sci., 2011, 10, 623–625 CrossRef PubMed.
- A. C. Tsipis and A. A. Sarantou, Dalton Trans., 2021, 50, 14797–14809 RSC.
- S. Füldner, R. Mild, H. I. Siegmund, J. A. Schroeder, M. Gruber and B. König, Green Chem., 2010, 12, 400–440 RSC.
- N. J. Cherepy, G. P. Smestad, M. Gra and J. Z. Zhang, J. Phys. Chem. B, 1997, 5647, 9342–9351 CrossRef.
- O. Fónagy, E. Szabó-Bárdos and O. Horváth, J. Photochem. Photobiol., A, 2021, 407, 113057 CrossRef.
- S. Kohtani, S. Nishioka, E. Yoshioka and H. Miyabe, Catal. Commun., 2014, 43, 61–65 CrossRef CAS.
- S. Kohtani, M. Mori, E. Yoshioka and H. Miyabe, Catalysts, 2015, 5, 1417–1424 CrossRef CAS.
Footnote |
| † Electronic supplementary information (ESI) available. See DOI: https://doi.org/10.1039/d3ra06448d |
| This journal is © The Royal Society of Chemistry 2023 |

