 Open Access Article
A CTAB-assisted PANI-MoS2 nanosheet flower morphology for the highly sensitive electrochemical detection of hydrazine†
Ganesha H. ,
Veeresh S.,
Nagaraju Y. S. and
H. Devendrappa
 *
*
Department of Physics Mangalore University, Mangalagangothri-574199, India. E-mail: dehu2010@gmail.com
First published on 30th November 2023
Abstract
In this work, cetyl trimethylammonium bromide (CTAB)-assisted polyaniline-molybdenum disulfide (CPANI-MoS2) nanosheets with a flower morphology have been synthesized through in situ polymerization and a hydrothermal method. The composite was analyzed for structural modification through X-ray diffraction (XRD) to examine chemical changes and the presence of functional groups via Fourier transform infrared (FTIR) and Raman spectroscopy techniques. The surface morphology was identified by field-emission scanning electron microscopy (FESEM) and high-resolution transmission electron microscopy (HR-TEM) techniques. The CPANI-MoS2 nanosheet glassy carbon electrode (GCE) offers a novel strategy for the electrochemical detection of carcinogenic hydrazine. The cyclic voltammetry (CV) curve demonstrated a quasi-reversible behaviour with a high-surface area. Furthermore, differential pulse voltammetry (DPV) analysis of hydrazine detection showed a wide linear range from 10 μM to 100 μM, a low limit of detection of 0.40 μM, and a high sensitivity of 7.23 μA μM cm−2. The determination of hydrazine in a water sample and the recovery percentage were found to be 100.31% and 103.73%, respectively. The CPANI-MoS2 nanosheet GCE significantly contributed to the high electroanalytical oxidation activity due to the CTAB surfactant modifying the flower-like nanosheet morphology, which enables the easy adsorption of hydrazine analyte species and exhibits a high current rate with a rapid detection response.
1. Introduction
The advancement of science, technology, and industrialization has a direct impact on environmental pollution and human health. Protecting human health from harmful chemical species is one of the most challenging tasks in the modern world. This is because various chemical contents can enter the human body through air, water, and food. Hydrazine is one such substance, and acute exposure to it can damage the liver, kidneys, and the central nervous system.Hydrazine plays a distinctive role in various applications, including catalysts, antioxidants, rocket propellants, anticorrosion processes, reducing agents, and fuel cells. However, it is crucial to note that hydrazine is a highly carcinogenic substance, which causes environmental pollution and human health problems as it is a common water pollutant owing to the large amounts of chemicals used in agriculture and industrial fields.1–4 Hydrazine is a water-soluble compound. Therefore, the human body can easily absorb hydrazine through oral intake, inhalation, or skin. Once absorbed, it severely affects several internal organs, such as the central nervous system, liver, lungs, and kidneys.5–7 In this view, it is essential to develop a heterostructure electroactive sensing material for hydrazine detection by an electrochemical analytical technique. The electrochemical analytical technique has drawn much attention from researchers due to its high accuracy, selectivity, sensitivity, simultaneous detection, high precision, safety, and easy operating system with voltammetry techniques.8–12
Transition metal dichalcogenides (TMDs) are considered 2-dimensional nanomaterials and are ideal candidates for the construction of electrochemical sensors for the detection of analyte species owing to the flexibility of their morphological structure and high surface adsorption properties.13,14 TMD species also have a special electronic structure, which is assembled like X–M–X layered atoms. They occurs in various phases like 1T, 2H, and 3R, and their existence in different states, such as semi-conducting, semi-metallic, and superconductor states, makes them an excellent candidate for electrochemical analysis.15,16 The TMD-doped nanomaterials possess a high-volume ratio and layered structure that provides a greater number of active sites due to atomic defects, which improves the detection level of the analyte species, stability, selectivity, and sensitivity of the material.17,18
MoS2 is a desirable electroactive material for electrochemical detection. It has distinguished physical and chemical properties19 with strong absorption behaviour, a unique-layered structure, and has adopted various synthesis methodologies for a tune-up of the desirable size and shape of the morphology structure from the doping and de-doping process. They provide a wide electroactive surface area, excellent chemical stability, biocompatibility, high electrical and electronic transport properties,20–22 and the sandwiched layer structure is arranged by the S–Mo–S trilayer atoms and the weak van der Waals interactions in a crystal layered structure.23–25 The MoS2 layered edges increase the electrocatalytic adsorption activity, and it is a highly stable state in environmental conditions. However, it still possesses a lower ionic conductivity and limited electrochemical properties. In this view, any conductive material such as metal oxide, conducting polymers (CPs), and graphene species26,27 doped with MoS2 enhances the conductivity and improves the electrochemical properties. Polyaniline (PANI) is one of the most fascinating CPs due to its chemical stability, flexibility, high-temperature resistance, and conductivity, which greatly depends on the mechanism of the acid–base pair and stabilizes the morphology structure. PANI contains a conjugated bond with an amine and imine structure to facilitate the electrochemical sensing properties.28–30
In the PANI-doped MoS2, two individual well-known compounds demonstrate their unique electronic properties, large electroactive material surface volume ratio, and high electrical conductivity, which enhance the limit of detection, sensitivity, accuracy, and selectivity. Because CTAB may stabilize the nanostructure and create a greater number of layered edges in the composite, MoS2 offers plenty of oxygen features for the target analyte molecule interaction, and it may provide high sensing properties in the composite.
Recently, some research groups have made remarkable developments in nanostructured materials for the electrochemical detection of hydrazine analytes. Mejri et al. proposed a new strategy of a MoS2/Au/CM PGE electrode used for hydrazine and nitride electrocatalytic activity, and the electrode manifests a low limit of detection with a sensitivity of 0.051 μA μM−1.31 M. Faisal et al. reported that a novel PANI/SrTiO3-modified GCE exhibited outstanding performance towards the detection of hydrazine substances, and achieved a sensitivity of 0.2128 μA μM−1 cm−2 from the LSV technique.32 Furthermore, Afshari et al. fabricated a PANI/g-C3N4/AgNPs ternary composite GCE, and it demonstrated high catalytic activity for the sensing of the hydrazine analyte.33 In addition, A. M. Villa Manso et al. presented a 2D MoS2/SPGE for the electrochemical detection of hydrazine in a water sample, and the fabricated electrode was used to detect the toxic substance in river and tap water samples.34
In this present work, CTAB-assisted flower-like CPANI-MoS2 nanosheets are effectively synthesized by an in situ chemical and hydrothermal process. The soft template CTAB plays a major role in the modification of the surface morphology, and reduces the size of the nanomaterial. Thus, the electrochemical behaviour depends on the electrode active material. The CTAB-assisted CPANI-MoS2 nanosheets were studied to reveal the structural, morphology, and electrochemical properties. It is an ideal candidate electrochemical sensor for the detection of hydrazine analytes. It demonstrates a low limit of detection (LOD) of 0.40 μM, a high sensitivity of 7.23 μA μM cm−2, a wide linear range of 10 μM to 100 μM and good storage stability, repeatability, selectivity, and excellent recovery in real samples.
2. Experimental techniques
2.1 Materials used
The aniline monomer, ammonium thiomolybdate, cetyl trimethyl ammonium bromide (CTAB), ammonium peroxy disulfate (APS), citric acid (CA), N-methyl-2-pyrrolidone (NMP) ammonia, thiourea, NaH2PO4, and Na2HPO4 were purchased from Merck and Sigma-Aldrich, India.2.2 Synthesis of polyaniline
Polyaniline (PANI) was synthesized by in situ-polymerization method. A 0.3 M concentration of aniline monomer dissolved in 50 ml of 1 M HCl and 0.075 M of APS dissolved in 50 ml of 1 M HCl were stirred separately for 30 minutes. The oxidizing agent APS aqueous solution was added dropwise into the aniline without stirring. Immediately, the color changed from dark purple to dark green, and then kept for 12 hours to allow for the polymerization reaction. The collected product was washed with distilled water and dried in a vacuum at 60 °C overnight.2.3 Synthesis of polyaniline-molybdenum disulfide nanosheets
First, 2.17 g of (NH4)6Mo7O24·4H2O and 0.2 ml of aniline monomer were dissolved in 50 ml of deionized water. The mixture was sonicated for 60 minutes, and then the pH was adjusted to 4 using 1 M HCl. The solution turned into a slightly white coloured precipitate. It was stirred continuously for 30 minutes, and then 0.55 g of APS and 0.109 g of CTAB surfactant were gradually added. The pH value was adjusted to 1.7 using 1 M HCl, and the mixture was then constantly stirred at 50 °C for 6 hours. A quantity of 1.37 g of thiourea was separately dissolved in 10 ml of deionized water, and slowly added to the above solution. The homogeneously dispersed solution was then transferred to a Teflon-lined autoclave and heated at 200 °C for 24 hours. The collected sample was centrifuged at 8000 rpm for 60 minutes, and washed with water and ethanol subsequently to remove any undissolved content, and then dried in a vacuum at 60 °C. The obtained product CTAB-assisted polyaniline-molybdenum disulfide nanosheets were named CPANI-MoS2 nanosheets. For comparison purpose, the polyaniline-molybdenum disulfide was synthesized via a similar procedure without using the CTAB surfactant. The collected product was assigned as PANI-MoS2.3. Material characterization
The synthesized PANI and CPANI-MoS2 nanosheets, structural changes, and crystallinity of the material were characterized using FTIR, Raman spectroscopy, and X-ray diffractometer methods. The surface morphology was investigated by Sigma-Zeiss Field emission scanning electron microscopy (FESEM), elemental mapping, and microstructural atomic defects confirmed by high-resolution transmission electron microscopy (HR-TEM) and high-resolution scanning electron microscopy (HR-STEM) techniques Scheme 1.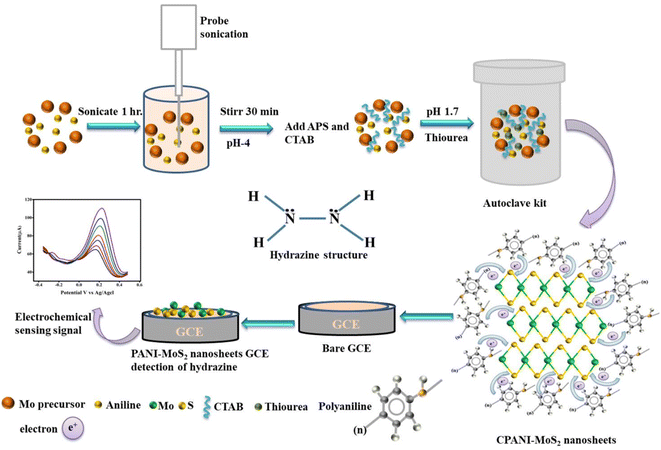 | ||
| Scheme 1 The schematic represents the synthesis and fabrication of the working electrode of CPANI-MoS2 nanosheets. | ||
3.1 Fabrication of the PANI, PANI-MoS2 and CPANI-MoS2 nanosheets GCE
To fabricate the PANI, PANI-MoS2 and CPANI-MoS2 nanosheets GCE, typically the GCE electrode was firstly modified using 1.0 μm, 0.3 μm, and 0.05 μm alumina slurry on a polishing pad, then the GCE electrode was cleaned with acetone, ethanol, and water by ultrasonication. The prepared sample was mixed with a NMP solvent (70![[thin space (1/6-em)]](https://www.rsc.org/images/entities/char_2009.gif) :
:![[thin space (1/6-em)]](https://www.rsc.org/images/entities/char_2009.gif) 30 wt%), and the dispersed homogeneous slurry was then drop-casted onto the GCE surface and vacuum-dried for further use.
30 wt%), and the dispersed homogeneous slurry was then drop-casted onto the GCE surface and vacuum-dried for further use.
4. Results and discussion
4.1 Structural analysis of the PANI PANI-MoS2 and CPANI-MoS2 nanosheets
The XRD measurement provides the crystalline/amorphous phase nature of the prepared sample, as shown in Fig. 1(a). The XRD spectra of the PANI observed a sharp characteristic peak position located at 25.76° and a small peak at 20.91° belonging to the crystal planes (200) and (020), respectively. These crystal planes are assigned to PANI.35 The CPANI-MoS2 composite exhibits distinct peaks at 14.53°, 33.87°, 39.9°, and 59.28° attributed to the (002), (101), (103), and (110) planes, representing the hexagonal structure of MoS2.36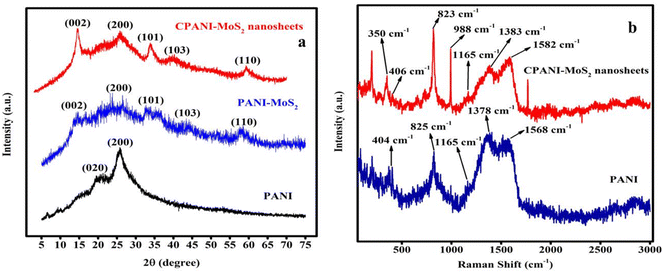 | ||
| Fig. 1 (a) The XRD spectra of PANI, PANI-MoS2 and CPANI-MoS2 nanosheets. (b) The Raman spectra of PANI and CPANI-MoS2 nanosheets. | ||
The intense peak at 25.83° is indexed to the (200) plane and is associated with PANI in the PANI-MoS2 nanosheets composite. The observed CPANI-MoS2 composite clearly exhibits semi-crystalline properties, and is well defined with both PANI and MoS2 resultant peaks that agree with the previously reported values.37 Furthermore, in the absence of CTAB, the PANI-MoS2 composite exhibits crystal planes that are comparable to those of an amorphous nature. However, there is a noticeable peak shift from 39.9° to 43.5° when compared to the CPANI-MoS2 nanosheets. The transition metal sulfide with a conducting polymer composite clearly shows a strong intercalation with the crystal plane between PANI and MoS2.
In Fig. 1(b), the Raman spectra show structural and chemical modification in PANI and the CPANI-MoS2 composite. PANI exhibits prominent characteristics peaks at 404 cm−1 and 825 cm−1, which are associated with the out-of-plane and stretching aromatic PANI chain, respectively. The bands at 1165 cm−1, 1378 cm−1, and 1568 cm−1 are related to the C–H in the benzene ring, the C–N+ charged imine structure, and the C![[double bond, length as m-dash]](https://www.rsc.org/images/entities/char_e001.gif) C polaronic structure in PANI, respectively.38,39 The PANI-MoS2 nanosheet composite exhibits bands at 275 cm−1, 350 cm−1, and 406 cm−1, which corresponds to the E1g, E12g, and A1g in MoS2, respectively.40 The frequency difference between E12g and A1g is about 56 cm−1, which confirms the existence of a 2H phase structure in MoS2.41 A sharp and intense new peak appeared at 988 cm−1, which is ascribed to the vibrational modes of PANI. The bands at 1378 cm−1 and 1568 cm−1 shifted to 1383 cm−1 and 1582 cm−1, respectively, in the CPANI-MoS2 composite due to surface defects of MoS2.42,43 The Raman spectra indicate that MoS2 is uniformly dispersed on the CPANI-MoS2 composite.
C polaronic structure in PANI, respectively.38,39 The PANI-MoS2 nanosheet composite exhibits bands at 275 cm−1, 350 cm−1, and 406 cm−1, which corresponds to the E1g, E12g, and A1g in MoS2, respectively.40 The frequency difference between E12g and A1g is about 56 cm−1, which confirms the existence of a 2H phase structure in MoS2.41 A sharp and intense new peak appeared at 988 cm−1, which is ascribed to the vibrational modes of PANI. The bands at 1378 cm−1 and 1568 cm−1 shifted to 1383 cm−1 and 1582 cm−1, respectively, in the CPANI-MoS2 composite due to surface defects of MoS2.42,43 The Raman spectra indicate that MoS2 is uniformly dispersed on the CPANI-MoS2 composite.
4.2 FTIR analysis of PANI, PANI-MoS2 and CPANI-MoS2 nanosheets
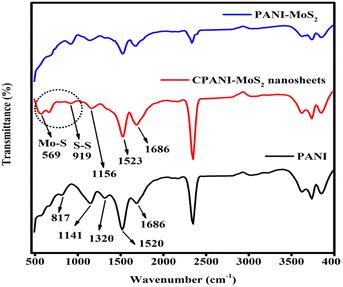
The PANI, PANI-MoS2 and CPANI-MoS2 composite, chemical interaction and elemental identification were analyzed by FTIR spectra, as shown in Fig. 2. The five prominent characteristic peaks of PANI are located at 813 cm−1 and 1141 cm−1, belonging to the C–H out-of-plane mode and aromatic ring, respectively. The 1320 cm−1 peak is related to C–N, and the peaks at 1520 cm−1 and 1686 cm−1 are assigned to C![[double bond, length as m-dash]](https://www.rsc.org/images/entities/char_e001.gif) C in the Q and B chains, respectively.44,45
C in the Q and B chains, respectively.44,45
The observed CPANI-MoS2 composite peaks at 662 cm−1 and 991 cm−1 represent the Mo–S and S–S elements, which reveal the strong interaction between thiourea and the Mo precursor at elevated temperature to form MoS2. The corresponding peaks at 1523 cm−1 and 1686 cm−1 are allocated to the C![[double bond, length as m-dash]](https://www.rsc.org/images/entities/char_e001.gif) C in quinonoid and benzenoid (Q & B units),46 respectively. The peak at 1156 cm−1 is ascribed to C–H in the aromatic ring. These results indicate the proper interaction of PANI and MoS2 during the hydrothermal synthesis, and agree well with previously published data.47 In addition, the PANI-MoS2 composite without CTAB shows the similar functional group. Nevertheless, the vibrational characteristics of the Mo–S group within the composite exhibits a reduction intensity, which can be attributed to the thermal effect induced by temperature variations, as compared to the presence of CTAB.
C in quinonoid and benzenoid (Q & B units),46 respectively. The peak at 1156 cm−1 is ascribed to C–H in the aromatic ring. These results indicate the proper interaction of PANI and MoS2 during the hydrothermal synthesis, and agree well with previously published data.47 In addition, the PANI-MoS2 composite without CTAB shows the similar functional group. Nevertheless, the vibrational characteristics of the Mo–S group within the composite exhibits a reduction intensity, which can be attributed to the thermal effect induced by temperature variations, as compared to the presence of CTAB.
4.3 SEM and EDAX analysis of PANI, PANI-MoS2 and the CPANI-MoS2 composite
The SEM images (Fig. 3(a and b)) of the PANI morphology show a fibrous structure with a branch-like connected network. The CPANI-MoS2 composite morphology structure (Fig. 3(c and d)) shows the flower-like nanosheets, and each nanosheet is interconnected between the layered edges with an average diameter of 41.59 nm. PANI strongly interacted with MoS2 in the composite. The cationic surfactant CTAB plays a vital role in the modification of the nanosheet surface morphology and reduces the size of the nanomaterial.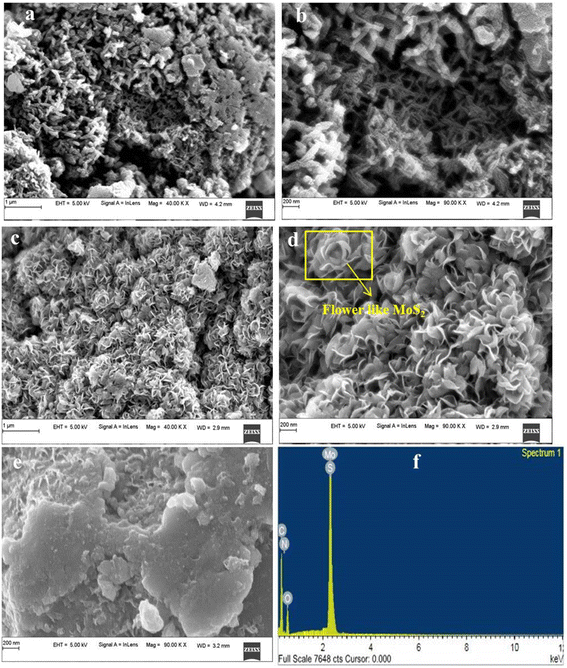 | ||
| Fig. 3 The SEM images of (a and b) PANI, (c and d) the CPANI-MoS2 composite, (e) the PANI-MoS2 composite without CTAB. (f) The EDAX spectra of the CPANI-MoS2 composite. | ||
In Fig. 3(e), the PANI-MoS2 composite shows the bulk nanosheets with PANI appearing on the surface of MoS2. This observation confirms the influence of the CTAB surfactant on the surface morphology. When comparing the PANI-MoS2 composite with CPANI-MoS2, it becomes evident that the bulk nanosheets comprised PANI.
The electrochemical properties significantly depend on the size and shape of the material. CTAB may control the size and shape of the electrode material, which has a remarkable influence on the electrocatalytic properties. The thin layered edges produce plenty of active sites and increase the conductivity, which facilitate the fast electron transport in the electrolyte. This could be helpful in optimizing the electrochemical detection analysis. Fig. 3(f) shows the EDAX spectra, which identified that the CPANI-MoS2 composite contained Mo, S, C, N, and O elements with their atomic percentages of 9.60%, 21.48%, 19.26%, 11.12%, and 38.53%, respectively.
4.4 HR-TEM image analysis of PANI, and CPANI-MoS2 composite
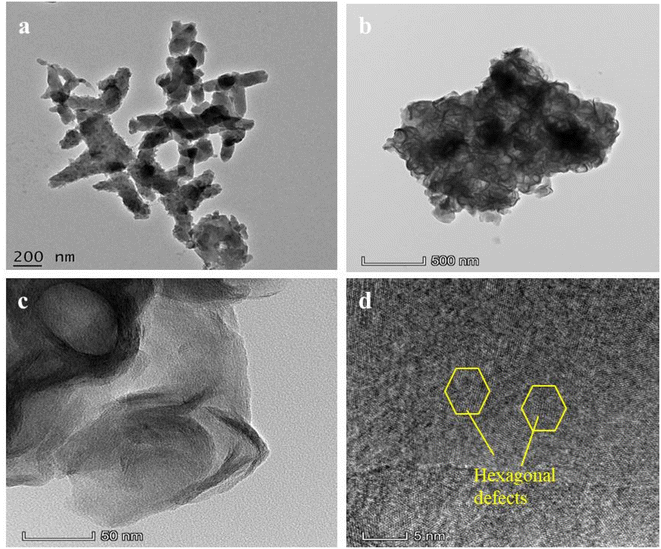
The TEM images of PANI (Fig. 4(a)) show the interconnected rod-like structure with an average diameter and reveal the uniformly dispersed rod shape, which is similar to the SEM image. The TEM images of the CPANI-MoS2 composite shows the curly nanosheet with few layers (Fig. 4(b and c)). The bright and dark regions indicate the PANI and MoS2, respectively. CTAB initiates and controls the surface morphology, and avoids the agglomeration in nanostructures. Furthermore, the pH value of the solution stabilizes the material structure and enhances the electrical conductivity, PANI intercalation with the MoS2. Finally, the nanosheet layer enlarges the interlayer distance space. Flower-like curly nanosheets can significantly absorb the target analyte molecule and exhibit superior catalytic activity.The HR-TEM image of the CPANI-MoS2 composite reveals that the hexagonal structure has a greater number of defects occurring on the surface (Fig. 4(d)). These defects could produce the active sites/edges, which is favourable for fast electron transferability, and it helps to detect a target analyte molecule easily.
4.5 STEM and elemental mapping analysis of the CPANI-MoS2 composite
Fig. S1(a)† shows the HR-STEM image. It can be observed that the CPANI-MoS2 composite transparent layered structure is similar to that shown in the TEM image. Fig. S1(b–e)† provides the elemental mapping and demonstrates the equal distribution of molybdenum (Mo), sulphur (S), carbon (C), and nitrogen (N). It confirms the presence of elements in the composite and the successful formation of the PANI-MoS2 nanosheets.5. Electrochemical sensing parameter analysis
Electrochemical analysis of the bare GCE, PANI, and CPANI-MoS2 GCE electrode was performed to investigate hydrazine detection in 0.1 M PBS (pH ∼7.0) electrolyte. The sensing parameters were evaluated via cyclic voltammetry (CV), difference pulse voltammetry (DPV) and electrochemical impedance (EIS) using a three-electrode configuration system.5.1 CV analysis of PANI, and CPANI-MoS2 GCE
The electrochemical behaviour of the bare GCE, PANI GCE, and CPANI-MoS2 GCE in 0.1 M PBS (pH ∼7.0) electrolyte is shown in Fig. 5(a). The observed CPANI-MoS2 GCE CV curve exhibits reversible behaviour, a wide surface area with higher current response than the PANI and bare GCE. This is due to MoS2 having multiple phases and various oxidation states, significantly enhancing the electrical conductivity in the nanocomposite. It may offer a high electroactive surface area and contribute to the good recognition ability for the target analyte species.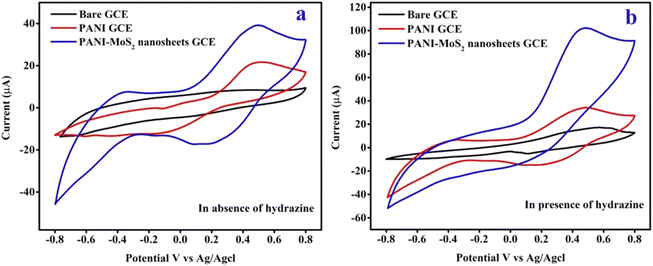 | ||
| Fig. 5 The CV curves of the (a) bare GCE, PANI GCE, and CPANI-MoS2 GCE in the absence of the hydrazine analyte. (b) The bare GCE, PANI, and CPANI-MoS2 GCE in the presence of the hydrazine analyte. | ||
The CV curve shows the bare GCE, PANI GCE, and CPANI-MoS2 GCE electrode in 0.1 M PBS electrolyte (pH 7.4) containing 100 μM hydrazine analyte (Fig. 5(b)). It is observed that the bare GCE exhibited very low oxidation activity of hydrazine. The PANI GCE electrode possesses an oxidation activity towards the hydrazine analyte, and shows oxidation and reduction peaks with a wider surface area than the bare GCE. The CV curve of CPANI-MoS2 GCE exhibits a huge surface area, demonstrating the well-distinguished oxidation peaks with high electrocatalytic oxidation response of the hydrazine analyte. It achieved the peak current and oxidation potential values at 0.47 V and 102.02 μA, compared to those of the bare GCE at 0.52 V and 16.92 μA and PANI GCE at 0.46 V and 33.85 μA, respectively. This value reveals that the synergetic effect between the conductive PANI and MoS2 functionality may be responsible for the electrocatalytic hydrazine response achieving a high current rate and superior oxidation potential. This is due to the nanosheets edge defects producing active sites, which easily facilitate the electrode surface adsorption phenomena and allow the passage way for the electron transfer, then the electrode easily detects the hydrazine analyte.
5.2 Effect of scan rate
The CV curve of CPANI-MoS2 GCE was examined in the presence of 100 μM hydrazine by varying the scan rate from 50 mV s−1 to 100 mV s−1 (Fig. S2(a)†). It is seen that with the increase in the scan rate, the oxidation peak current gradually increases towards the positive intensity current rate.The higher current window is attributed to the wide surface area due to the high electronic transfer ability of the MoS2 nanosheets. Furthermore, the CPANI-MoS2 GCE electrode may have a wide surface area that promotes a greater number of active sites and allows for the fast charge transfer to react with hydrazine. Fig. S2(b)† shows the observed calibration plot of the peak current against the scan rate, which indicates that the scan rate is directly proportional to the peak current. The obtained regression co-efficient value is ∼0.9994, and the slope of the calibration plot is found to be 1.0095. These results suggested that the CPANI-MoS2 GCE electrode obeys the electrochemical surface adsorption-controlled behaviour. The relationship between the peak current and the scan rate can be expressed as:
| IP (μA) = 1.0095C [μM] + 50.6934; (R2 = 0.9994) |
Fig. S2(c)† presents a log of the scan rate (ν) vs. peak current (IPa). The slope value found to be 0.5813, which suggests that the reaction is controlled by the surface adsorption process.
5.3 Effect of hydrazine concentration
Fig. S3(a)† depicts the electrochemical behaviour of the CPANI-MoS2 GCE electrode in various concentrations of hydrazine analyte with a measured scan rate at 50 mV s−1, with successive additions of hydrazine (100 μM to 400 μM) added in the 0.1 M PBS. The electrochemical oxidation reaction response current rate moderately increased in favour of the hydrazine analyte, and the shape of the CV curve maintained the same behaviour for different concentrations of the hydrazine analyte. The CPANI-MoS2 GCE electrode possessed a peak potential of 0.524 V and a peak current response of about 167.70 μA in the presence of 400 μM hydrazine analyte.Fig. S3(b)† shows the calibration plot, which is expressed as the different concentrations of hydrazine against the peak current. With the addition of greater concentrations of hydrazine, the oxidation peak gradually increased the current response. The regression value was found to be R2 = 0.9997, and the linear relationship is given by the following equation:
| IP hydrazine (μA) = 0.2192C [μM] + 79.962; (R2 = 0.9997) |
The CPANI-MoS2 GCE electrode demonstrated superior electrochemical oxidation activity of hydrazine. This is mainly due to the flower-like curly nanosheets that provide plenty of active sites and a huge surface area with high conductivity, which are beneficial for enhancing the electrochemical activity. The enhancement in the surface area and the number of active edge sites, which dominate the electrochemical oxidation activity, has been illustrated in previous studies.48,49
5.4 DPV analysis of PANI and CPANI-MoS2 GCE
Fig. 6(a) shows the DPV electrochemical detection curve for CPANI-MoS2 GCE. Firstly, hydrazine concentrations from 10 μM to 100 μM were incrementally added to the 0.1 M PBS electrolyte. The hydrazine analyte quickly detects and reacts with the electrode material, and enhances the oxidation current. The electrochemical oxidation activity can easily occur for the hydrazine target analyte molecule by surface absorption due to the MoS2 edge-rich curly nanosheets providing the huge surface area in the composite. Furthermore, the electrons are loosely arranged in a conjugated system of PANI.50 It may be possible to allow the electron flow in the electrolyte and charge carriers influence/facilitate the intrinsic conductivity in PANI, which helps to adsorb the target analyte species and significantly enhances the sensitivity, selectivity and provides the very low LOD.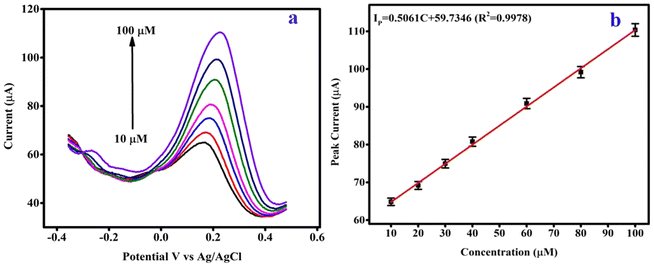 | ||
| Fig. 6 (a) The DPV analysis of the CPANI-MoS2 GCE, and (b) the linear calibration plot of peak current versus the concentration of hydrazine. | ||
Fig. 6(b) exhibits the CPANI-MoS2 GCE linear calibration plot for hydrazine detection. Different concentrations of hydrazine analyte were added to the 0.1 M PBS electrolyte, and the oxidation peak current simultaneously increased. The linear portion of the calibration plot of the peak current (IP) vs. concentration of hydrazine analyte can be expressed as follows:
| IP (μA) = 0.5061C [μM] + 59.7346; (R2 ∼ 0.997) |
The estimated hydrazine LOD was found to be 0.40 μM, and the linear range from 10 μM to 100 μM and CPANI-MoS2 GCE exhibited a sensitivity of 7.23 μA μM cm−2. Table 1 shows the electrochemical hydrazine detection comparison for previously reported various electrode materials.50–52
| Electrode materials | Methods | Determined linear range (μM) | Sensitivity (μA μM cm−2) | Estimated LOD (μM) | References |
|---|---|---|---|---|---|
| MoS2/Au/CM PGE | DPV | 20–1200 | 0.051 | 0.018 | 31 |
| PANI/SrTiO3 | LSV | 200–3560 | 0.2128 | 1.09 | 32 |
| PdNPs/EDAC/GCE | DPV | 5–150 | 0.0218 | 1.5 | 51 |
| NGPVP/AuNPs/SPCE | SWV | 2–300 | 1.370 | 0.07 | 52 |
| EFTA/IL/CoS2-CNT/CPE | DPV | 0.03–500 | 0.073 | 0.015 | 53 |
| rGO/MoS2 | CV | — | 89.89 | 132 | 54 |
| MoS2/OMC | Amperometric | 1–9 | 0.25 | 0.4 | 55 |
| MoS2/WO3 | DPV | — | 0.132 | 0.17 | 56 |
| CPANI-MoS2 GCE | DPV | 10–100 | 7.23 | 0.40 | This work |
The CTAB-assisted CPANI-MoS2 composites are an excellent candidate for electrochemical sensor detection of hydrazine analytes due to the flexibility of their surface morphology structure. Furthermore, they provide a greater number of oxygen functionalities to easily optimize the oxidizability of the analyte molecules and exhibit better sensitivity.
5.5 EIS analysis of bare GCE, PANI and CPANI-MoS2 GCE
In Fig. 7, the EIS technique was used to determine the interfacial and electronic charge properties of the bare GCE, PANI GCE, and CPANI-MoS2 GCE in 0.1 M PBS containing 100 μM hydrazine analyte. The electrode material interface between the electrolyte and hydrazine analyte interacts with the electrode material. The EIS curve shows the ideal semicircle arc. CPANI-MoS2 GCE possesses an ideal semicircle arc, and the diameter ascribed to the low charge transfer resistance (Rct) is found to be 745 Ω. Meanwhile, the PANI GCE shows the Rct of 1996 Ω, and bare GCE exhibits the Rct of 2685 Ω. This is mainly due to the high conductivity and surface adsorption behaviour that is easily established in the CPANI-MoS2 nanosheets GCE. This reveals the adequate combination of the conducting polymer PANI with the metal sulfide MoS2 for electrochemical hydrazine detection.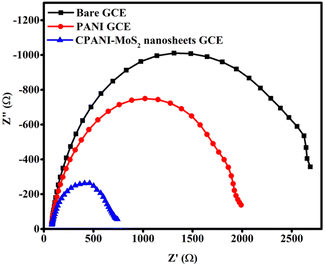 | ||
| Fig. 7 The EIS spectra of the bare GCE, PANI, and CPANI-MoS2 GCE in 0.1 M PBS electrolyte in the presence of 100 μM hydrazine. | ||
5.6 Storage stability of the CPANI-MoS2 GCE
The fabricated CPANI-MoS2 GCE electrode storage stability was tested using the CV technique in terms of the freshly prepared electrode oxidation peak current found to be 152.42 μA (Fig. 8(a)). After storing the electrode at 4 °C for one and two weeks, there was no change in the shape of the CV curve. In Fig. 8(b), the oxidation peak current response of the CPANI-MoS2 GCE sensor electrode was found to be 128.04 μA and 107.13 μA with a retained storage stability of about 84% and 70.47%, respectively, which reveals that the proposed sensor electrode showed fast detection. Furthermore, the storage stability features are favourable for use of the electrochemical sensor as a diagnostics and clinical and environmental contamination detection application.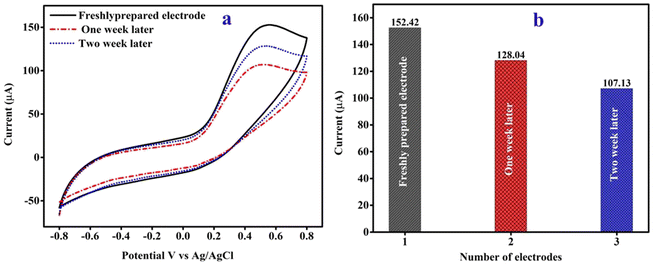 | ||
| Fig. 8 (a) The CV curve demonstrates the storage stability of the CPANI-MoS2 GCE, and (b) the peak current histogram plot. | ||
5.7 Repeatability of CPANI-MoS2 GCE
The repeatability of the CPANI-MoS2 GCE was investigated in the presence of a 100 μM hydrazine analyte, and measured three times with the scan rate at 100 mV s−1. The observed CV curve shows negligible changes in the current rate, as shown in Fig. 9(a). Fig. 9(b) shows the histogram plot of the oxidation peak current, and the relative standard deviation (RSD) was found to be 1.11%, which indicates that the sensor electrode showed excellent repeatability.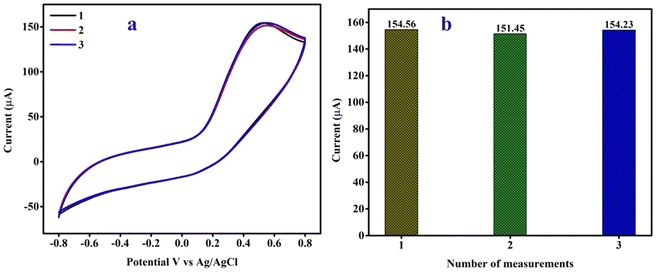 | ||
| Fig. 9 (a) The repeatability of the CPANI-MoS2 GCE electrode and (b) the peak current histogram plot. | ||
5.8 Selectivity analysis of the PANI-MoS2 nanosheets GCE
To further validate the CPANI-MoS2 GCE sensor, the selectivity was determined using various potential interferences co-existing with hydrazine in the environment, such as AA, CA, Glucose, KCl, NaNo3, and NH4. Each interfering substance was added at a concentration that was 10-fold higher than that of hydrazine, as shown in Fig. 10.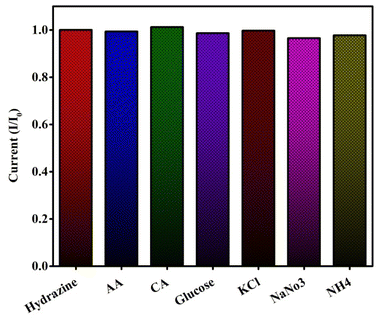 | ||
| Fig. 10 The selectivity study of the CPANI-MoS2 GCE for hydrazine measured in the presence of various interference substances. | ||
The peak current intensity was estimated by the absence of interferences (I0) and presence of interferences (I). The results indicate that the addition of interferences has a negligible effect on the hydrazine. Furthermore, the relative standard deviation (RSD) is less than 2%, which is an acceptable value. The fabricated CPANI-MoS2 GCE sensor has good selectivity for the detection of hydrazine.
5.9 Real sample analysis of CPANI-MoS2 GCE
To investigate the CPANI-MoS2 GCE sensor electrode in practical application, the DPV technique was adopted in the determination of hydrazine substances in tap water samples using a standard addition method. Different concentrations of hydrazine substances were spiked into the tap water sample. The measurement was repeated three times, and the experimental results are summarized in Table 2. The recovery of the spiked hydrazine analyte substances in tap water was found to be 100.31% and 103.73% with good acceptable RSD values of 0.85% to 3.64%, respectively.| Samples | Concentration of hydrazine | Recovery (%) | RSD (%) (S/N = 3) | |
|---|---|---|---|---|
| Spiked (μM) | Founded (μM) | |||
| Tap water | 10 | 10.37 | 100.31 | 0.85 |
| 30 | 30.09 | 103.73 | 3.64 | |
These results suggest that the proposed CPANI-MoS2 GCE sensor electrode is an ideal candidate for the practical determination of hydrazine in pharmaceutical and environmental samples.
6. Effect of CTAB on the structural morphology and electrochemical properties
The effectiveness of the MoS2-based polymer composite relies on several factors, including the even dispersion of MoS2 within the matrix, compatibility with the host material and their interfacial interaction. Additionally, preventing agglomeration of the MoS2 nanosheets within the host matrix is crucial.57 Zhang H. et al. reported on the impact of CTAB on the surface morphology and electrochemical properties.58 Thus, we have added the CTAB surfactant for the composite material. The CTAB is initiated as a template, and it changes the surface of the nanostructures. CPANI-MoS2 then establishes the sharp-edged nanosheets. This is mainly due to the effect of CTAB, which offers the defect sites, a huge surface area, and high electrical conductivity. These features are also beneficial for enhancing the electrochemical detection accuracy, sensitivity, repeatability, storage stability, and LOD.Conclusions
In this present work, the CPANI-MoS2 composite was successfully synthesized via in situ polymerization and hydrothermal method in the presence of CTAB. Structural characterization of the CPANI-MoS2 composite reveals the presence of C![[double bond, length as m-dash]](https://www.rsc.org/images/entities/char_e001.gif) C in Q and B rings with Mo–S elements. The XRD analysis shows a sharp peak at 14.53°, indexed with a crystal plane of (002), indicating the formation of a hexagonal structure in the composite material. The presence of nanosheet morphology is confirmed through SEM and TEM. The fabricated CPANI-MoS2 GCE manifests the electrochemical sensing parameters via CV, DPV, and EIS. The CV curve possesses a large electroactive surface area, a high current rate, and good repeatability. The DPV analysis of the hydrazine analyte detection shows a low LOD of 0.40 μM, wide linearity of 10 μM to 100 μM, and a determined sensitivity of 7.23 μA μM cm−2. Moreover, the practical applicability of the CPANI-MoS2 composite GCE electrode is confirmed through real sample measurements, with the recovery percentage ranging from 100.31 to 103.73%. These results confirm its potential for practical use in pharmaceutical and environmental applications.
C in Q and B rings with Mo–S elements. The XRD analysis shows a sharp peak at 14.53°, indexed with a crystal plane of (002), indicating the formation of a hexagonal structure in the composite material. The presence of nanosheet morphology is confirmed through SEM and TEM. The fabricated CPANI-MoS2 GCE manifests the electrochemical sensing parameters via CV, DPV, and EIS. The CV curve possesses a large electroactive surface area, a high current rate, and good repeatability. The DPV analysis of the hydrazine analyte detection shows a low LOD of 0.40 μM, wide linearity of 10 μM to 100 μM, and a determined sensitivity of 7.23 μA μM cm−2. Moreover, the practical applicability of the CPANI-MoS2 composite GCE electrode is confirmed through real sample measurements, with the recovery percentage ranging from 100.31 to 103.73%. These results confirm its potential for practical use in pharmaceutical and environmental applications.
Conflicts of interest
There are no conflicts of interest.Acknowledgements
The author acknowledges the Mangalore University for granting a research fellowship, and is thankful to the PURSE Lab Mangalore University for providing FESEM. The author is also grateful to the IISc CeNSE INUP characterization facility.References
- S. Yuan, X. Bo and L. Guo, In situ growth of iron-based metal-organic framework crystal on ordered mesoporous carbon for efficient electrocatalysis of p-nitrotoluene and hydrazine, Anal. Chim. Acta, 2018, 1024, 73–83 CrossRef CAS PubMed.
- X. Luo, J. Pan, K. Pan, Y. Yu, A. Zhong, S. Wei and X. Li, An electrochemical sensor for hydrazine and nitrite based on graphene–cobalt hexacyanoferrate nanocomposite: toward environment and food detection, J. Electroanal. Chem., 2015, 745, 80–87 CrossRef CAS.
- Y. Dong, Z. Yang, Q. Sheng and J. Zheng, Solvothermal synthesis of Ag@ Fe3O4 nanosphere and its application as hydrazine sensor, Colloids Surf., A, 2018, 538, 371–377 CrossRef CAS.
- X. Gu, X. Li, S. Wu, J. Shi, G. Jiang, G. Jiang and S. Tian, A sensitive hydrazine hydrate sensor based on a mercaptomethyl-terminated trinuclear Ni (II) complex modified gold electrode, RSC Adv., 2016, 6, 8070–8078 RSC.
- Y. Zhang and J. Ye, Electrochemical sensor based on palladium loaded laser scribed graphitic carbon nanosheets for ultrasensitive detection of hydrazine, New J. Chem., 2018, 42, 13744–13753 RSC.
- R. Ramachandran, T. W. Chen, S. M. Chen, T. Baskar, R. Kannan, P. Elumalai and K. Dinakaran, A review of the advanced developments of electrochemical sensors for the detection of toxic and bioactive molecules, Inorg. Chem. Front., 2019, 6, 3418–3439 RSC.
- V. Sudha, S. M. S. Kumar and R. Thangamuthu, NiCo2O4 nanorod: synthesis and electrochemical sensing of carcinogenic hydrazine, Inorg. Chem. Commun., 2020, 116, 107927 CrossRef CAS.
- M. Sookhakian, W. J. Basirun, B. T. Goh, P. M. Woi and Y. Alias, Molybdenum disulfide nanosheet decorated with silver nanoparticles for selective detection of dopamine, Colloids Surf., B, 2019, 176, 80–86 CrossRef CAS PubMed.
- D. Zhu, W. Liu, D. Zhao, Q. Hao, J. Li, J. Huang and L. Wang, Label-free electrochemical sensing platform for microRNA-21 detection using thionine and gold nanoparticles co-functionalized MoS2 nanosheet, ACS Appl. Mater. Interfaces, 2017, 9, 35597–35603 CrossRef CAS PubMed.
- M. M. Shahid, P. Rameshkumar, W. J. Basirunc, U. Wijayantha, W. S. Chiu, P. S. Khiew and N. M. Huang, An electrochemical sensing platform of cobalt oxide@ gold nanocubes interleaved reduced graphene oxide for the selective determination of hydrazine, Electrochim. Acta, 2018, 259, 606–616 CrossRef CAS.
- Z. Lu, Y. Li, T. Liu, G. Wang, M. Sun, Y. Jiang and H. Rao, A dual-template imprinted polymer electrochemical sensor based on AuNPs and nitrogen-doped graphene oxide quantum dots coated on NiS2/biomass carbon for simultaneous determination of dopamine and chlorpromazine, Chem. Eng. J., 2020, 389, 124417 CrossRef CAS.
- S. Hu, Y. Yu, Y. Guan, Y. Li, B. Wang and M. Zhu, Two-dimensional TiO2(001) nanosheets as an effective photo-assisted recyclable sensor for the electrochemical detection of bisphenol A, Chin. Chem. Lett., 2020, 31, 2839–2842 CrossRef CAS.
- J. S. Wang, R. Sakthivel, R. Anbazhagan, S. Kubendhiran, J. Y. Lai, H. C. Tsai and S. M. Chen, Electroactive polypyrrole-molybdenum disulfide nanocomposite for ultrasensitive detection of berberine in rat plasma, Anal. Chim. Acta, 2020, 1125, 210–219 CrossRef CAS PubMed.
- Y. H. Wang, K. J. Huang and X. Wu, Recent advances in transition-metal dichalcogenides based electrochemical biosensors: a review, Biosens. Bioelectron., 2017, 97, 305–316 CrossRef CAS PubMed.
- S. Barua, H. S. Dutta, S. Gogoi, R. Devi and R. Khan, Nanostructured MoS2-based advanced biosensors: a review, ACS Appl. Nano Mater., 2017, 1(1), 2–25 CrossRef.
- M. T. Rahman, R. Kumar, M. Kumar and Q. Qiao, Two-dimensional transition metal dichalcogenides and their composites for lab-based sensing applications: Recent progress and future outlook, Sens. Actuators, A, 2020, 112517 Search PubMed.
- S. Ramaraj, M. Sakthivel, S. M. Chen, M. S. Elshikh, T. W. Chen, M. C. Yu and K. C. Ho, Electrochemical sensing of anti-inflammatory agent in paramedical sample based on FeMoSe2 modified SPCE: comparison of various preparation methods and morphological effects, Anal. Chim. Acta, 2019, 1083, 88–100 CrossRef CAS PubMed.
- M. A. Dwiputra, F. Fadhila, C. Imawan and V. Fauzia, The enhanced performance of capacitive-type humidity sensors based on ZnO nanorods/WS2 nanosheets heterostructure, Sens. Actuators, B, 2020, 310, 127810 CrossRef CAS.
- A. Yin, X. Wei, Y. Cao and H. Li, High-quality molybdenum disulfide nanosheets with 3D structure for electrochemical sensing, Appl. Surf. Sci., 2016, 385, 63–71 CrossRef CAS.
- S. Su, X. Han, Z. Lu, W. Liu, D. Zhu, J. Chao and L. Wang, Facile synthesis of a MoS2–Prussian blue nanocube nanohybrid-based electrochemical sensing platform for hydrogen peroxide and carcinoembryonic antigen detection, ACS Appl. Mater. Interfaces, 2017, 9(14), 12773–12781 CrossRef CAS PubMed.
- J. Shang, M. Zhao, H. Qu, H. Li and S. Chen, Fabrication of CQDs/MoS2/Mo foil for the improved electrochemical detection, Anal. Chim. Acta, 2019, 1079, 79–85 CrossRef CAS PubMed.
- R. Sha, N. Vishnu and S. Badhulika, MoS2 based ultra-low-cost, flexible, non-enzymatic and non-invasive electrochemical sensor for highly selective detection of uric acid in human urine samples, Sens. Actuators, B, 2019, 279, 53–60 CrossRef CAS.
- N. Asefifeyzabadi, R. Alkhaldi, A. Z. Qamar, A. A. Pater, M. Patwardhan, K. T. Gagnon and M. H. Shamsi, Label-free Electrochemical Detection of CGG Repeats on Inkjet Printable 2D Layers of MoS2, ACS Appl. Mater. Interfaces, 2020, 12(46), 52156–52165 CrossRef CAS PubMed.
- L. G. Bach, D. M. Nguyen, Q. B. Bui, P. H. Ai-Le and H. T. Nhac-Vu, Hierarchical molybdenum dichalcogenide nanosheets assembled nitrogen doped graphene layers for sensitive electrochemical dopamine detection, Mater. Chem. Phys., 2019, 236, 121814 CrossRef CAS.
- M. D. Petit-Domínguez, C. Quintana, L. Vázquez, M. Del Pozo, I. Cuadrado, A. M. Parra-Alfambra and E. Casero, Synergistic effect of MoS2 and diamond nanoparticles in electrochemical sensors: determination of the anticonvulsant drug valproic acid, Microchim. Acta, 2018, 185(7), 1–10 CrossRef PubMed.
- X. Guo, H. Yue, S. Song, S. Huang, X. Gao, H. Chen and Z. Wang, Simultaneous electrochemical determination of dopamine and uric acid based on MoS2 nanoflowers-graphene/ITO electrode, Microchem. J., 2020, 154, 104527 CrossRef CAS.
- M. Sadeghi, M. Jahanshahi and H. Javadian, Highly sensitive biosensor for detection of DNA nucleobases: enhanced electrochemical sensing based on polyaniline/single-layer MoS2 nanosheets nanocomposite modified carbon paste electrode, Microchem. J., 2020, 152, 104315 CrossRef CAS.
- C. Zhang, S. Govindaraju, K. Giribabu, Y. S. Huh and K. Yun, AgNWs-PANI nanocomposite based electrochemical sensor for detection of 4-nitrophenol, Sens. Actuators, B, 2017, 252, 616–623 CrossRef CAS.
- H. Wang, P. H. Yang, H. H. Cai and J. Cai, Constructions of polyaniline nanofiber-based electrochemical sensor for specific detection of nitrite and sensitive monitoring of ascorbic acid scavenging nitrite, Synth. Met., 2012, 162(3–4), 326–331 CrossRef CAS.
- J. Yukird, O. Chailapakul and N. Rodthongkum, Label-free anti-Müllerian hormone sensor based on polyaniline micellar modified electrode, Talanta, 2021, 222, 121561 CrossRef CAS PubMed.
- A. Mejri, A. Mars, H. Elfil and A. H. Hamzaoui, Curcumin graphite pencil electrode modified with molybdenum disulfide nanosheets decorated gold foams for simultaneous quantification of nitrite and hydrazine in water samples, Anal. Chim. Acta, 2020, 1137, 19–27 CrossRef CAS PubMed.
- M. Faisal, M. A. Rashed, M. M. Abdullah, F. A. Harraz, M. Jalalah and M. S. Al-Assiri, Efficient hydrazine electrochemical sensor based on PANI doped mesoporous SrTiO3 nanocomposite modified glassy carbon electrode, J. Electroanal. Chem., 2020, 879, 114805 CrossRef CAS.
- M. Afshari, M. Dinari and M. M. Momeni, The graphitic carbon nitride/polyaniline/silver nanocomposites as a potential electrocatalyst for hydrazine detection, J. Electroanal. Chem., 2019, 833, 9–16 CrossRef CAS.
- A. M. Villa Manso, M. Revenga Parra, M. Vera Hidalgo, M. V. Sulleiro, E. M. Perez, E. Lorenzo and F. Pariente, 2D MoS2 nanosheets and hematein complexes deposited on screen-printed graphene electrodes as an efficient electrocatalytic sensor for detecting hydrazine, Sens. Actuators, B, 2021, 345, 130385 CrossRef CAS.
- L. Ren, G. Zhang, Z. Yan, L. Kang, H. Xu, F. Shi and Z. H. Liu, Three-dimensional tubular MoS2/PANI hybrid electrode for high rate performance supercapacitor, ACS Appl. Mater. Interfaces, 2015, 7(51), 28294–28302 CrossRef CAS PubMed.
- K. J. Huang, J. Z. Zhang, G. W. Shi and Y. M. Liu, Hydrothermal synthesis of molybdenum disulfide nanosheets as supercapacitors electrode material, Electrochim. Acta, 2014, 132, 397–403 CrossRef CAS.
- J. Chao, L. Yang, J. Liu, R. Hu and M. Zhu, Sandwiched MoS2/polyaniline nanosheets array vertically aligned on reduced graphene oxide for high performance supercapacitors, Electrochim. Acta, 2018, 270, 387–394 CrossRef CAS.
- Y. Zhang, J. Liu, Y. Zhang, J. Liu and Y. Duan, Facile synthesis of hierarchical nanocomposites of aligned polyaniline nanorods on reduced graphene oxide nanosheets for microwave absorbing materials, RSC Adv., 2017, 7(85), 54031–54038 RSC.
- S. Xiong, X. Zhang, R. Wang, Y. Lu, H. Li, J. Liu and Z. Chen, Preparation of covalently bonded polyaniline nanofibers/carbon nanotubes supercapacitor electrode materials using interfacial polymerization approach, J. Polym. Res., 2019, 26(4), 1–8 CrossRef CAS.
- M. Kim, Y. K. Kim, J. Kim, S. Cho, G. Lee and J. Jang, Fabrication of a polyaniline/MoS2 nanocomposite using self-stabilized dispersion polymerization for supercapacitors with high energy density, RSC Adv., 2016, 6(33), 27460–27465 RSC.
- D. Zhang, Z. Zhang, X. Xu, Q. Zhang and C. Yuan, Flexible MoS2 nanosheets/polypyrrole nanofibers for highly efficient electrochemical hydrogen evolution, Phys. Lett. A, 2017, 381(41), 3584–3588 CrossRef CAS.
- X. Li, C. Zhang, S. Xin, Z. Yang, Y. Li, D. Zhang and P. Yao, Facile synthesis of MoS2/reduced graphene oxide@ polyaniline for high-performance supercapacitors, ACS Appl. Mater. Interfaces, 2016, 8(33), 21373–21380 CrossRef CAS PubMed.
- L. Yu, Q. Wang, H. Yang, Q. Zhang and Z. Luo, Facile synthesis and enhanced electrochemical properties of reduced graphene oxide/MoS2/polyaniline ternary composites, Dalton Trans., 2017, 46(30), 9868–9874 RSC.
- X. Zhang, L. Ma, M. Gan, G. Fu, M. Jin and Y. Zhai, Controllable constructing of hollow MoS2/PANI core/shell microsphere for energy storage, Appl. Surf. Sci., 2018, 460, 48–57 CrossRef CAS.
- J. Han, L. Li, P. Fang and R. Guo, Ultrathin MnO2 nanorods on conducting polymer nanofibers as a new class of hierarchical nanostructures for high-performance supercapacitors, J. Phys. Chem. C, 2012, 116(30), 15900–15907 CrossRef CAS.
- J. Chao, L. Yang, J. Liu, R. Hu and M. Zhu, Sandwiched MoS2/polyaniline nanosheets array vertically aligned on reduced graphene oxide for high performance supercapacitors, Electrochim. Acta, 2018, 270, 387–394 CrossRef CAS.
- A. Soni, C. M. Pandey, M. K. Pandey and G. Sumana, Highly efficient Polyaniline-MoS2 hybrid nanostructures based biosensor for cancer biomarker detection, Anal. Chim. Acta, 2019, 1055, 26–35 CrossRef CAS PubMed.
- J. Song, L. Xu, R. Xing, Q. Li, C. Zhou, D. Liu and H. Song, Synthesis of Au/graphene oxide composites for selective and sensitive electrochemical detection of ascorbic acid, Sci. Rep., 2014, 4, 1–7 Search PubMed.
- S. M. Oliveira, J. M. Luzardo, L. A. Silva, D. C. Aguiar, C. A. Senna, R. Verdan and J. R. Araujo, High-performance electrochemical sensor based on molecularly imprinted polypyrrole-graphene modified glassy carbon electrode, Thin Solid Films, 2020, 699, 137875 CrossRef CAS.
- S. Shrivastava, N. Jadon and R. Jain, Next-generation polymer nanocomposite-based electrochemical sensors and biosensors: a review, TrAC, Trends Anal. Chem., 2016, 82, 55–67 CrossRef CAS.
- H. Ahmar, S. Keshipour, H. Hosseini, A. R. Fakhari, A. Shaabani and A. Bagheri, Electrocatalytic oxidation of hydrazine at glassy carbon electrode modified with ethylenediamine cellulose immobilized palladium nanoparticles, J. Electroanal. Chem., 2013, 690, 96–103 CrossRef CAS.
- C. Saengsookwaow, R. Rangkupan, O. Chailapakul and N. Rodthongkum, Nitrogen-doped graphene–polyvinylpyrrolidone/gold nanoparticles modified electrode as a novel hydrazine sensor, Sens. Actuators, B, 2016, 227, 524–532 CrossRef CAS.
- S. Tajik, H. Beitollahi, R. Hosseinzadeh, A. Aghaei Afshar, R. S. Varma, H. W. Jang and M. Shokouhimehr, Electrochemical Detection of Hydrazine by Carbon Paste Electrode Modified with Ferrocene Derivatives, Ionic Liquid, and CoS2-Carbon Nanotube Nanocomposite, ACS Omega, 2021, 6(7), 4641–4648 CrossRef CAS PubMed.
- D. S. Rana, S. Kalia, N. Thakur, R. K. Singh, R. Kumar and D. Singh, Synthesis of reduced graphene oxide-molybdenum disulfide nanocomposite as potential scaffold for fabrication of efficient hydrazine sensor, Mater. Chem. Phys., 2023, 294, 127048 CrossRef CAS.
- S. Mutyala, C. Suresh and J. Mathiyarasu, Ordered mesoporous carbon provoked dimensionally varied molybdenum dichalcogenide: a striking sensing matrix for electrochemical detection of hydrazine, SN Appl. Sci., 2020, 2, 1–10 Search PubMed.
- K. Ahmad and H. Kim, Synthesis of MoS2/WO3 hybrid composite for hydrazine sensing applications, Mater. Sci. Semicond. Process., 2022, 148, 106803 CrossRef CAS.
- S. Chhetri, N. C. Adak, P. Samanta, N. Mandal, T. Kuila and N. C. Murmu, Investigation of mechanical and thermal properties of the cetyltrimethylammonium bromide functionalized molybdenum disulfide (MoS2)/epoxy composites, Polym. Bull., 2018, 75, 327–343 CrossRef CAS.
- H. Zhang, L. Cong, J. Wang, X. Wang, G. Liu, W. Yu and W. Fan, Impact of CTAB on morphology and electrochemical performance of MoS2 nanoflowers with improved lithium storage properties, J. Mater. Sci.: Mater. Electron., 2018, 29, 3631–3639 CrossRef CAS.
Footnote |
| † Electronic supplementary information (ESI) available. See DOI: https://doi.org/10.1039/d3ra06003a |
| This journal is © The Royal Society of Chemistry 2023 |

