DOI:
10.1039/D3RA06296A
(Paper)
RSC Adv., 2023,
13, 34122-34135
Green structure orienting and reducing agents of wheat peel extract induced abundant surface oxygen vacancies and transformed the nanoflake morphology of NiO into a plate-like shape with enhanced non-enzymatic urea sensing application
Received
15th September 2023
, Accepted 5th November 2023
First published on 21st November 2023
Abstract
Researchers are increasingly focusing on using biomass waste for green synthesis of nanostructured materials since green reducing, capping, stabilizing and orientation agents play a significant role in final application. Wheat peel extract contains a rich source of reducing and structure orienting agents that are not utilized for morphological transformation of NiO nanostructures. Our study focuses on the role of wheat peel extract in morphological transformation during the synthesis of NiO nanostructures as well as in non-enzymatic electrochemical urea sensing. It was observed that the morphological transformation of NiO flakes into nanoplatelets took place in the presence of wheat peel extract during the preparation of NiO nanostructures and that both the lateral size and thickness of the nanostructures were significantly reduced. Wheat peel extract was also found to reduce the optical band gap of NiO. A NiO nanostructure prepared with 5 mL of wheat peel extract (sample 2) was highly efficient for the detection of urea without the use of urease enzyme. It has been demonstrated that the induced modification of NiO nanoplatelets through the use of structure-orienting agents in the wheat peel has enhanced their electrochemical performance. A linear range of 0.1 mM to 13 mM was achieved with a detection limit of 0.003 mM in the proposed urea sensor. The performance of the presented non-enzymatic urea sensor was evaluated in terms of selectivity, stability, reproducibility, and practical application, and the results were highly satisfactory. As a result of the high surface active sites on sample 2, the low charge transfer resistance, as well as the high exposure to the surface active sites of wheat peel extract, sample 2 demonstrated enhanced performance. The wheat peel extract could be used for the green synthesis of a wide range of nanostructured materials, particularly metal/metal oxides for various electrochemical applications.
1. Introduction
Over the last two decades, nanostructured materials have been extensively studied for applications in a wide range of fields, including catalysis,1 optics,2 electronics,3 medical imaging,4 medicine,5 and biotechnology.6 Many fabrication methods have been developed for nanostructured materials that eliminate or minimize the use of toxic chemical reagents by using biological materials, such as bacteria,7 fungi,8 plants,9 and yeasts.10,11 Among the nanostructures prepared from living microorganisms, those from plants have the advantage of rapid growth, high stability, and high dispersion in aqueous solutions,12,13 as well as diverse morphologies and dimensions.14 Among the metal oxides, nickel oxide (NiO) is highly investigated due to its unique functional properties.15,16 Various conventional methods have been used to prepare NiO nanostructures, including hydrothermal,17 solvothermal,18 precipitation,19 electrodeposition,20 and sol–gel.21 In addition to these conventional preparation techniques, green mediated synthesis of NiO nanostructures provides a simple, low-cost, scalable, and high performance synthesis method due to the availability of a wide range of green reducing, capping, and stabilizing agents in plant extracts.22,23 NiO nanostructures have been synthesized using different plant extracts, including Moringa oleifera24 and Hydrangea paniculata flower extracts.25 As of now, research on the green mediated synthesis of NiO nanostructures is limited, and there is much room for further investigation in relation to green synthesis and diverse applications. As a result of the green preparation of NiO nanostructures, the electrodes for the development of supercapacitors have been modified to have excellent capacitance and cycling stability.26–28 Furthermore, urea is one of the most widely used nitrogen sources in agriculture and industry.29 Different products containing urea include soaps, cleaning agents, feed for animals, and detergents.30 It is well known that urea can adversely affect the environment and life on land when it is sprayed and fertilized on crops. Proteins undergo metabolism and produce urea within the body.31 Urea concentrations in human body fluids range from 2.6 to 6.5 mM.32,33 In the human body, urea is primarily excreted through urine.34 Due to the fact that urea is also found to be one of the main components of adulterants in milk, it is necessary to use a highly sensitive and selective method for quantifying urea. Statistics show milk contains urea between 3.2 and 6.6 mM. In contrast, the Indian safety food authorities define milk urea content at 11.6 mM.35 Furthermore, urea is being used to increase the nitrogen content of milk.36,37 A high concentration of urea in human body fluids can result in kidney dysfunction, urinary tract obstructions and cachexia, while a low concentration of urea can cause renal failure, liver dysfunction, and cachexia.38 Thus, it is essential to monitor the urea levels in a variety of samples, such as human fluids, agriculture, the environment, pharmaceuticals, and foods.39 This is the reason why a wide range of analytical techniques are available for determining urea, including near infrared spectrophotometers,40 chromatography,41 nuclear magnetic resonance,42 flow injection analysis,43 and electroanalytical methods.44–47 In terms of sensitivity, rapidity, selectivity, ease of use, and low limit of detection, electroanalytical methods have been found to be more effective than other methods.48 Urea has been quantified by both enzymatic and non-enzymatic electrochemical methods.49,50 In contrast to the enzymatic method, which is highly expensive, complicated during enzyme immobilization on transducers, and has storage stability problems, the non-enzymatic method is low-cost, simple, and does not have storage stability concerns.51 Wheat peel extract has not yet been exploited as a source of green reducing agents in order to synthesize nanostructured materials for electrochemical applications. It is due to the high availability of reducing agents and growth orienting reagents in wheat peel extract that such biomass waste materials are less likely to be studied for the transformation of NiO flake nanostructures into plates. Through the use of green reducing agents and structure orienting agents, NiO has been tuned to exhibit highly sensitive and selective non-enzymatic urea sensors. Additionally considering the high abundance, natural reducing agents, low cost, environment friendly and facile aspects of wheat peel extract, it offers its high potential for the synthesis of high performance materials especially metal/metal oxides for specific application.
2. Experimental section
2.1. Chemical reagents
Different chemical compounds were purchased from Sigma Aldrich, Karachi, and Sindh Pakistan. These compounds include nickel chloride hexahydrate, urea, ethanol, sodium hydroxide, glucose, alumina paste, uric acid, potassium chloride, and sodium chloride. Deionized water was used to prepare solutions for wheat peel extraction, growth of NiO nanostructures, and urea sensing applications.
2.2. Synthesis of NiO nanostructures using wheat peel extract by hydrothermal process
In preparation for growth, 100 g of wheat peel powder were chipped into powder and added to 250 mL of deionized water. We then heated the solution at 80 °C for 2 hours, followed by filtration, in order to obtain wheat peel extract. Afterwards, the wheat peel extract was stored at 4 °C in the refrigerator and was used as needed. An aqueous growth solution was prepared using 0.1 M NiCl2·6H2O and 10 mL of 33% aqueous ammonia solution for the pure NiO sample. While, the growth solution of NiO was prepared using the mixture of 0.1 M NiCl2·6H2O, 10 mL of 33% aqueous ammonia, 3 mL, 5 mL, and 7 mL of wheat peel extract, respectively. An aluminum sheet was tightly covered over the growth solutions, followed by a hydrothermal treatment at 95 °C for five hours in an electric oven. Upon completion of the growth process, the product was collected on filter paper and dried overnight. It was then combusted in an electric furnace at 400 °C for four hours with the synthesized hydroxide product. As a result, NiO's dark grey product has been received successfully. The NiO prepared with 3 mL, 5 mL and 7 mL of wheat peel extract was labeled as sample 1, sample 2 and sample 3, respectively. The shape aspects of as prepared NiO nanostructures were studied by FEI MagellanTM, high resolution scanning electron microscopes (HR-SEM), while crystalline properties were investigated by powder X-ray diffraction (Empyrean instrument, Panalytical PIXcel3D with CuKα X-ray source in Bragg Brentano geometry). The optical band gap studies were done through PG (UK) instrument T80 UV-Vis spectrophotometer. While functional groups identification were studied by using a JASCO 640 plus infrared spectrometer in the range of 400–4000 cm−1. FTIR experiment was performed in ISO 5 cleanrooms.
2.3. Development of non-enzymatic electrodes using various NiO nanostructures
An array of non-enzymatic electrodes was developed on a glassy carbon electrode (GCE) by depositing various NiO nanostructures using the drop casting method. Next, these electrodes were configured as working electrodes in a three electrode cell set up using silver–silver chloride (Ag/AgCl, 3.0 M KCl), platinum wire as counter electrode. An alumina slurry (0.3 M) was used to clean the GCE, followed by a deionized water wash. An ink containing 5 mg of NiO nanostructures was prepared by mixing 3 mL of deionized water with 0.05 mL of 5% Nafion. A 5 μL of catalyst was dropped onto GCE and dried for 20 min before using it for electrochemical characterization. Urea non-enzymatic sensing was carried out in fresh urea concentrations prepared in 0.1 M NaOH. The electrochemical impedance was measured in the frequency range of 100![[thin space (1/6-em)]](https://www.rsc.org/images/entities/char_2009.gif) 000 kHz to 0 Hz with the use of 0.6 V and amplitude of 5 mV in 0.1 mM urea solution.
000 kHz to 0 Hz with the use of 0.6 V and amplitude of 5 mV in 0.1 mM urea solution.
2.4. Live subject statement
The urine and blood samples collection were performed accordance with the ethical guidelines and procedures formulated for care and use of laboratory based animals related testing at University of Sindh Jamshoro and approved by the ethical committee of Institute of Chemistry. Informed consents were obtained from human participants of this study.
3. Results and discussion
3.1. Structural characterization of various NiO nanostructures prepared with wheat peel extract
XRD was used to investigate the crystalline quality of different NiO nanostructures, and the measured diffraction patterns of various NiO samples are shown in Fig. 1a. Specific reflections of NiO were observed at two theta angles as 111, 200, 220, 311, and 222 which were consistent with the typical diffraction aspects of cubic phase NiO as supported by the standard JCPS card: 01-078-0423. During the growth process, wheat peel extract reduced the relative intensity of NiO diffraction patterns, indicating the influence of several reducing agents on the crystalline features of NiO. According to Scherrer's formula in eqn (1), an average crystallite size of NiO nanostructures can be estimated;| | |
D = 0.89λ/βcosθ
| (1) |
here, λ represents the wavelength of the X-ray, θ as Bragg diffraction angle and β as FWHM.
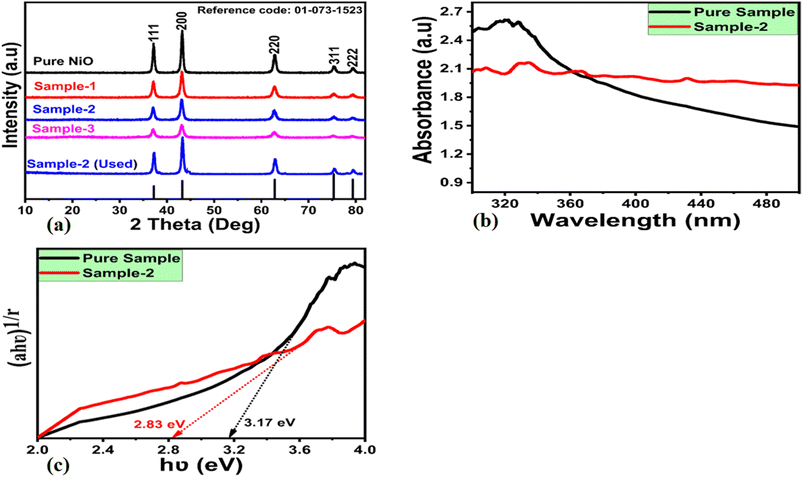 |
| | Fig. 1 (a) XRD diffraction patterns of pure NiO nanostructures and different amounts of wheat peel extract assisted NiO nanostructures (sample 1, sample 2, and sample 3) and used sample 2, (b) UV-visible absorbance spectra of pure NiO and the optimized sample 2, (c) corresponding optical band Tauc plot. | |
The estimated average crystallite size of various NiO samples is given in Table 1.
Table 1 Estimated average crystallite size of different NiO nanostructures
| Name of sample |
Peak position |
FWHM |
Crystalline size (nm) |
| Pure NiO |
43.10 |
0.11984 |
71.2 |
| Sample-1 |
43.02 |
0.2425 |
35.2 |
| Sample-2 |
43.18 |
0.40323 |
21.1 |
| Sample-3 |
43.18 |
0.2 |
42.1 |
Furthermore, we also have carried out XRD on the used sample 2 after the stability test as shown in Fig. 1a. It was seen that the diffraction patterns of typical cubic phase were retained by the sample 2 with the slight variation in the intensity which possibly could be assigned to applied potential during CV analysis.
An optical study of sample 2 and pure NiO nanostructures was conducted, and their corresponding UV-visible absorbance spectra are shown in Fig. 1b. As compared to pure NiO nanostructures, sample 2 exhibits a higher relative absorbance at higher wavelengths. According to the Tauc equation, we have calculated the optical band gap of pure NiO and sample 2 as follows:
in
eqn (2),
α indicates the absorption coefficient,
h as plank constant, and
ν is representing the light frequency.
Pure NiO and sample 2 were calculated to have optical band gaps of 3.12 eV and 2.83 eV, respectively. Wheat peel extract has significantly reduced the optical band gap, allowing further control of charge transfer during electrochemical reactions for sample 2. In principle the results shown in Fig. 1b, we wanted to show the optical band gap difference between the pure NiO and wheat peel extract assisted NiO (sample 2). Because the sample 2 was found highly efficient towards electrochemical sensing of urea, thus the reduced optical band gap has offered the swift electron transfer between the valence and conduction bands.
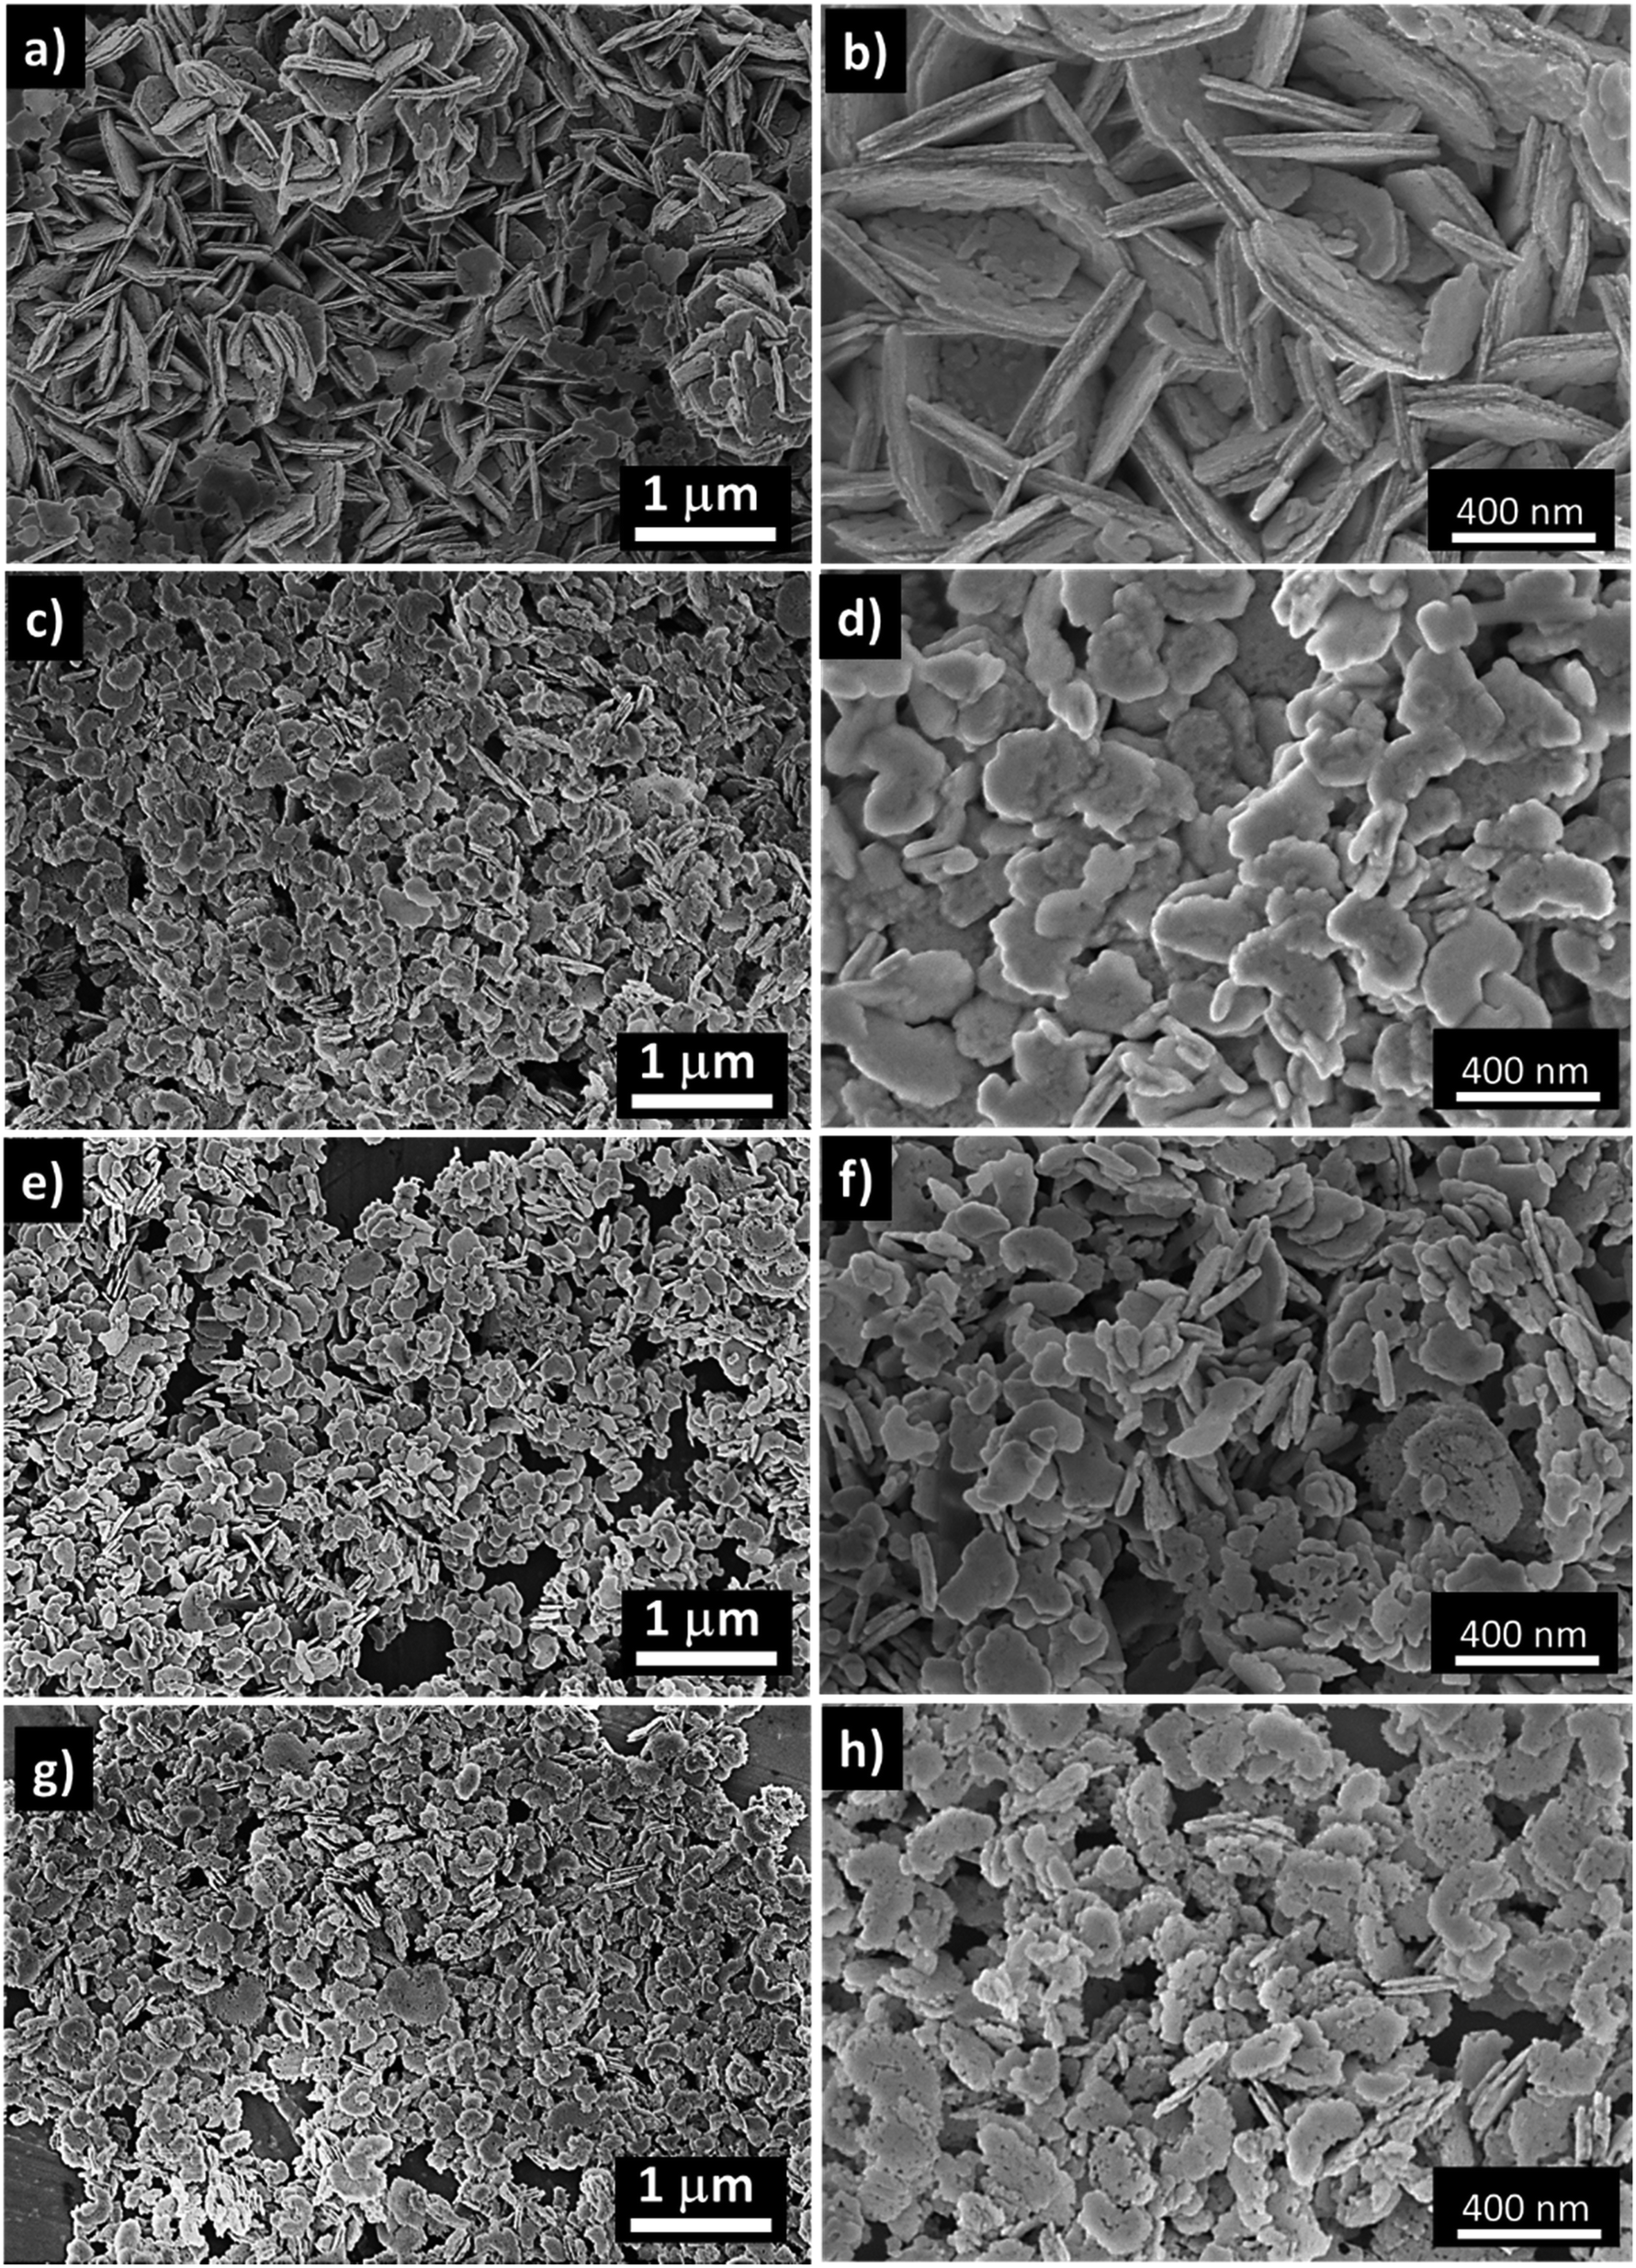
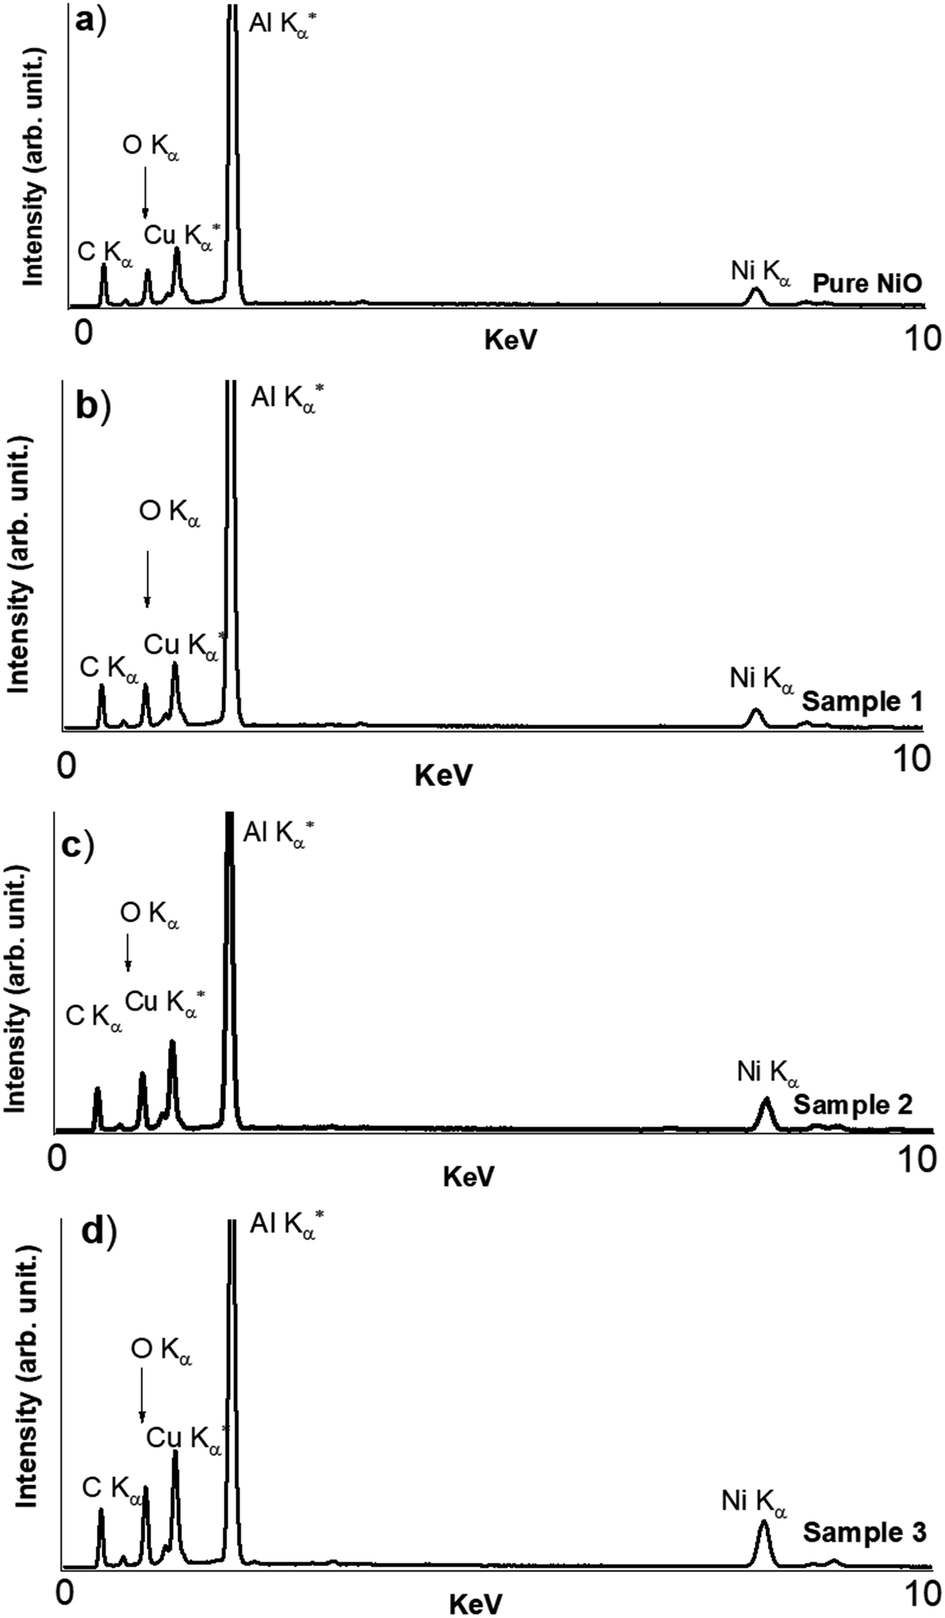
Moreover, the morphology of the various NiO nanostructures prepared without and with an increased amount of wheat peel extract was investigated by SEM as shown in Fig. 2. The pure NiO exhibited a flake-like shape interconnected with several slides as shown in Fig. 2a and b. Without using wheat peel extract during the synthesis, the lateral size of the outcome rigid NiO flakes are in the 300–600 nm range and their thickness was observed around 20 nm (Fig. 2a and b). When wheat peel extract was used, even at low amount, the NiO morphology is modified into nanoplatelets with a significant reduction in both size down to around 100 nm and thickness by a factor 2 at least (Fig. 2c–h). Another noticed effect, amplified for the highest used wheat peel extract amount, is the modification of surface aspects showing more roughness and even holes clearly evidenced for samples 2 and 3 (Fig. 2f and h). Energy dispersive X-ray spectroscopy (EDS) has been performed on the NiO-based compounds produced without (pure NiO) and with wheat peel extract (3 mL, 5 mL, and 7 mL, sample 1, sample 2 and sample 3, respectively) (Fig. 3). From EDS results shown in Fig. 3, apart from C and O usually detected by EDS from natural contamination, Ni is the main recorded element for all the samples, which means that the purity of the samples is not altered by using wheat peal extract. The SEM and EDS analysis have illustrated the role of wheat peel extract on the morphological transformation of NiO nanostructures from flakes to thin nanoplates due to availability wide range of reducing agents especially the starch which on hydrolysis offered the glucose without purity alteration. Thus, the green reducing agents played a vital role in increasing the external usable surface and resulting increase in active sites of NiO induced by both reduction in size and increase in roughness.
 |
| | Fig. 2 Typical SEM images of the NiO nanostructures at different magnifications prepared (a) and (b) without wheat peel extract (pure NiO) and with (c) and (d) 3 mL, (e) and (f) 5 mL and (g) and (h) 7 mL of wheat peel extracts, sample 1, sample 2 and sample 3, respectively. | |
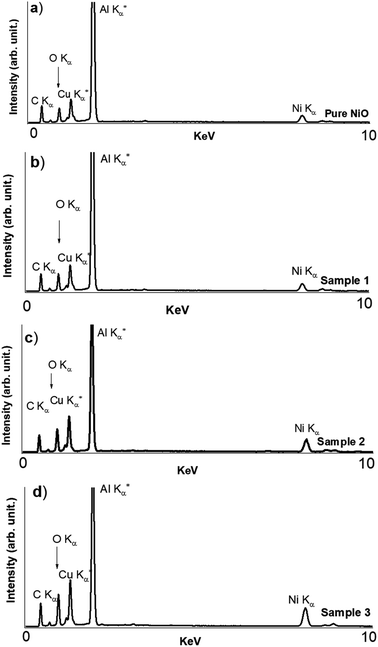 |
| | Fig. 3 EDS analysis of pure NiO and samples 1, 2 and 3 prepared (a) without wheat peel extract and with (b) 3 mL, (c) 5 mL and (d) 7 mL of wheat peel extracts, respectively. Al and Cu come from the sample holder used for EDS analysis. | |
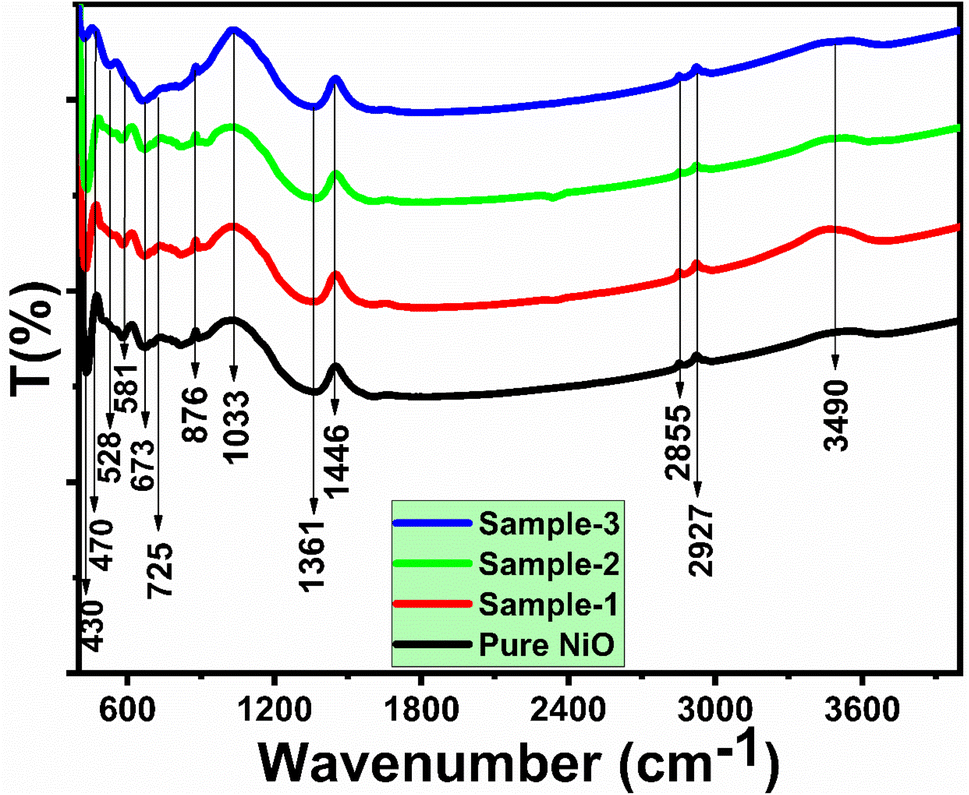
As shown in Fig. 4, FTIR spectra of NiO nanostructures prepared from wheat peel extract were analyzed. As shown in Fig. 4, the vibration modes of NiO nanostructures aided by wheat peel extract were compared with those of NiO prepared without wheat peel extract. It was noted that the typical metal–oxygen stretching vibrations occurred between 430 and 670 cm−1, which could have been attributed to Ni–O bonding.52 A measurement of 1361–1446 cm−1 corresponds to the frequency of C![[double bond, length as m-dash]](https://www.rsc.org/images/entities/char_e001.gif) C aromatic vibrations.53 The measured bend at 1033 cm−1 is attributed to a single vibration of the C–O bond. In the sample 1 and sample 2, the emergence of FTIR band around 2350 cm−1 could be assigned to asymmetric stretching of CO2 which might be involved during the preparation and measurement of FTIR analysis. Even the FTIR measurement was carried out in ISO 5 cleanrooms.
C aromatic vibrations.53 The measured bend at 1033 cm−1 is attributed to a single vibration of the C–O bond. In the sample 1 and sample 2, the emergence of FTIR band around 2350 cm−1 could be assigned to asymmetric stretching of CO2 which might be involved during the preparation and measurement of FTIR analysis. Even the FTIR measurement was carried out in ISO 5 cleanrooms.
 |
| | Fig. 4 FTIR spectra of various NiO nanostructures prepared with different amounts of wheat pee extract (sample 1, sample 2, and sample 3) and their comparison with pure NiO. | |
A wide band measured at 3490 cm−1 may be due to the stretching vibration of the hydroxyl group caused by any adsorbed water molecules on the surface of NiO nanostructures.54
3.2. Electrochemical enzyme free sensing of urea using wheat peel extract derived NiO nanostructures
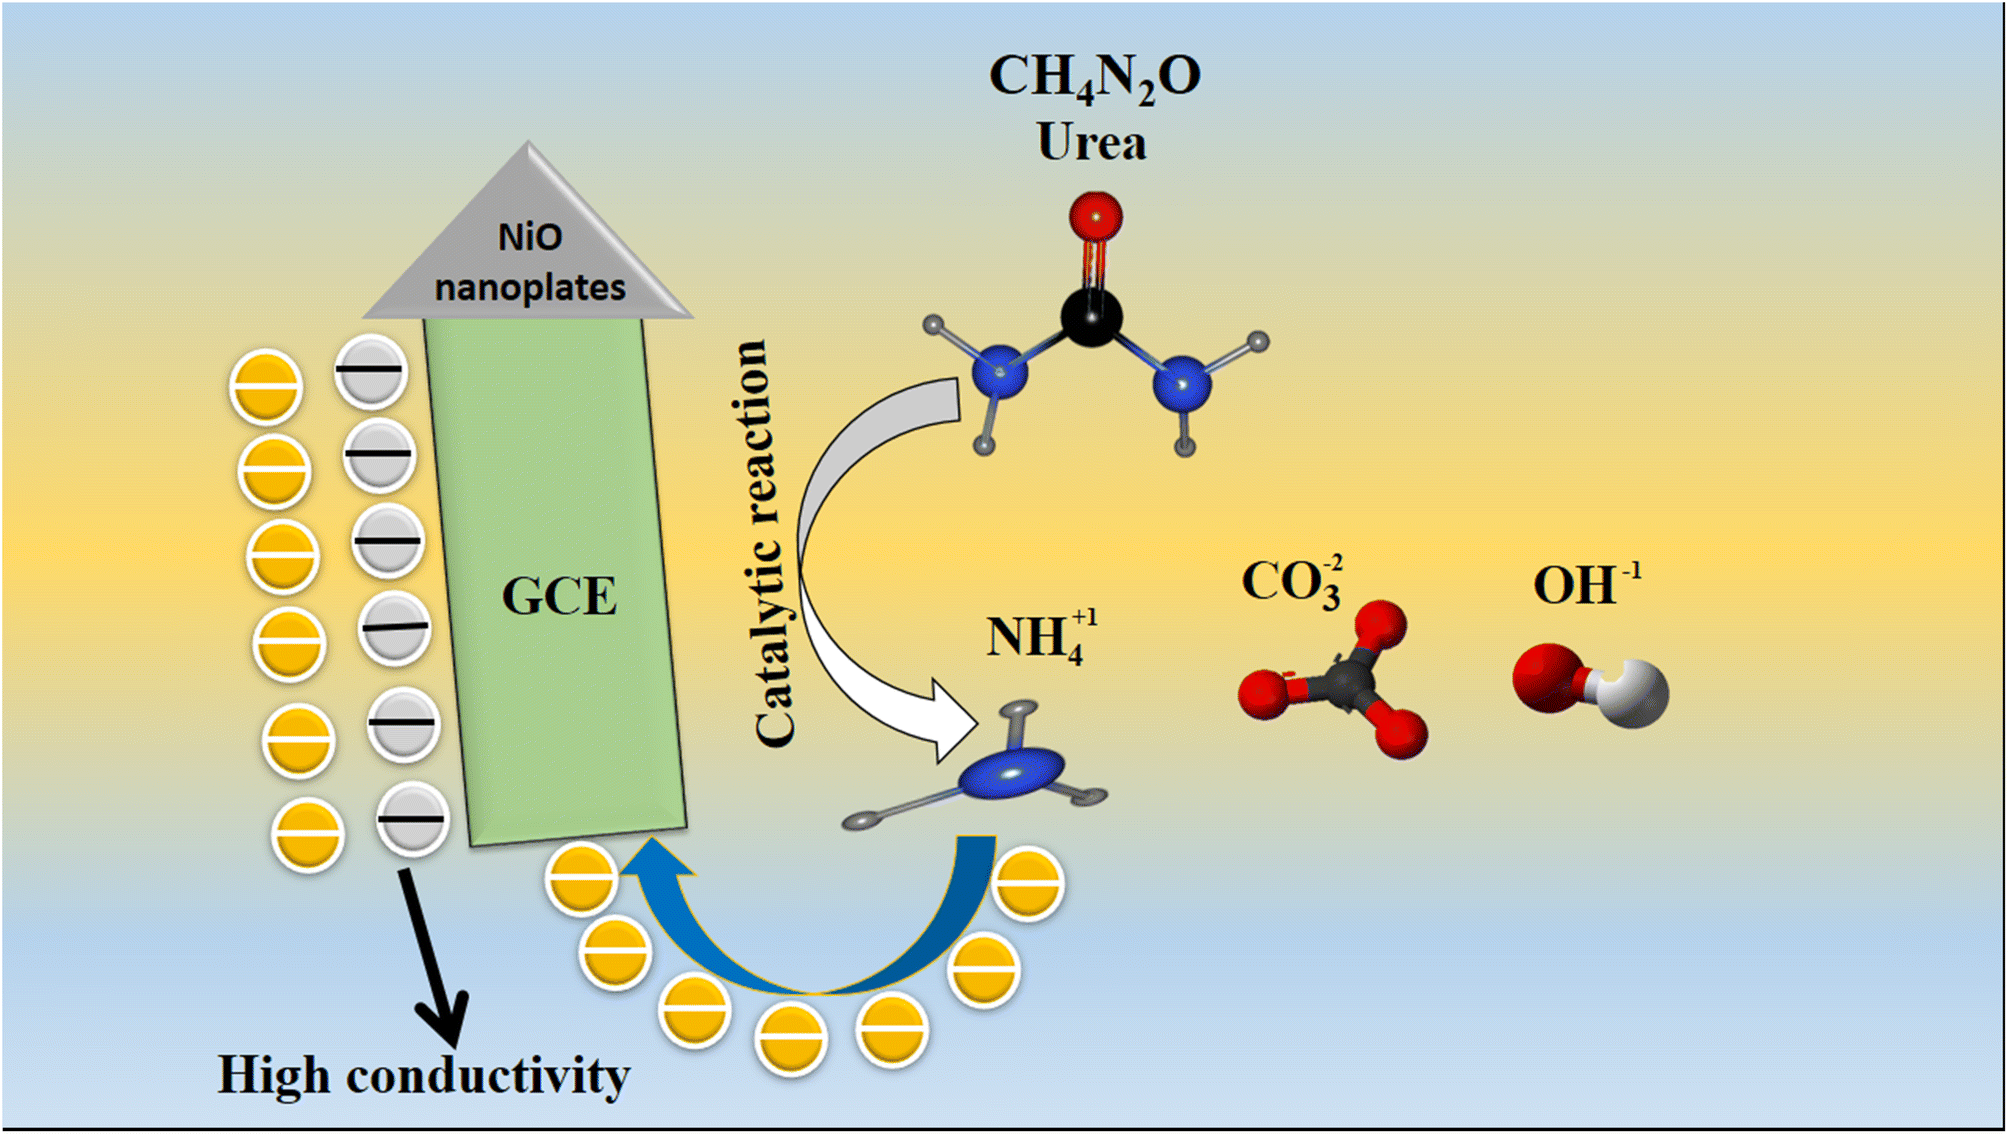
Scheme 1 provides a brief information about the oxidation of urea onto green mediated NiO nanostructures (sample 2). The oxidation of urea was resulted into the formation of carbonate, hydroxide and the ammonium ions as shown in Scheme 1. The enhancement in the oxidation peak current was correlated to the successive addition of urea concentration into the electrolyte solution, consequently the efficient oxidation of urea was found highly favorable onto the surface of green mediated NiO nanostructures. Herein, the wheat peel extract modified the surface of NiO nanostructures which enabled them to respond the urea molecules selectively even in the presence of various interfering agents during the sensing of urea.
 |
| | Scheme 1 Illustration of urea oxidation rate on the pure NiO and NiO derived from 5 mL of wheat peel extract (sample-2). | |
A nonenzymatic approach to urea detection was used in 0.1 M NaOH using an electroanalytical method. For urea sensing, different NiO nanostructures were synthesized with varying amounts of wheat peel extract and their performance was compared with that of the NiO nanostructures synthesized without peel extract.
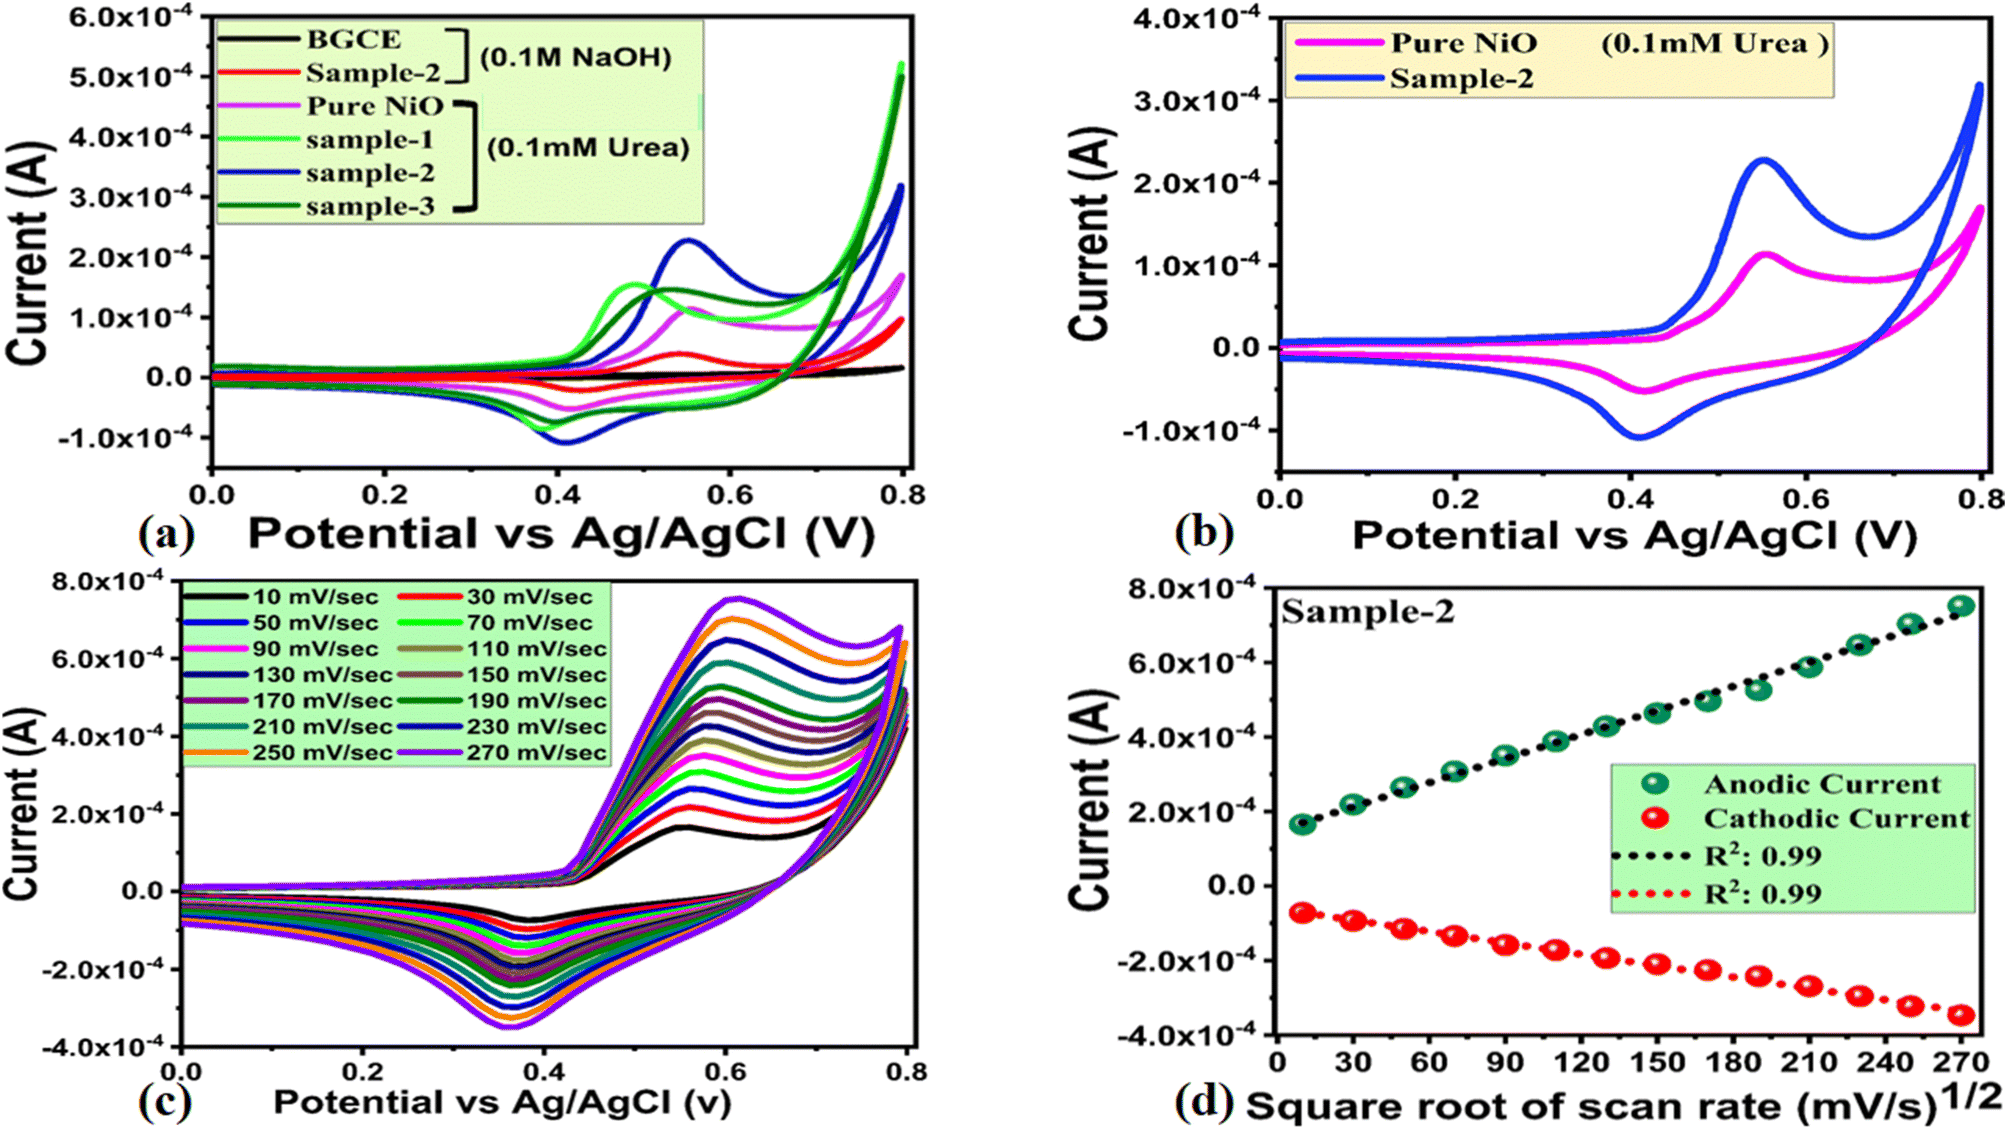
The newly prepared NiO nanostructures were used for the modification of glassy carbon electrodes (GCEs) using the drop casting method. A preliminary urea detection signal was observed through CV at a scan rate of 50 mV s−1 in 0.1 mM urea concentration, as shown in Fig. 5a. As shown in Fig. 4a, the bare GCE exhibited no redox behavior in alkaline solution, whereas three samples of NiO prepared with various concentrations of wheat peel extract demonstrated significant redox activity. CV analysis revealed that pure NiO, sample 1, sample 2, and sample 3 exhibited urea oxidation at different potentials. These include 0.55 V, 0.49 V, 0.54 V, and 0.51 V, respectively. The relative amounts of current generated during the oxidation of urea of pure NiO, sample 1, sample 2, and sample 3 were 0.00010 A, 0.00015 A, 0.00012 A, and 0.00013 A, respectively, as shown in Fig. 4a. According to our CV study, sample 2 has well defined redox properties with enhanced oxidation peak currents when compared to pure NiO, sample 1 and sample 2, and was therefore used for full characterization of urea enzyme sensing. A significant variation in the oxidation peak potential and current could be attributed to the varied molecular environment during synthesis, which has strongly affected the electrochemical and surface properties of NiO nanostructures. In order to clarify the sensing aspects of sample 2, Fig. 5b illustrates the response of sample 2 only in 0.1 mM urea. While the CV curve of pure NiO shows the lower oxidation peak current value of 1.09 × 10⁻⁴ than sample 2 with 2.21 × 10⁻⁴ which is obvious as shown in Fig. 4a and b. As can be seen from Fig. 5a and b, the redox peak for the forward and reverse scan of sample 2 was found to be 0.54 V and 0.41 V, respectively. The redox activity was highly reversible and contributed from Ni2+/Ni3+.55 In fact, Ni(OH)2 was oxidized into active intermediate NiOOH in the forward scan, whereas in the reverse scan, oxidized intermediates were reduced and catalytic sites were regenerated. The effect of scan rate on the behavior of the modified electrode used in sample 2 during urea oxidation was investigated using CV mode in 0.1 mM urea as shown in Fig. 5c. A range of scan rates was used, ranging from 10 mV s−1 to 270 mV s−1, as shown in Fig. 5c. A study of scan rate has shown that when the scan rate was changed from 10 mV s−1 to 270 mV s−1, the oxidation potential was slightly altered from 0.54 V to 0.60 V.
 |
| | Fig. 5 (a) CV curves of bare glassy carbon electrode (BGCE), pure NiO nanostructures and green mediated NiO nanostructures using different volume of wheat peel extract such as 3 mL, 5 mL, 7 mL (sample 1, sample 2, and sample 3) at 50 mV s−1 with and without urea in 0.1 M NaOH, (b) CV curves of pure NiO nanostructures and green mediated NiO nanostructures (sample 2) only measured at 50 mV s−1 in 0.1 mM urea, (c) CV curves of green mediated NiO nanostructures (sample 2) measured at various scan rates in 0.1 mM urea, (d) corresponding linear plot of anodic and cathodic peak currents against square root of scan rate. | |
In the forward scan, urea oxidation was detected as nitrogen and carbon monoxide. In the reverse scan the oxidation urea resulted in intermediates which were adsorbed on the surface of modified electrodes and oxidized at a potential of 0.54 V. As a result, the catalyst surface was being regenerated for further oxidation of urea molecules until all urea molecules had been oxidized. In Fig. 4d, a linear relationship has been established between peak current and square root of scan rate with increasing scan rate. Linear fitting showed a regression coefficient of 0.99, indicating diffusion-controlled charge transfer of urea on the modified electrode. According to ref. 56 and 57 urea oxidation may involve the following reactions:
| | |
6NiO + 6OH− → 6NiOOH + 6e−
| (3) |
| | |
6NiOOH + CO(NH2)2 + 2OH− → 6Ni (OH)2 + N2 + CO32−
| (4) |
| | |
CO(NH2)2 + 6OH− → N2 + 5H2O + CO2 + 6e−
| (5) |
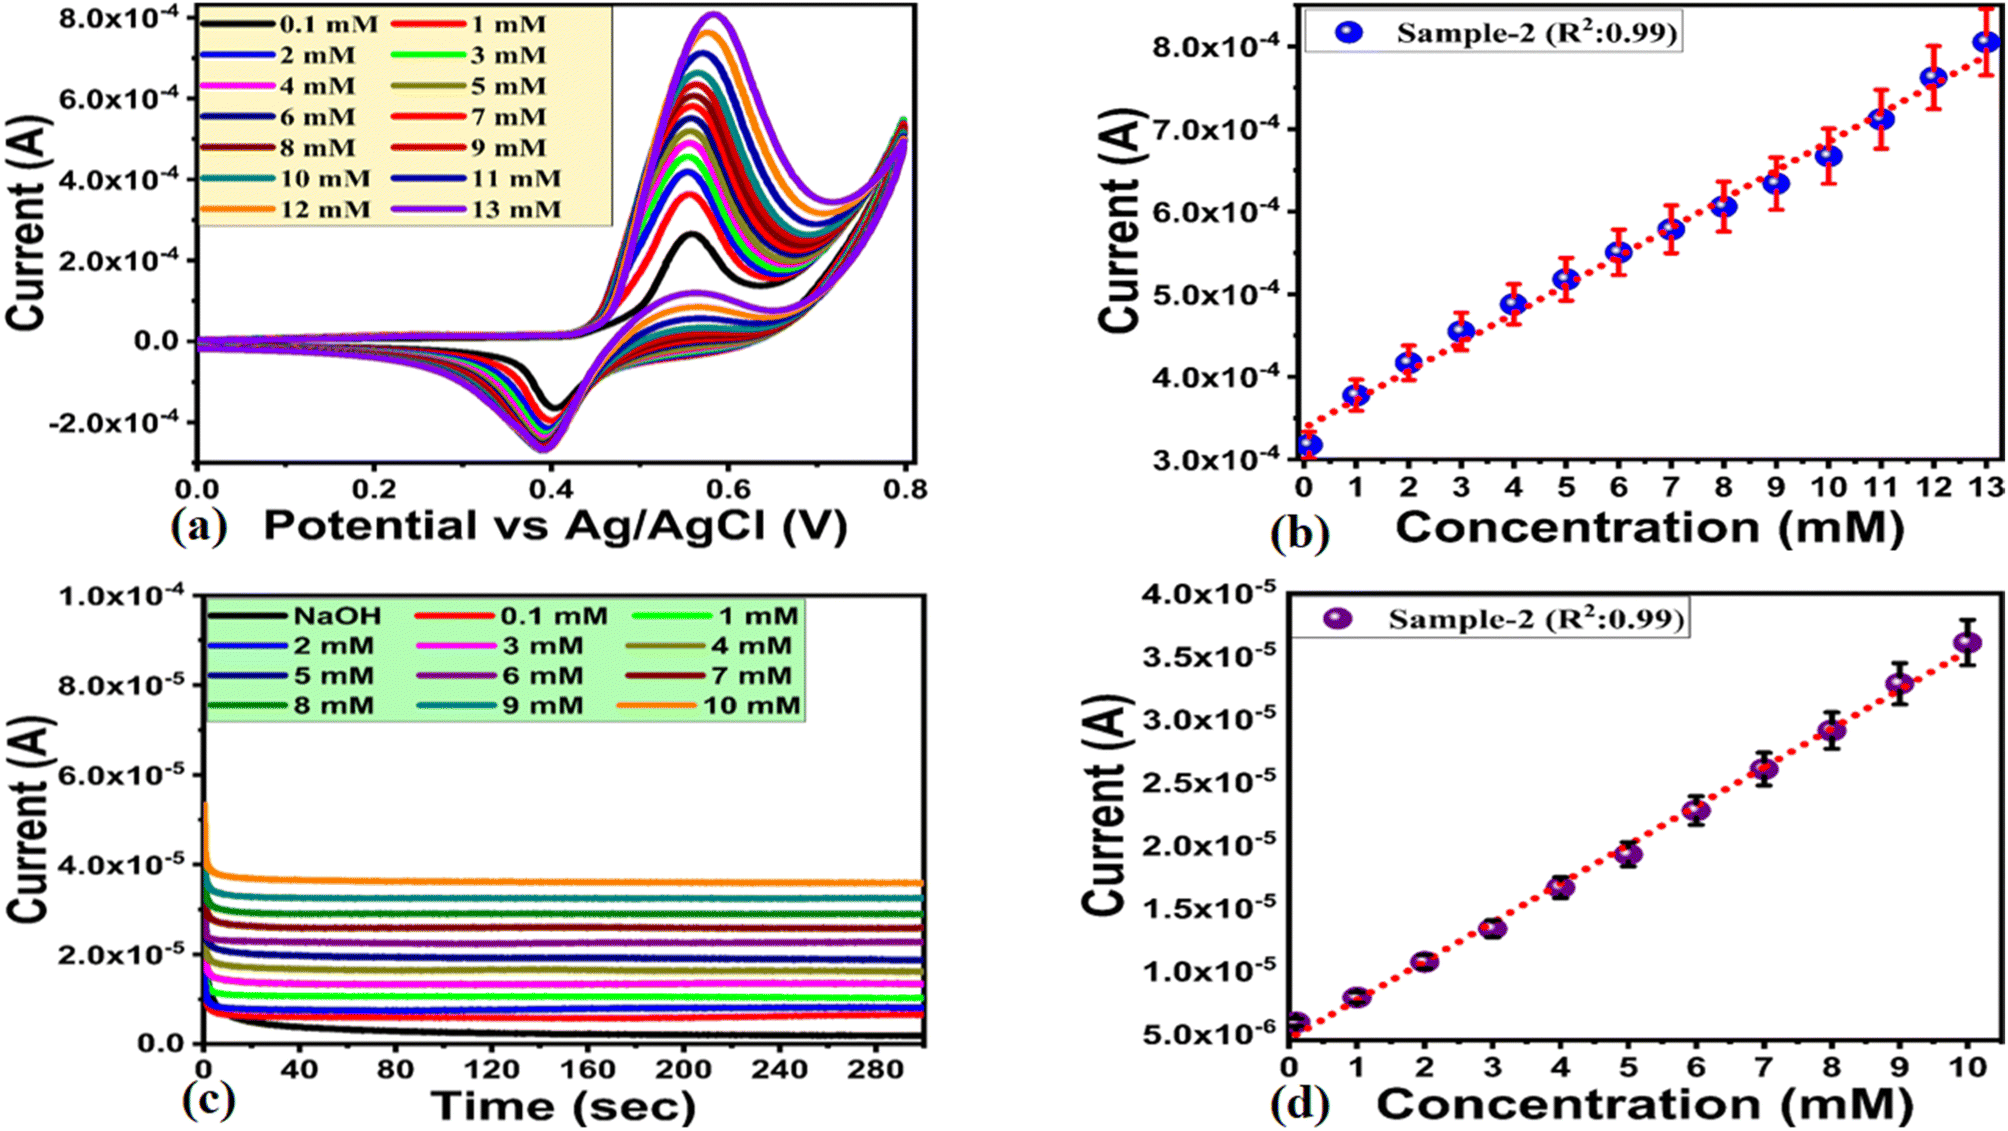
Following the preliminary electrochemical testing, sample 2 was evaluated for linear range, limit of detection, stability, selectivity, and practical applicability. For the linear range verification, CV curves were measured at 50 mV s
−1 against various urea concentrations prepared in 0.1 M NaOH as shown in
Fig. 6a. As can be seen from the oxidation peak current, sample 2 predominantly displays urea oxidation signals. In each increment of urea concentration, the oxidation peak was greatly enhanced while the reduction peak current was limited, indicating that sample 2 mainly oxidizes the urea molecules. The analytical aspects of sample 2 were further validated by building a linear plot between oxidation peaks current and urea concentration as shown in
Fig. 6b. An excellent analytical behavior of the modified electrode was evident from the linear fitting with a regression coefficient of
R2: 0.99. The linear range of the proposed non-enzymatic urea sensor was 0.1 mM to 13 mM. According to the published work,
58 the limit of detection (LOD) and limit of quantification (LOQ) for the newly designed non-enzymatic urea sensor were also calculated. It was found that the LOD and LOQ values of the proposed urea sensor configuration based on wheat peel extract derived NiO nanostructures were 0.003 mM and 0.007 mM respectively. These results demonstrate the potential of the proposed urea sensor configuration. The linear range obtained from CV analysis was further enhanced by the highly sensitive chronoamperometric mode, which was carried out at 0.56 V. It was also noticed that the pH of 0.1 M NaOH was approximately 11, while the addition of urea into alkaline electrolyte did not bring any significant increase in the pH even at the addition of 13 mM urea concentration. However, the variation of pH at the addition of 13 mM into 0.1 M NaOH was noticed from 11 to 11.2. This verifies that the electrical signal of proposed non-enzymatic urea sensor was mainly governed by the detection of urea, while in the estimated linear range there was negligible effect on the increase in pH of electrolyte with the addition of successive urea concentrations.
Fig. 6c illustrates the recorded chronoamperometric response curves. As shown in
Fig. 6c, the current steadily increased with each rise in urea concentration, and the signal remained stable for 300 s.
 |
| | Fig. 6 (a) CV curves of sample 2 at 50 mV s−1 in various urea concentrations prepared in 0.1 M NaOH, (b) linear plot of oxidation peak current against different urea concentrations, (c) chronoamperometric response of sample 2 against different concentrations of urea, (d) linear plot of oxidation peak current versus different urea concentrations. | |
A chronoamperometric analysis was conducted in 0.1 M NaOH followed by the addition of various concentrations of urea. To verify the linear range of the non-enzymatic urea sensor, generated chronoamperometric current of different urea concentrations was linearly fitted against each urea concentration as shown in Fig. 6d. In Fig. 6d, the linear range estimated from chronoamperometric response ranges from 0.1 mM to 10 mM, which highlights the sensitive signal generated by sample 2 during the detection of urea. For this detection range of urea, the linear plot was characterized by a regression coefficient of 0.99, further confirming the excellent analytical properties of the modified electrode. Sample 2 exhibited enhanced performance due to its highly modified surface properties including catalytic sites, electrical conductivity, and high exposure to urea molecules. The NiO nanostructures exhibited these properties when a substantial amount of reducing agents from wheat peel extract was added to the synthesis process. Fig. 7a shows the results of a series of CV repeatable cycles performed in 0.1 mM urea at a scan rate of 50 mV s−1 to demonstrate the stability of the modified electrode. According to the results, the modified electrode exhibited no change in peak current or potential, indicating high performance stability and its application in urea measurement. Based on a bar graph of the peak current variation, the relative standard deviation was found to be less than 4%, indicating that the modified electrode has the ability to be reproducible as shown in Fig. 7b. In Fig. 7c, the selectivity of the modified electrode was evaluated with closely interfering species such as ascorbic acid, glucose, uric acid, sodium ions, and magnesium ions during the detection of urea. CV measurements at 50 mV s−1 were conducted with urea and interfering compounds in the same 0.1 mM molecular environment, and the electrochemical signal was recorded. Fig. 7c illustrates that the oxidation peak current and potential of urea were not affected by the presence of various interring compounds such as ascorbic acid, uric acid, glucose, magnesium, and sodium ions. A CV analysis of eh selectivity has confirmed the sensor's ability to quantify urea in a complex molecular environment as encountered in the analysis of real samples. The fabrication of selective non-enzymatic sensors is mainly governed by the functional properties of sensing material. This is the reason, the synthesis of sensing materials with desirable selectivity is very challenging task, and therefore the research in this domain is limited to date. We have investigated the selectivity of our non-enzymatic urea sensor under the microenvironment of common interfering agents during the sensing of urea which were not sensed by the proposed NiO nanostructures prepared with the wheat peel extract (sample 2). The wheat peel extract has enriched the selective surface properties of NiO nanostructures towards urea detection due to the presence of natural reducing, capping and stabilizing agents. The use of new strategies for enhancing the surface properties of nanostructured materials are highly desirable towards the development of highly selective and sensitive non-enzymatic sensors. Therefore, the proposed study could be used as an alternative protocol for the selective detection of urea under the microenvironment of common interfering substances. In order to prove that sample 2 outperformed sample 1 and sample 3 in terms of on-enzymatic sensing of urea, EIS studies were conducted and its charge transfer value was compared with pure NiO, sample 1 and sample 3 as shown in Fig. 7c. The use of EIS analysis was adopted for the understanding of charge transport between the analyte and the sensing material during the urea sensing application. As shown in Fig. 7d, the raw EIS data was well fit with an equivalent circuit consisting of charge transfer resistance (Rct), solution resistance (Rs), and constant phase element (CPE). In this study, the CPE was associated with double layer capacitance and provided information on the interfacial non-homogeneity and roughness of the electrode surface. The EIS study was conducted in 0.1 mM, and the measured charge transfer resistance values for pure NiO, sample 1, sample 2 and sample 3 were 15.87, 13.23, 0.66 and 3.51 Ohms, respectively. This reduction in charge transfer resistance for sample 2 confirms its excellent electrochemical activity towards the oxidation of urea and favors the transfer of charge at the electrode interface resulting in the generation of highly sensitive electrical signals. As shown in Fig. 8a–c, electrochemical active surface area (ECSA) measurements of sample 2 for the oxidation of urea were carried out using non-faradic CV cycles under alkaline media. The ECSA estimates were calculated by dividing the subtracted anodic and cathodic current densities by two. An analysis of the linear relationship between current density and scan rate was performed, and the slope value was indexed to the ECSA of each sample as shown in Fig. 8d. The quantified ECSA values for pure NiO, sample 1 and sample 2 were 9.546 nF cm−2, 8.906 nF cm−2 and 1.111 μF cm−2 respectively. According to the ECSA study, sample 2 is oriented with a high level of ECSA, therefore they are expected to dominate the favorable oxidation of urea. Together, the ECSA, EIS, and EIS demonstrated high performance urea sensing without the use of enzymes in sample 2. Using sample 2 of NiO, urea was determined using the percent (%) recovery method from urine and blood samples. Individuals listed in the author list willingly provided blood and urine samples, which were diluted in 0.1 M NaOH solution with 1:10 with their consent. Real sample analysis was performed three times, and the results are presented in Table 2 with standard deviation. In terms of reliability and accuracy, sample 2 has been proven to be highly reliable and accurate for quantifying urea in real samples, as evidenced in the standard deviation of less than 1%. We calculated the relative standard deviation (RSD) by using the given relationship (standard deviation/mean of quantified urea content over three repeatable cycles) × 100%.
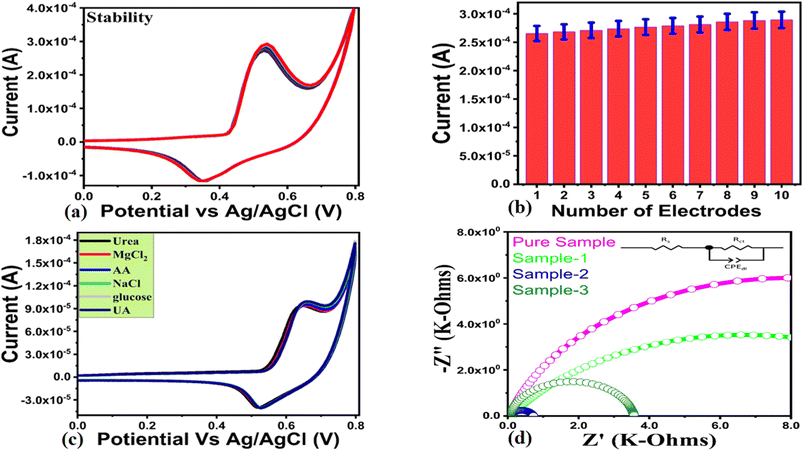 |
| | Fig. 7 (a) CV curves at 50 mV s−1 illustrating the repeatable stability of sample 2 in 0.1 mM urea, (b) reproducibility of various modified electrodes of sample 2 in 0.1 mM urea, (c) CV curves at 5 mV s−1 of sample 2 in the different interfering environment of measuring the selectivity, (d) EIS Nyquist plots of different NiO samples in the frequency range of 100000 kHz to 0.1 Hz using 0.6 V, an amplitude of 5 mV in 0.1 mM urea. | |
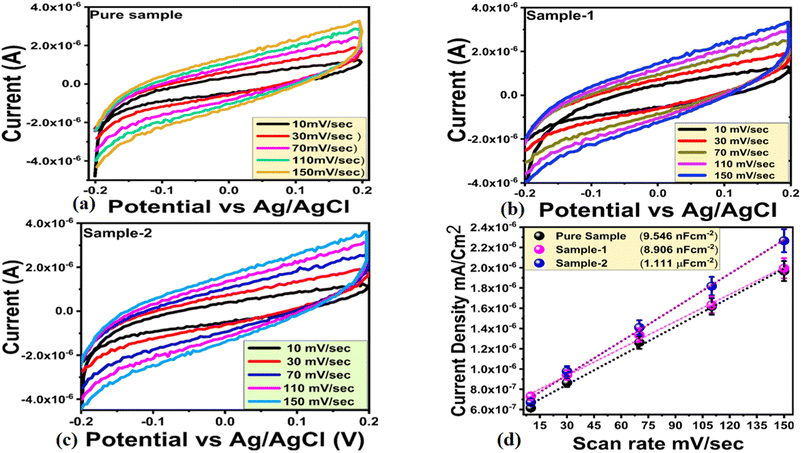 |
| | Fig. 8 (a)–(c) Non faradaic CV curves of various NiO nanostructures at different scan rates in, 0.1 mM urea, (d) linear plot of the difference of anodic and cathodic sides current densities against scan rate for the quantification of ECSA. | |
Table 2 Practical aspects of sample 2 for urea detection from real samples using (%) recovery method
| Sample |
Added (mM) |
Found (mM) |
(%) Recovery |
(%) RSD |
| Urine 1 |
— |
2.3 |
— |
|
| 0.5 |
2.81 ± 0.004 |
99.64 |
0.35 |
| 1 |
3.31 ± 0.002 |
99.69 |
0.44 |
| Urine 2 |
— |
2.5 |
— |
|
| 1 |
3.48 ± 0.003 |
100.80 |
0.49 |
| 2 |
4.51 ± 0.001 |
99.77 |
0.47 |
| 2 |
9.88 ± 0.001 |
99.71 |
0.48 |
| Blood 1 |
— |
3.5 |
— |
|
| 1 |
4.52 ± 0.003 |
99.55 |
0.54 |
| 1.5 |
5.01 ± 0.001 |
99.60 |
0.50 |
| Blood 2 |
— |
4.5 |
— |
|
| 0.5 |
4.99 ± 0.002 |
100.20 |
0.48 |
| 1.5 |
6.02 ± 0.004 |
99.66 |
0.50 |
A comparison was made between the performance of the non-enzymatic urea sensor developed as of this writing and the results of several recently reported urea sensing studies, as shown in Table 3.59–73 The presented urea sensor demonstrated a wide linear range, a low limit of detection, and a green mediated scaling up methodology, as shown in Table 3. The presented results were compared with both enzymatic and non-enzymatic urea sensors. The most favorable advantages of the proposed non-enzymatic urea sensor are low cost, simple, sensitive, exhibiting wide linear range, not involving any bio sensitive membrane like urease enzyme, avoid the issues of enzyme immobilization, and environment friendly. From a performance perspective, it's evident that the proposed urea sensing configuration is capable of monitoring urea content in biological fluids, food, and agricultural fields. It is possible to attribute the superiority of the proposed urea sensor to its ease of use, high sensitivity, and lack of storage life issues due to its lack of dependence on urease enzyme. Consequently, it can be used to quantify urea in a variety of real samples and it can be used as a potential and promising alternative analytical tool.
Table 3 Comparison of non-enzymatic urea performance of sample 2 with recently published urea sensors
| Electrode material |
Linear range (mM) |
LOD (μM) |
Sensing material |
References |
| NiO/GCE |
0.1–1.1 |
10 |
Urea |
59 |
| NiS/GO/MGCE |
0.1–1 |
3.79 |
Urea |
60 |
| NiO–MoO3 |
0.2–1 |
0.86 |
Urea |
61 |
| NiO/cellulose/CNT |
0.01–1.4 |
7 |
Urea |
62 |
| 3D graphene/NiCo2O4 |
0.06–0.30 |
5 |
Urea |
63 |
| Ni-MOF/Nafion/GCE |
0.01–7 |
2.7 |
Urea |
64 |
| Vitamin C based NiO |
0.1–1.1 |
10 |
Urea |
65 |
| Graphene–PANi/GCE |
0.01–0.2 |
5.8 |
Urea |
66 |
| Graphene nanoplatelet/graphitized nano diamond |
1.6–15 |
83 |
Urea |
67 |
| NiBzimpy/MCPE |
0.01–0.1 |
1.5 |
Urea |
68 |
| In2S3/LDH/ITO@urease |
1–240 μM |
0.246 |
Urea |
69 |
| Urease–Ag/rGO |
0–10000 μM |
0.163 |
Urea |
70 |
| γ-Al2O3QDs–GCE |
3.56–16.52 μM |
0.110 |
Urea |
71 |
| Cys/MWCNT–PAMAM |
1–20 |
400 |
Urea |
72 |
| GNDs/PANI |
0.1 to 0.9 mg mL−1 |
800 |
Urea |
73 |
| NiO nanoplates |
0.1–13 |
3 |
Urea |
Present work |
4. Conclusions
We have used green reducing and structure orienting agents from wheat peel extract in order to transform the nanoflake morphology of NiO into plate shape and tune the surface properties of the sensor to develop a non-enzymatic urea sensor in 0.1 M NaOH alkaline media. As a result of the green reducing agents and structure orienting agents, NiO's optical band gap was significantly reduced. The influence of wheat peel extract on the structure of e–h transformation and electrochemical performance was also evaluated. The NiO nanostructures prepared with 5 mL of wheat peel extract (sample 2) were highly active and had improved electrical conductivity. According to the proposed non-enzymatic urea configuration based on sample 2, urea was detected over a wide linear range of 0.1 mM to 13 mM with a low detection limit of 0.003 mM. Non-enzymatic urea sensors based on sample 2 demonstrated superior performance due to their high surface exposure and low charge transfer resistance. It is likely that sample 2's enhanced urea detection performance is a result of the high density of catalytic sites, surface oxygen vacancies, low charge transfer resistance and morphological transformation caused by the use of a wide range of reducing and structure orienting agents from wheat peel extract. We suggest that the use of wheat peel extract for the synthesis of nanostructured materials as well as the non-enzymatic urea sensor presented could be employed as an alternative strategy for a wide range of applications.
Conflicts of interest
Authors have no conflict of interest in the presented research work.
Acknowledgements
The authors would like to acknowledge the Higher Education Commission of Pakistan for its partial support of the project (NRPU/8350). The authors extend their sincere appreciation to the Researchers Supporting Project number (RSP2023R442), King Saud University, Riyadh, Saudi Arabia, for partial funding of this work. The authors acknowledge partial funding from Ajman University, Grant DRGS ref. 2023-IRG-HBS-2. Brigitte Vigolo and Mélanie Emo would like to thank the platform “Microscopies, Microprobes and Metallography (3 M)” (Institut Jean Lamour, IJL, Nancy, France) for access to TEM and SEM facilities.
References
- R. Jin, The impacts of nanotechnology on catalysis by precious metal nanoparticles, Nanotechnol. Rev., 2012, 1, 31–56 CAS.
- N. C. Yeh, Nanotechnology for electronics & photonics, Technovation, 2013, 33, 108 CrossRef.
- P. Boisseau and B. Loubaton, Nanomedicine, nanotechnology in medicine, C. R. Phys., 2011, 12, 620–636 CrossRef CAS.
- V. Mangematin and S. Walsh, The future of nanotechnologies, Technovation, 2012, 32, 157–160 CrossRef.
- D. P. Cormode, T. Skajaa, Z. A. Fayad and W. J. Mulder, Nanotechnology in medical imaging: probe design and applications, Arterioscler., Thromb., Vasc. Biol., 2009, 7, 992–1000 CrossRef.
- F. Tahernejad-Javazmi, M. Shabani-Nooshabadi and H. Karimi-Maleh, 3D reduced graphene oxide/FeNi3-ionic liquid nanocomposite modified sensor; an electrical synergic effect for development of tert-butylhydroquinone and folic acid sensor, Composites, Part B, 2019, 172, 666–670 CrossRef CAS.
- H. W. Shim, A. H. Lim, K. M. Min and D. W. Kim, Synthesis of manganese oxide nanostructures using bacterial soft templates, CrystEngComm, 2011, 13, 6747–6752 RSC.
- J. Xie, J. Yang, L. Wang and Y. P. Ting, High-yield synthesis of complex gold nanostructures in a fungal system, J. Phys. Chem. C, 2007, 111, 16858–16865 CrossRef CAS.
- R. Mohammadinejad, S. Karimi, S. Iravani and R. S. Varma, Plant-derived nanostructures: types and applications, Green Chem., 2016, 18, 20–52 RSC.
- M. Apte, D. Sambre, S. Gaikawad, S. Joshi, A. Bankar, A. R. Kumar and S. Zinjarde, Psychrotrophic yeast Yarrowia lipolytica NCYC 789 mediates the synthesis of antimicrobial silver nanoparticles via cell-associated melanin, AMB Express, 2013, 3, 32 CrossRef.
- L. Yang, W. Guan, B. Bai, Q. Xu and Y. Xiang, Synthesis of yeast-assisted Co3O4 hollow microspheres—a novel biotemplating technique, J. Alloys Compd., 2010, 504, L10–L13 CrossRef CAS.
- R. Xiong, C. Lu, W. Zhang, Z. Zhou and X. Zhang, Facile synthesis of tunable silver nanostructures for antibacterial application using cellulose nanocrystals, Carbohydr. Polym., 2013, 95, 214–219 CrossRef CAS.
- S. A. R. Alavi-Tabari, M. A. Khalilzadeh and H. Karimi-Maleh, Simultaneous determination of doxorubicin and dasatinib as two breast anticancer drugs uses an amplified sensor with ionic liquid and ZnO nanoparticle, J. Electroanal. Chem., 2018, 811, 84–88 CrossRef CAS.
- S. Iravani, Green synthesis of metal nanoparticles using plants, Green Chem., 2011, 13, 2638–2650 RSC.
- B. Wang, J. S. Chen, Z. Wang, S. Madhavi and X. W. Lou, Green synthesis of NiO nanobelts with exceptional pseudo-capacitive properties, Adv. Energy Mater., 2012, 10, 1188–1192 CrossRef.
- M. Miraki, H. KarimiMaleh, M. A. Taher, S. Cheraghi, F. Karimi, S. Agarwal and V. K. Gupta, Voltammetric amplified platform based on ionic liquid/NiO nanocomposite for determination of benserazide and levodopa, J. Mol. Liq., 2019, 278, 672–676 CrossRef CAS.
- Q. Zhou, Z. Lu, Z. Wei, L. Xu, Y. Gui and W. Chen, Hydrothermal synthesis of hierarchical ultrathin NiO nanoflakes for high-performance CH4 sensing, Front. Chem., 2018, 6, 194 CrossRef.
- J. Xu, M. Wang, Y. Liu, J. Li and H. Cui, One-pot solvothermal synthesis of size-controlled NiO nanoparticles, Adv. Powder Technol., 2019, 30, 861–868 CrossRef CAS.
- N. Kaur, J. Singh, G. Kaur, S. Kumar, D. Kukkar and M. Rawat, CTAB assisted co-precipitation synthesis of NiO nanoparticles and their efficient potential towards the removal of industrial dyes, Micro Nano Lett., 2019, 14, 856–859 CrossRef CAS.
- I. Sohail, Z. Hussain, A. N. Khan and K. Yaqoob, Synthesis and characterization of electrodeposited NiO thin film on electrode grade carbon plate for supercapacitor applications, Mater. Res. Express, 2017, 4, 116412 CrossRef.
- N. N. M. Zorkipli, N. H. M. Kaus and A. A. Mohamad, Synthesis of NiO nanoparticles through sol-gel method, Procedia Chem., 2016, 19, 626–631 CrossRef CAS.
- A. A. Ezhilarasi, J. J. Vijaya, K. Kaviyarasu, M. Maaza, A. Ayeshamariam and L. J. Kennedy, Green synthesis of NiO nanoparticles using Moringa oleifera extract and their biomedical applications: cytotoxicity effect of nanoparticles against HT-29 cancer cells, J. Photochem. Photobiol., B, 2016, 164, 352–360 CrossRef CAS.
- A. Angel Ezhilarasi, J. Judith Vijaya, K. Kaviyarasu, L. John Kennedy, R. J. Ramalingam and H. A. Al-Lohedan, Green synthesis of NiO nanoparticles using Aegle marmelos leaf extract for the evaluation of in-vitro cytotoxicity, antibacterial and photocatalytic properties, J. Photochem. Photobiol., B, 2018, 180, 39–50 CrossRef CAS.
- A. A. Ezhilarasi, J. J. Vijaya, K. Kaviyarasu, M. Maaza, A. Ayeshamariam and L. J. Kennedy, Green synthesis of NiO nanoparticles using Moringa oleifera extract and their biomedical applications: cytotoxicity effect of nanoparticles against HT-29 cancer cells, J. Photochem. Photobiol., B, 2016, 164, 352–360 CrossRef CAS.
- M. Kundu, G. Karunakaran and D. Kuznetsov, Green synthesis of NiO nanostructured materials using Hydrangea paniculata flower extracts and their efficient application as supercapacitor electrodes, Powder Technol., 2017, 311, 132–136 CrossRef CAS.
- F. Chen, W. Zhou, H. Yao, P. Fan, J. Yang, Z. Fei and M. Zhong, Self-assembly of NiO nanoparticles in lignin-derived mesoporous carbons for supercapacitor applications, Green Chem., 2013, 15, 3057–3063 RSC.
- N. B. Trung, T. V. Tam, D. K. Dang, K. F. Babu, E. J. Kim, J. Kim and W. M. Choi, Facile synthesis of three-dimensional graphene/nickel oxide nanoparticles composites for high performance supercapacitor electrodes, Chem. Eng. J., 2015, 264, 603–609 CrossRef CAS.
- F. Su, X. Lv and M. Miao, High-performance two-ply yarn supercapacitors based on carbon nanotube yarns dotted with Co3O4 and NiO nanoparticles, Small, 2015, 11, 854–861 CrossRef CAS.
- Z. Parsaee, Synthesis of novel amperometric urea-sensor using hybrid synthesized NiO-NPs/GO modified GCE in aqueous solution of cetrimonium bromide, Ultrason. Sonochem., 2018, 44, 120–128 CrossRef CAS.
- L. Li, Y. Long, J. M. Gao, K. Song and G. Yang, Label-free and pH sensitive colourimetric materials for the sensing of urea, Nanoscale, 2016, 8, 4458–4462 RSC.
- T. Ahuja, I. A. Mir and D. Kumar, Potentiometric urea biosensor based on BSA embedded surface modified polypyrrole film, Sens. Actuators, B, 2008, 134, 140–145 CrossRef CAS.
- D. Dutta, S. Chandra, A. K. Swain and D. Bahadur, SnO2 quantum dots-reduced graphene oxide composite for enzyme-free ultrasensitive electrochemical detection of urea, Anal. Chem., 2014, 86, 5914–5921 CrossRef CAS.
- L. Liu, H. Mo, S. Wei and D. Raftery, Quantitative analysis of urea in human urine and serum by 1H nuclear magnetic resonance, Analyst, 2012, 137, 595 RSC.
- M. Singh, N. Verma, A. K. Garg and N. Redhu, Urea biosensors, Sens. Actuators, B, 2008, 134, 345–351 CrossRef CAS.
- M. Ezhilan, M. B. Gumpu, B. L. Ramachandra, N. Nesakumar, K. J. Babu, U. M. Krishnan and J. B. B. Rayappan, Design and development of electrochemical biosensor for the simultaneous detection of melamine and urea in adulterated milk samples, Sens. Actuators, B, 2017, 238, 1283–1292 CrossRef CAS.
- R. Rahmanian and S. A. Mozaffari, Electrochemical fabrication of ZnO-polyvinyl alcohol nanostructured hybrid film for application to urea biosensor, Sens. Actuators, B, 2015, 207, 772–781 CrossRef CAS.
- R. K. Srivastava, S. Srivastava, T. N. Narayanan, B. D. Mahlotra, R. Vajtai, P. M. Ajayan and A. Srivastava, Functionalized multilayered graphene platform for urea sensor, ACS Nano, 2011, 6, 168–175 CrossRef.
- A. Sharma, K. Rawat, H. B. Bohidar and P. R. Solanki, Studies on claygelatin nanocomposite as urea sensor, Appl. Clay Sci., 2017, 146, 297–305 CrossRef CAS.
- T. Alizadeh, M. R. Ganjali and F. Rafiei, Trace level and highly selective determination of urea in various real samples based upon voltammetric analysis of diacetylmonoxime-urea reaction product on the carbon nanotube/carbon paste electrode, Anal. Chim. Acta, 2017, 974, 54–62 CrossRef CAS.
- K. M. Khan, H. Krishna, S. K. Majumder and P. K. Gupta, Detection of urea adulteration in milk using near-infrared Raman spectroscopy, Food Anal. Methods, 2015, 8, 93–102 CrossRef.
- S. Clark, P. S. Francis, X. A. Conlan and N. W. Barnett, Determination of urea using highperformance liquid chromatography with fluorescence detection after automated derivatisation with xanthydrol, J. Chromatogr. A, 2007, 1161, 207–213 CrossRef CAS.
- X. Hu, N. Takenaka, M. Kitano, H. Bandow, Y. Maeda and M. Hattori, Determination of trace amounts of urea by using flow injection with chemiluminescence detection, Analyst, 1994, 119, 1829–1833 RSC.
- M. Tyagi, M. Tomar and V. Gupta, NiO nanoparticle-based urea biosensor, Biosens. Bioelectron., 2013, 41, 110–115 CrossRef CAS.
- R. Ramesh, P. Puhazhendi, J. Kumar, M. K. Gowthaman, S. F. D'Souza and N. R. Kamini, Potentiometric biensor for determination of urea in milk using immobilized Arthrobacter creatinolyticus urease, Mater. Sci. Eng., C, 2015, 49, 786–792 CrossRef CAS.
- T. M. Pan, M. D. Huang, W. Y. Lin and M. H. Wu, A urea biosensor based on pH-sensitive Sm2TiO5 electrolyte–insulator–semiconductor, Anal. Chim. Acta, 2010, 669, 68–74 CrossRef CAS.
- R. Ahmad, N. Tripathy and Y. B. Hahn, Highly stable urea sensor based on ZnO nanorods directly grown on Ag/glass electrodes, Sens. Actuators, B, 2014, 194, 290–295 CrossRef CAS.
- W. Yan, D. Wang and G. Botte, Electrochemical decomposition of urea with Ni-based catalysts, Appl. Catal., B, 2012, 127, 221–226 CrossRef CAS.
- C. C. Buron, M. Quinart, T. Vrlinic, S. Yunus, K. Glinel, A. M. Jonas and B. Lakard, Application of original assemblies of polyelectrolytes, urease and electrodeposited polyaniline as sensitive films of potentiometric urea biosensors, Electrochim. Acta, 2014, 148, 53–61 CrossRef CAS.
- M. Arain, A. Nafady, Z. H. Ibupoto, S. T. H. Sherazi, T. Shaikh, H. Khan, A. Alsalme, A. Niaz and M. Willander, Simpler and highly sensitive enzyme-free sensing of urea via NiO nanostructures modified electrode, RSC Adv., 2016, 6, 39001–39006 RSC.
- N. S. Nguyen, G. Das and H. H. Yoon, Nickel/cobalt oxide-decorated 3D graphene nanocomposite electrode for enhanced electrochemical detection of urea, Biosens. Bioelectron., 2016, 77, 372–377 CrossRef CAS PubMed.
- R. Sha, K. Komori and S. Badhulika, Graphene–polyaniline composite based ultra-sensitive electrochemical sensor for non-enzymatic detection of urea, Electrochim. Acta, 2017, 233, 44–51 CrossRef CAS.
- W. Yan, D. Wang and G. G. Botte, Nickel and cobalt bimetallic hydroxide catalysts for urea electro-oxidation, Electrochim. Acta, 2012, 61, 25–30 CrossRef CAS.
- S. Hussain, M. A. Muazzam, M. Ahmed, M. Ahmad, Z. Mustafa, S. Murtaza, J. Ali, M. Ibrar, M. Shahid and M. Imran, Green synthesis of nickel oxide nanoparticles using Acacia nilotica leaf extracts and investigation of their electrochemical and biological properties, Journal of Taibah University for Science, 2023, 1, 2170162 CrossRef.
- N. Al-Zaqri, K. Umamakeshvari, V. Mohana, A. Muthuvel and A. Boshaala, Green synthesis of nickel oxide nanoparticles and its photocatalytic degradation and antibacterial activity, J. Mater. Sci.: Mater. Electron., 2022, 15, 11864–11880 CrossRef.
- S. Uddin, L. B. Safdar, S. Anwar, J. Iqbal, S. Laila, B. A. Abbasi, M. S. Saif, M. Ali, A. Rehman, A. Basit and Y. Wang, Green synthesis of nickel oxide nanoparticles from Berberis balochistanica stem for investigating bioactivities, Molecules, 2021, 6, 1548 CrossRef.
- E. R. Ezeigwe, P. S. Khiew, C. W. Siong and M. T. Tan, Synthesis of NiMoO4 nanorods on graphene and superior electrochemical performance of the resulting ternary based composites, Ceram. Int., 2017, 16, 13772–13780 CrossRef.
- A. Abutaleb, Electrochemical oxidation of urea on NiCu alloy nanoparticles decorated carbon nanofibers, Catalysts, 2019, 9, 397 CrossRef.
- M. Yang, Q. Bai and C. Ding, NiMoO4 nanoparticles embedded in nanoporous carbon nanosheets derived from peanut shells: efficient electrocatalysts for urea oxidation, Colloids Surf., A, 2020, 604, 125276 CrossRef CAS.
- T. S. K. Naik, S. Saravanan, K. S. Saravana, U. Pratiush and P. C. Ramamurthy, A non-enzymatic urea sensor based on the nickel sulfide/graphene oxide modified glassy carbon electrode, Mater. Chem. Phys., 2020, 245, 122798 CrossRef.
- M. Arain, A. Nafady, Z. H. Ibupoto, S. T. H. Sherazi, T. Shaikh, H. Khan, A. Alsalme, A. Niaz and M. Willander, Simpler and highly sensitive enzyme-free sensing of urea via NiO nanostructures modified electrode, RSC Adv., 2016, 45, 39001–39006 RSC.
- N. Salarizadeh, M. Habibi-Rezaei and S. J. Zargar, NiO–MoO3 nanocomposite: a sensitive non-enzymatic sensor for glucose and urea monitoring, Mater. Chem. Phys., 2022, 281, 125870 CrossRef CAS.
- C. Bao, Q. Niu, Z. A. Chen, X. Cao, H. Wang and W. Lu, Ultrathin nickel-metal–organic framework nanobelt based electrochemical sensor for the determination of urea in human body fluids, RSC Adv., 2019, 50, 29474–29481 RSC.
- M. Arain, A. Nafady, Z. H. Ibupoto, S. T. H. Sherazi, T. Shaikh, H. Khan, A. Alsalme, A. Niaz and M. Willander, Simpler and highly sensitive enzyme-free sensing of urea via NiO nanostructures modified electrode, RSC Adv., 2016, 45, 39001–39006 RSC.
- R. Sha, K. Komori and S. Badhulika, Graphene–polyaniline composite based ultra-sensitive electrochemical sensor for non-enzymatic detection of urea, Electrochim. Acta, 2017, 233, 44–51 CrossRef CAS.
- N. S. Nguyen, G. Das and H. H. Yoon, Nickel/cobalt oxide-decorated 3D graphene nanocomposite electrode for enhanced electrochemical detection of urea, Biosens. Bioelectron., 2016, 77, 372–377 CrossRef CAS.
- N. S. Nguyen and H. H. Yoon, Nickel oxide-deposited cellulose/CNT composite electrode for non-enzymatic urea detection, Sens. Actuators, B, 2016, 236, 304–310 CrossRef CAS.
- V. Kumar, I. Kaur, S. Arora, R. Mehla, K. Vellingiri and K. H. Kim, Graphene nanoplatelet/graphitized nanodiamond-based nanocomposite for mediator-free electrochemical sensing of urea, Food Chem., 2020, 303, 125375 CrossRef CAS.
- A. G. Anil, T. S. K. Naik, S. Subramanian and P. C. Ramamurthy, A novel non-enzymatic urea sensor based on the nickel complex of a benzimidazoyl pyridine derivative, J. Electroanal. Chem., 2021, 883, 115062 CrossRef CAS.
- S. R. Mishra, V. Gadore, R. Verma, K. R. Singh, J. Singh and M. Ahmaruzzaman, In2S3 incorporated into CO32−@Ni/Fe/Zn
trimetallic LDH as a bi-functional novel nanomaterial for enzymatic urea sensing and removal of sulfur-containing pharmaceutical from aqueous streams, Chem. Eng. J., 2023, 146207 CrossRef CAS.
- S. N. Ashakirin, M. A. S. M. Haniff, M. H. M. Zaid, M. F. M. Razipwee and E. Mahmoudi, Urease immobilized electrodeposited silver reduce graphene oxide modified screen-printed carbon electrode for highly urea detection, Measurement, 2022, 196, 111058 CrossRef.
- R. Wahab, F. Khan, M. Alam, J. Ahmad and A. A. Al-Khedhairy, Aluminum oxide quantum dots (Al2O3): an immediate sensing aptitude for the detection of urea, Inorg. Chem. Commun., 2023, 147, 110238 CrossRef CAS.
- P. Puech, M. Kandara, G. Paredes, L. Moulin, E. Weiss-Hortala, A. Kundu, N. Ratel-Ramond, J. M. Plewa, R. Pellenq and M. Monthioux, Analyzing the Raman spectra of graphenic carbon materials from kerogens to nanotubes: what type of information can be extracted from defect bands?, C, 2019, 5, 69 CAS.
- V. Kumar, I. Kaur, S. Arora, R. Mehla, K. Vellingiri and K. H. Kim, Graphene nanoplatelet/graphitized nanodiamond-based nanocomposite for mediator-free electrochemical sensing of urea, Food Chem., 2020, 303, 125375 CrossRef CAS.
|
| This journal is © The Royal Society of Chemistry 2023 |
Click here to see how this site uses Cookies. View our privacy policy here. 
 Open Access Article
 This Open Access Article is licensed under a Creative Commons Attribution-Non Commercial 3.0 Unported Licence
 g,
Ayman Nafadyf,
Riyadh H. Alshammarif,
Brigitte Vigolo
g,
Ayman Nafadyf,
Riyadh H. Alshammarif,
Brigitte Vigolo