 Open Access Article
Solution-gel-based surface modification of LiNi0.5Mn1.5O4−δ with amorphous Li–Ti–O coating†
Fulya Ulu Okudur *a,
Maria Batuk
 b,
Joke Hadermann
 b,
Mohammadhosein Safaric,
Dries De Sloovere
 a,
Satish Kumar Mylavarapua,
Bjorn Joosa,
Jan D'Haend,
Marlies K. Van Bael
 a and
An Hardya
aHasselt University, Institute for Materials Research (imo-imomec) and imec division imomec, Design and Synthesis of Inorganic Materials, Agoralaan, EnergyVille 2, Thor Park 8320, 3600 Genk, 3590 Diepenbeek, Belgium. E-mail: fulya.uluokudur@imec.be; satishkumar.mylavarapu@uhasselt.be; bjorn.joos@uhasselt.be; dries.desloovere@uhasselt.be; marlies.vanbael@uhasselt.be; an.hardy@uhasselt.be
bEMAT, University of Antwerp, Groenenborgerlaan 171, B-2020 Belgium. E-mail: maria.batuk@uantwerpen.be; joke.hadermann@uantwerpen.be
cHasselt University, Institute for Materials Research (imo-imomec) and imec division imomec, Agoralaan, EnergyVille 2, Thor Park 8320, 3600 Genk, 3590 Diepenbeek, Belgium. E-mail: momo.safari@uhasselt.be
dHasselt University, Institute for Materials Research (imo-imomec) and imec division imomec, Materials Physics, Wetenschapspark 1, 3590 Diepenbeek, Belgium. E-mail: jan.dhaen@uhasselt.be
First published on 9th November 2023
Abstract
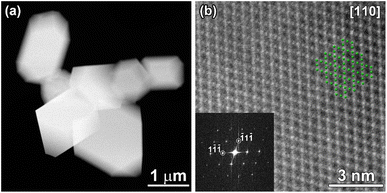
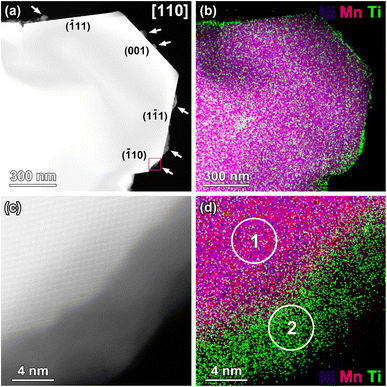
LNMO (LiNi0.5Mn1.5O4−δ) is a high-energy density positive electrode material for lithium ion batteries. Unfortunately, it suffers from capacity loss and impedance rise during cycling due to electrolyte oxidation and electrode/electrolyte interface instabilities at high operating voltages. Here, a solution-gel synthesis route was used to coat 0.5–2.5 μm LNMO particles with amorphous Li–Ti–O (LTO) for improved Li conduction, surface structural stability and cyclability. High-angle annular dark-field scanning transmission electron microscopy (HAADF-STEM) analysis coupled with energy dispersive X-ray (EDX) showed Ti-rich amorphous coatings/islands or Ti-rich spinel layers on many of the LTO-modified LNMO facets, with a thickness varying from about 1 to 10 nm. The surface modification in the form of amorphous islands was mostly possible on high-energy crystal facets. Physicochemical observations were used to propose a molecular mechanism for the surface modification, combining insights from metalorganic chemistry with the crystallographic properties of LNMO. The improvements in functional properties were investigated in half cells. The cell impedance increased faster for the bare LNMO compared to amorphous LTO modified LNMO, resulting in Rct values as high as 1247 Ω (after 1000 cycles) for bare LNMO, against 216 Ω for the modified material. At 10C, the modified material boosted a 15% increase in average discharge capacity. The improvements in electrochemical performance were attributed to the increase in electrochemically active surface area, as well as to improved HF-scavenging, resulting in the formation of protective byproducts, generating a more stable interface during prolonged cycling.
Introduction
High energy density batteries, requiring positive electrode materials with high specific capacity and operating voltage, are in demand for electric vehicle applications. However, chemical, electrochemical or thermal instabilities are often encountered with such materials, as parasitic reactions occur between the active material and liquid electrolyte at higher voltages.1 LNMO (LiNi0.5Mn1.5O4−δ) is a high voltage (4.7 V vs. Li2) LIB (lithium ion battery) positive electrode material. LNMO electrodes operate outside the stability window of conventional liquid electrolytes (e.g. LiPF6 dissolved in organic carbonates). Carbonate species are electrochemically oxidized on the LNMO surface at high voltages (>4.4 V vs. Li3,4). The reactive, oxidized carbonate species, evolved gases, trace amounts of moisture in the battery electrolyte or high temperatures cause continuous LiPF6 decomposition.5,6 This leads to the formation of HF and the related dissolution (corrosion) of transition metals (TM). This could lead to structural reconstruction at the surface, variations in the cathode-electrolyte interphase (CEI) layer composition and stability, impedance rise, and capacity loss.4,7 As a result of the electrolyte decomposition, Li ions are partly incorporated into organic and inorganic products such as Li2CO3, Li2O, alkoxides, ethers, LiF, LixPOyFz and deposited at the cathode surface.2 The thickness of the non-conducting8,9 CEI layer gradually increases with cycling, causing a increase in impedance and capacity fade, especially at higher temperatures.8,10–12 The CEI layer stabilizes with repeated cycling, suppressing TM dissolution and structural reconstruction to some extent. However, the in situ formed CEI layer cannot entirely terminate the undesired electrode–electrolyte interactions, leading to cyclability issues.7 Methods to improve cyclability include the use of electrolyte solvents or salts that are stable at high voltages, coating the powder13 or electrode surfaces14,15 for physical protection against cathode-electrolyte reactions and TM ion migration, enhancing the cathode surface and CEI layer stability by surface doping1,11,16–19 and introducing HF scavenging materials.6,7,13,20,21Coating the LNMO surface with an HF scavenging material delays the occurrence of corrosion. The coating material reacts with HF whereby it is slowly consumed.13 The insoluble byproducts such as metal fluorides contribute to the CEI layer and mitigate further corrosion. For instance, AlF3 coating on Li[Li0.2Mn0.54Ni0.13Co0.13]O2 acted as a buffer layer to mitigate oxygen release from the cathode and reduce electrolyte decomposition at high voltages.6 Unlike the physical barrier coating approach, complete coverage or uniformity are not required with the HF scavenging approach.13 The electrochemical performance of LiCoO2 (LCO) cathodes was shown to improve by mixing HF scavenging YPO4 or Al2O3 nanoparticles in the electrolyte or in the active material powder. The electrolyte acidity increased after YPO4/Al2O3 – electrolyte contact, washing out the surface impurities such as Li2CO3 and LiOH, and TM ions from the LCO surface. Alien metal ions migrated into the vacancies, forming a structurally more stable solid-solution layer on the LCO surface (e.g. LixAlzCoyO2) during the first cycle. Even though more electrolyte decomposition was triggered by the YPO4 or Al2O3 materials, byproducts such as the AlF3/Al2O3 solid superacid or Li3AlF6 solid solution improved the ionic conductivity of the CEI layer.20,21
Here, we use a metalorganic solution-gel synthesis route to modify LNMO powder surfaces with amorphous Li–Ti–O (LTO). The goal is not only to improve the Li conduction compared to the crystalline Li4Ti5O12 coatings, but also to improve the surface structural stability, cyclability, and rate performance during long-term cycling at high voltages. We compare the (physico)chemical and electrochemical properties of bare, amorphous and crystalline LTO coated LNMO powders. We propose a molecular mechanism for the surface modification process, where TM ions partly dissolve due to interactions with the metalorganic complexes of the precursor solution. The resulting vacancies can be subsequently filled by Ti4+ carboxylate complexes, forming Ti-doped spinel surface layers on the LNMO particles. Electrochemically, the surface modification process mitigated the increase in charge transfer resistance during electrochemical operation, leading to an increased cycle life and to an improved capacity at 10C.
Experimental
LNMO synthesis
LNMO powder was synthesized via a citric acid based solution-gel synthesis route.22 Aqueous 104 mM LiCH3COO·2H2O (Sigma Aldrich, reagent grade, 6108-17-4), 50 mM Ni(CH3COO)2·4H2O (Sigma Aldrich, 98%, 6018-89-9) and 150 mM Mn(CH3COO)2·4H2O (Sigma Aldrich, 99%, 6156-78-1) solutions were prepared and their concentrations were measured with inductively coupled plasma atomic emission spectroscopy (ICP-AES). Li, Ni, Mn aqueous precursor solutions and 1000 ppm Li, Ni, Mn standards were diluted by 5% HNO3 (JT Baker, for trace metal analysis) to 1–10 ppm interval for ICP-AES measurements. Stoichiometric volumes of Li, Ni and Mn stock solutions were mixed and heated to 50 °C. A 4 mM excess lithium was used to compensate for Li losses during high temperature anneals. 5 grams of anhydrous citric acid (Sigma Aldrich, 99%, 77-92-9) was dissolved in 10 mL water in 1![[thin space (1/6-em)]](https://www.rsc.org/images/entities/char_2009.gif) :
:![[thin space (1/6-em)]](https://www.rsc.org/images/entities/char_2009.gif) 1 total metal ion to anhydrous citric acid mole ratio and slowly added into the Li–Ni–Mn solution with strong agitation. The pH was fixed to 7 at room temperature with NH3 (25 wt%, Merck, EMSURE). The precursor solution was refluxed at 85 °C for 4 h followed by the removal of water and NH3 at 80 °C in a forced convection oven (Binder APT.Line M, fan-assisted) for ∼15 h, resulting in a homogeneous, green, transparent gel. The precursor gel was calcined at 200 °C for 40 h in the forced convection oven for organics removal, resulting in a large volume, foam-like precursor powder. The precursor powder was ball milled at 300 rpm for 10 minutes. A high temperature crystallization was performed in a tube furnace at 900 °C for 10 hours under dry air flow (AirLiquide, Alphagaz 1, 0.4 L min−1), with 5 °C min−1 heating rate and furnace cooling. A second anneal at 500 °C was made when indicated for 3 h in dry air, with 10 °C min−1 heating rate and furnace cooling.
1 total metal ion to anhydrous citric acid mole ratio and slowly added into the Li–Ni–Mn solution with strong agitation. The pH was fixed to 7 at room temperature with NH3 (25 wt%, Merck, EMSURE). The precursor solution was refluxed at 85 °C for 4 h followed by the removal of water and NH3 at 80 °C in a forced convection oven (Binder APT.Line M, fan-assisted) for ∼15 h, resulting in a homogeneous, green, transparent gel. The precursor gel was calcined at 200 °C for 40 h in the forced convection oven for organics removal, resulting in a large volume, foam-like precursor powder. The precursor powder was ball milled at 300 rpm for 10 minutes. A high temperature crystallization was performed in a tube furnace at 900 °C for 10 hours under dry air flow (AirLiquide, Alphagaz 1, 0.4 L min−1), with 5 °C min−1 heating rate and furnace cooling. A second anneal at 500 °C was made when indicated for 3 h in dry air, with 10 °C min−1 heating rate and furnace cooling.
| Powder name | Powder description | Coated material | Heat treatment 1 | Heat treatment 2 | Heat treatment 3 | Heat treatment 4 |
|---|---|---|---|---|---|---|
| LNMO | Bare LiNi0.5Mn1.5O4−δ | NA | 80 °C, ∼15 h | 200 °C, 40 h | 900 °C, 10 h in dry air | — |
| LNMO-500 °C | Bare LNMO after 500 °C anneal | NA | 80 °C, ∼15 h | 200 °C, 40 h | 900 °C, 10 h in dry air | 500 °C, 3 h in dry air |
| LNMO@LTO-80 °C | Amorphous LTO surface modified LNMO prec. gel | LNMO | 80 °C, ∼15 h | — | — | — |
| LNMO@LTO-200 °C | Amorp. LTO surface modified LNMO | LNMO | 80 °C, ∼15 h | 200 °C, 2 h | — | — |
| LNMO@LTO-500 °C | Amorp. LTO surface modified LNMO after 500 °C anneal | LNMO | 80 °C, ∼15 h | 200 °C, 2 h | — | 500 °C, 3 h in dry air |
| LTO-500 °C | LTO surface modification material | NA | 80 °C, ∼15 h | 200 °C, 2 h | — | 500 °C, 3 h in dry air |
0.2 g, 900 °C heat treated, crystalline LNMO powder was dispersed in 150 mL DI water. The dispersion was pulse sonicated with a probe sonicator (Branson 254–450 Sonifier) for 30 seconds (output 50, power 9). pH of the dispersion was ∼7.5. A volume of 4.4 mL, 1 mM LTO precursor solution was added dropwise into the aqueous LNMO dispersion while stirring, using an autotitrator at a 1.75 mL h−1 dropping rate and 2.5 h dropping time to obtain 1 wt% LTO loading on LNMO. Once the addition is complete, the dispersion was dried overnight in a forced convection oven (Binder APT.Line M, fan-assisted) at 80 °C. The black colored LNMO@LTO-80 °C precursor gel was further heated to 200 °C for 2 h in the forced convection oven, resulting in amorphous LTO surface modified LNMO powders (LNMO@LTO-200 °C). For crystallization of LTO, a further 500 °C, 3 h thermal treatment was made in dry air (DA) flow, with 10 °C min−1 heating rate, and was cooled down while the powder was still inside the furnace (LNMO@LTO-500 °C). The same thermal treatment was also applied on bare LNMO (LNMO-500 °C), and bare LTO (LTO-500 °C) for comparison. Table 1 summarizes the thermal treatment steps involved in bare and surface modified LNMO and LTO powders preparation.
![[thin space (1/6-em)]](https://www.rsc.org/images/entities/char_2009.gif) 000 rpm, 1.5 h) for ICP-AES analysis using a Sc internal standard. Mn dissolution from bare and LTO surface modified LNMO powders (LNMO-500 °C, LNMO@LTO-200 °C and LNMO@LTO-500 °C) when in contact with 1.0 M LiPF6 in ethylene carbonate/diethyl carbonate (EC/DEC, 1
000 rpm, 1.5 h) for ICP-AES analysis using a Sc internal standard. Mn dissolution from bare and LTO surface modified LNMO powders (LNMO-500 °C, LNMO@LTO-200 °C and LNMO@LTO-500 °C) when in contact with 1.0 M LiPF6 in ethylene carbonate/diethyl carbonate (EC/DEC, 1![[thin space (1/6-em)]](https://www.rsc.org/images/entities/char_2009.gif) :
:![[thin space (1/6-em)]](https://www.rsc.org/images/entities/char_2009.gif) 1, v/v) battery electrolyte were also examined through ICP-AES measurements. Samples of 100 mg were dispersed in 10 mL of 1.0 M LiPF6 EC/DEC (1
1, v/v) battery electrolyte were also examined through ICP-AES measurements. Samples of 100 mg were dispersed in 10 mL of 1.0 M LiPF6 EC/DEC (1![[thin space (1/6-em)]](https://www.rsc.org/images/entities/char_2009.gif) :
:![[thin space (1/6-em)]](https://www.rsc.org/images/entities/char_2009.gif) 1, v/v) battery electrolyte and stirred within a glovebox for 85 days. Sample electrolytes of 2.5 mL were collected after 70 and 85 days and filtered (PALL 0.2 μm syringe filter) after allowing powders to settle for six days. The electrolytes were centrifuged (12
1, v/v) battery electrolyte and stirred within a glovebox for 85 days. Sample electrolytes of 2.5 mL were collected after 70 and 85 days and filtered (PALL 0.2 μm syringe filter) after allowing powders to settle for six days. The electrolytes were centrifuged (12![[thin space (1/6-em)]](https://www.rsc.org/images/entities/char_2009.gif) 000 rpm, 1.5 h), 1 mL of the centrifuged electrolyte was collected and evaporated at 80 °C overnight, followed by the addition of 5 mL, 5% HNO3, 30 min of sonication and a final filtering. The Mn concentrations of the resulting solutions were determined with ICP-AES using a Sc internal standard.
000 rpm, 1.5 h), 1 mL of the centrifuged electrolyte was collected and evaporated at 80 °C overnight, followed by the addition of 5 mL, 5% HNO3, 30 min of sonication and a final filtering. The Mn concentrations of the resulting solutions were determined with ICP-AES using a Sc internal standard.| Electrode name | Active material used | Avg. LNMO active material loading (mg cm−2) | Avg. dry coating thicknessa (μm) | Avg. electrode densityb (g cm−3) | Avg. electrode porosity (%) |
|---|---|---|---|---|---|
| a Excluding Al foil thickness of ∼16 μm.b Disc weight without Al foil divided by disc volume (thickness × disc surface area). | |||||
| LNMO-el. | LNMO | 2.2 | 18 | 1.5 | 58 |
| LNMO-500 °C-el. | LNMO-500 °C | 2.1 | 16 | 1.7 | 51 |
| LNMO@LTO-200 °C-el. | LNMO@LTO-200 °C | 2.0 | 16 | 1.5 | 56 |
| LNMO@LTO-500 °C-el. | LNMO@LTO-500 °C | 2.0 | 15 | 1.6 | 54 |
A summary of all the sample codes used to describe the powders and electrodes is provided in Table S5.†
Coin cell preparation and electrochemical characterization
LNMO|Li coin cells were assembled in an argon filled glovebox (Sylatech, O2 < 0.6ppm, H2O < 0.1 ppm) with bare or surface modified LNMO working electrode, Celgard 2400 PP separator and 1.0 M LiPF6 EC/DEC (1![[thin space (1/6-em)]](https://www.rsc.org/images/entities/char_2009.gif) :
:![[thin space (1/6-em)]](https://www.rsc.org/images/entities/char_2009.gif) 1, v/v) electrolyte (Soulbrain). Freshly assembled coin cells underwent cyclic voltammetry (CV, 3.4–4.9 V vs. Li+/Li, 0.1 mV s−1 scan rate) after a 24 h resting period. Afterwards, the cells were cycled at 0.05C in constant current–constant voltage (CC–CV) mode. The constant voltage step at 4.9 V was applied for 30 minutes, the constant voltage step at 3.4 V was applied until the measured current is less than 10% of the initial value.27,28 This was followed by rate performance measurements at C-rates from 0.1C to 10C in CC–CV mode (4.9 V constant voltage steps until the measured current was less than 10% of the initial value) at room temperature. Cyclic stability tests were measured after an initial 0.05C cycle at 5C, in CC–CV mode, with impedance measurements in between cycles, measured after 1 h relaxation time, from 10 kHz to 10 mHz at fully discharged state.
1, v/v) electrolyte (Soulbrain). Freshly assembled coin cells underwent cyclic voltammetry (CV, 3.4–4.9 V vs. Li+/Li, 0.1 mV s−1 scan rate) after a 24 h resting period. Afterwards, the cells were cycled at 0.05C in constant current–constant voltage (CC–CV) mode. The constant voltage step at 4.9 V was applied for 30 minutes, the constant voltage step at 3.4 V was applied until the measured current is less than 10% of the initial value.27,28 This was followed by rate performance measurements at C-rates from 0.1C to 10C in CC–CV mode (4.9 V constant voltage steps until the measured current was less than 10% of the initial value) at room temperature. Cyclic stability tests were measured after an initial 0.05C cycle at 5C, in CC–CV mode, with impedance measurements in between cycles, measured after 1 h relaxation time, from 10 kHz to 10 mHz at fully discharged state.
Results and discussion
Material properties of bare and LTO surface modified LNMO
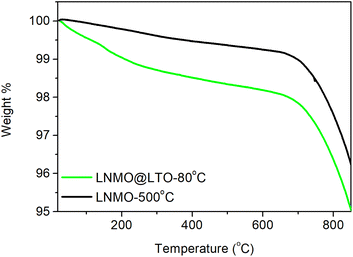
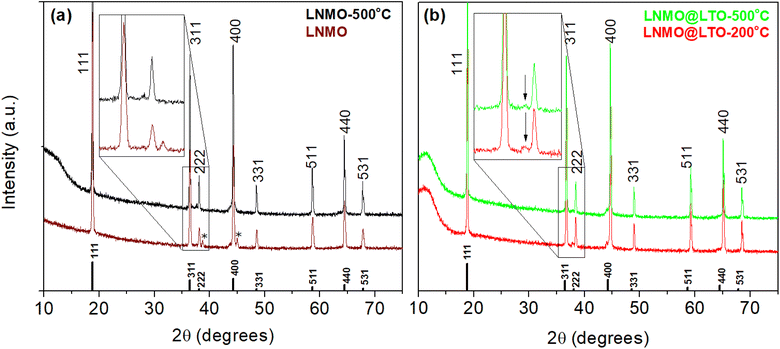
Thermogravimetric analysis was performed on LNMO-500 °C and LNMO@LTO-80 °C, as in Fig. 1. A weight loss region was observed for both samples above 700 °C, which could be attributed to the oxygen evolution reaction from the LNMO crystal structure.29 A thermal processing step at 200 °C was applied to the materials, to reduce the amount of uncomplexed ammonium carboxylates in the LNMO@LTO-80 °C precursor gel.24 A subsequent anneal at 500 °C was performed for crystallization of the surface modified material without oxygen loss from the LNMO crystal structure.The powder XRD diffractograms of bare and LTO surface modified LNMO are similar, as shown in Fig. 2. Cubic spinel LiNi0.5Mn1.5O4−δ (JCPDS/ICDD 01-80-2162) phase peaks are observed. A rock-salt Li0.4Ni1.6O2 (JCPDS/ICDD 01-081-95) impurity phase peak can also be observed at 37.6°, as indicated by the vertical arrows in Fig. 2, for all the bare and surface modified LNMO samples, formed due to oxygen evolution during the high temperature anneal.30 Oxygen evolution causes oxygen vacancies formation, increases the concentration of the larger Mn3+ cations compared to Mn4+ and increases the concentration of the rock-salt impurity phase.30 The intensity of the rock-salt impurity phase peak is larger for the LNMO@LTO-200 °C sample compared to its bare counterpart. This might indicate an increase in Mn3+ concentration during the surface modification process.
A separate LTO phase was not observed in any of the surface modified LNMO samples which could be due to the amorphous nature of the coating layer in LNMO@LTO-200 °C or to a small amount of scattering from the surface compared to the core particle for LNMO@LTO-500 °C, which is below the detection limit of XRD. The powder XRD diffractograms were refined to calculate the lattice parameters for LNMO (see Fig. S2 and Tables S1, S2†). The calculated lattice parameters showed no significant variation after surface modification compared to each other.
Morphology, particle size and elemental distribution of bare and LTO surface modified LNMO powders
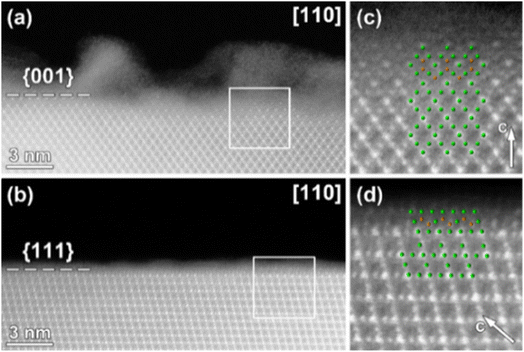
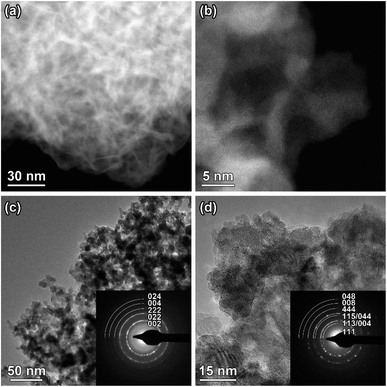
The Ti-rich surface layer was not observed on all of the LNMO crystal facets as shown in Fig. 5. Based on the analysis of several crystals, {001} surfaces were always covered by a Ti-rich surface layer, whereas {110} and {111} surfaces were either covered or free from any surface layer. A selective surface modification of the spinel LiNi0.5Mn1.5O4 by Ti cations or by an amorphous phase as in our case was not yet experimentally demonstrated. The preferential coating of {001} surfaces with the amorphous LTO compared to {110} and {111} surfaces could be related to variations in surface energies. LNMO {001} surfaces have a relatively higher surface energy compared to others,12,31 probably enabling easier coordination by carboxylate groups and Ti cations.
Surface modification mechanism discussion
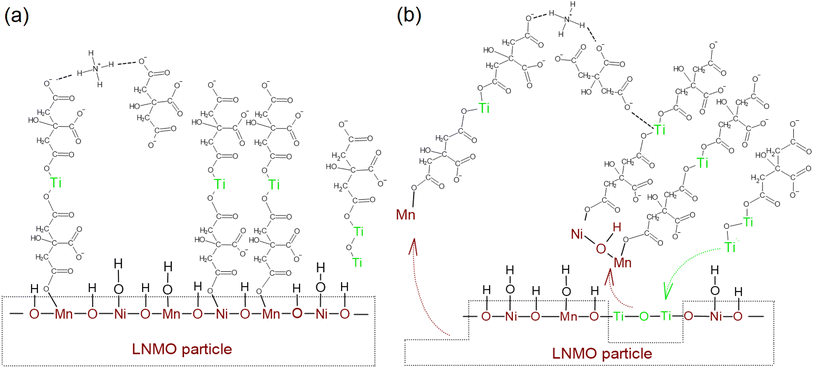
LTO surface modification of LNMO results in a Ti-rich surface layer on most of the LNMO particles, either in the form of an amorphous coating/islands or in the form of Ti-doped spinel surfaces. Amorphous nanoparticles containing Ti, Ni and Mn also form during the surface modification. Amatucci et al. hypothesized that acetylacetonate usage complexes the uncoordinated Mn cations of the spinel LiMn2O4 surface and hence deactivates the LiMn2O4 surface active sites which act as the basis for electrolyte oxidation reactions during electrochemical cycling.32 Similarly, we hypothesize that the LNMO surface metal ions are coordinated by carboxylate groups and are cross-linked to other metal carboxylate complexes via ionic or hydrogen bridges formed by ammonium cations. The carboxylate groups form ionic bridges with other metal centers as well,33 leading to a cross-linked gel structure as schematically shown in Fig. 7.ICP-AES analysis was performed on both water and LTO precursor solutions containing LNMO powder, aged for one month. These measurements indicated that the Mn dissolution in water was close to zero, while 12.1 ppm Mn was detected in the LTO precursor solution after one month of aging. This indicates that LNMO surfaces may partly dissolve into the LTO precursor solution during the surface modification process, probably due to interactions with the citric acid. This partial oxide dissolution could be related to proton transfer from carboxylate groups to the LNMO surface oxides during coordination: LNMO surface metal ion oxidation states are reduced by protonation, leading to weakening of the Mn–O and Ni–O bonds which may facilitate Mn and Ni ions leaching into the water as carboxylate complexes.34,35 Part of the Ti4+ carboxylate complexes then might fill in the empty Mn and Ni sites on LNMO crystal surface, resulting in Ti-doped spinel surfaces on LNMO particles, as schematically shown in Fig. 7b. Other Ti4+ carboxylate complexes might form ionic bridges with the dissolved Mn and Ni complexes and precipitate during the water removal step as Ti–Ni–Mn–O containing nanoparticles or form a precursor gel that transforms into the same nanoparticles upon heating. During the 200 °C thermal treatment step, the ammonium carboxylate bonds are probably partially broken, resulting in ammonia and carboxylic acid, which evaporate or decompose further while direct coordination of the metal ions remain intact.36,50–52
Electrochemical properties of LTO surface modified LNMO
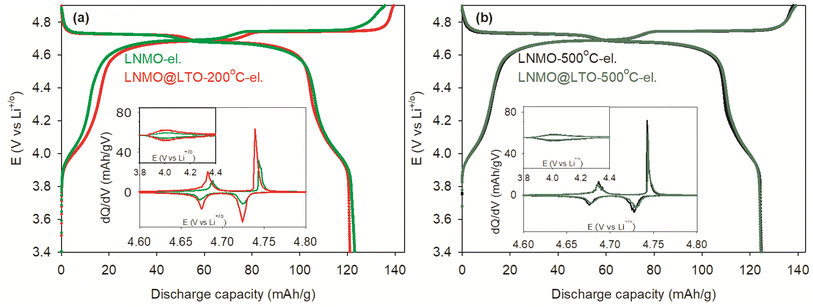
Fig. 8 shows the initial charge/discharge curves for the bare (LNMO-el., LNMO-500 °C-el.) and LTO surface modified (LNMO@LTO-200 °C-el., LNMO@LTO-500 °C-el.) LNMO electrodes at 0.05C.The amorphous LTO coating slightly reduced the initial discharge capacity compared to the bare LNMO electrode, as indicated in Fig. 8a. The reduced initial discharge capacity might be due to Mn, Ni or Li cations loss from the LNMO particle surfaces during the surface modification process.
Capacity storage is centered in the 4.0 and 4.7 V regions where the Mn3+ to Mn4+ and Ni2+ to Ni4+ oxidation reactions take place, respectively. The dQ/dV plots in the Fig. 8 insets were obtained from the corresponding capacity curves. The two major peaks within the 4.65 to 4.75 V region represent the Ni2+ to Ni3+ and Ni3+ to Ni4+ oxidation reactions during charging of the bare and surface modified LNMO samples. The relatively smaller dQ/dV peaks in the 3.8 to 4.4 V region on the other hand represent the Mn3+ to Mn4+ oxidation reaction during charging. LNMO@LTO-200 °C-el. has a more intense Mn3+ to Mn4+ dQ/dV peak compared to the bare LNMO-el., as shown in Fig. 8a inset. On the other hand, electrodes of bare and surface modified LNMO samples with a 500 °C anneal have similar Mn3/4+ dQ/dV peak intensities (Fig. 8b). Based on the dQ/dV plots, the Mn3+ concentration increases with amorphous LTO surface modification of LNMO. An optimum amount of Mn3+ in LNMO was reported to improve the electrochemical performance, especially at high rates, due to an increase of bulk ionic and electronic conductivities.37
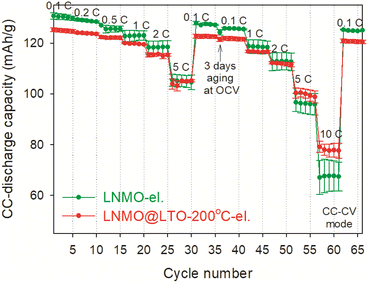
Rate performance measurements were performed for LNMO-el. and LNMO@LTO-200 °C-el. at constant current-constant voltage (CC–CV) mode, and shown in Fig. 9. The amorphous LTO coating caused initial capacity loss at 0.1C compared to bare LNMO electrode. However, the LNMO@LTO-200 °C-el. showed about 15% higher average discharge capacity at 10C compared to bare LNMO-el.
So far, amorphous LTO surface modified LNMO@LTO-200 °C-el. was shown to store more capacity in the Mn3+/4+ redox couple region while its crystalline counterparts provided similar capacities in the Mn3+/4+ region. Also, LNMO@LTO-200 °C-el. had a higher capacity at 10C than bare LNMO-el. From this point onwards, possible reasons for the improved capacity at 10C with amorphous LTO surface modification are investigated.
Increased bulk LNMO powder or electrode ionic and electronic conductivities can improve the rate performance.38 Amongst the factors affecting the powder/electrode ionic/electronic conductivities are the amount and distribution of the conductive additives and organic binder, affecting the electrode porosity and electrolyte penetration. Active material morphology, particle size and intrinsic properties also affect the Li diffusion, as well as the electrode–electrolyte interfacial surface area and cathode-electrolyte interphase layer thickness/composition.39 Electronic conductivity measurements, SEM analysis of the electrode cross-sections and impedance measurements were performed to better understand the reasons behind the rate performance behaviour of our electrodes.
Electrical conductivity measurements were performed on bare and LTO surface modified LNMO powders (Table S3†). LNMO@LTO-200 °C and LNMO@LTO-500 °C powders have similar electrical conductivities, which are lower compared to their bare counterparts, LNMO and LNMO-500 °C. The electrical conductivity of 500 °C annealed LTO surface modification material (LTO-500 °C) was also measured, resulting in the lowest conductivity value compared to bare or surface modifed LNMO powders (Table S3†). The lower intrinsic conductivity of the LTO layer probably reduced the LNMO electrical conductivity after the surface modification step. Electrical conductivity measurements were also performed on LNMO-el. and LNMO@LTO-200 °C-el. composite electrodes using conductive AFM (C-AFM) (Fig. S11 and S12†). The measured average current was lower for LNMO@LTO-200 °C-el. compared to LNMO-el., consistent with the powder conductivity measurements. This is ascribed to the lower electrical conductivity of the amorphous LTO modified surface. Based on these results, the 10C rate improvement of LNMO after amorphous LTO surface modification could not be linked to an increase in electrical conductivity.
The microstructure within the electrode was studied using SEM as shown in Fig. S13.† Cross-section SEM images of bare and LTO surface modified composite electrodes of similar thicknesses demonstrate that active material, binder and carbon black particles distribution were similar, providing similar electrode morphologies. This rules out electrode morphology as a cause for the difference in rate performance as well.
Cyclic voltammetry measurements with increasing scan rates from 0.1 to 0.8 mV s−1 were performed after an initial 0.05 C-rate cycle (Fig. S14†), to calculate the solid-state Li+ diffusivities (DLi) in LNMO and LTO surface modified LNMO powders. The DLi values of bare LNMO powders were slightly lowered after surface modification (Table S4†), which could be caused by partially impeded Li+ transport at the LNMO powder surfaces by the Ti ions. Based on the calculated DLi values, the rate performance improvement after amorphous LTO surface modification could not be linked to an intrinsic property change in bulk LNMO powder, such as the increase in Mn3+ concentration.
BET measurements were performed to compare the surface areas of the bare and LTO surface modified LNMO powders with results shown in Table 3. A significant increase in surface area was observed for the surface modified LNMO compared to bare LNMO, especially for the amorphous LTO surface modified powder (LNMO@LTO-200 °C). The increase could be due to the formation of amorphous or crystalline nanoparticles containing Ti, Ni and Mn during the surface modification as well as to changes in LNMO surface morphology by the etching of the citrate precursors during the surface modification. The higher surface area available in the electrode offers more active sites for the charge transfer at the electrode/electrolyte interfaces and as such, decreases the effective current density in the electrode, leading to lower polarization and improved capacity at 10C.40
| Sample number | Sample name | Annealing conditions | BET surface area (±10%, m2 g−1) |
|---|---|---|---|
| 1 | LNMO | No 500 °C anneal | 1.2 |
| 2 | LNMO@LTO-200 °C | No 500 °C anneal | 5.1 |
| 3 | LNMO-500 °C | 500 °C, 3 h, dry air | 0.9 |
| 4 | LNMO@LTO-500 °C | 500 °C, 3 h, dry air | 2.5 |
The cathode-electrolyte interphase layer thickness/composition during cycling could also affect the electrode conductivities and rate performances. For this reason, long-term cyclic stability measurements were performed for bare and surface modified LNMO at room temperature with intermittent impedance measurements to examine the evolution of interfacial resistance during cycling (Fig. 10). A straight line and two depressed semi-circular arcs were observed in the Nyquist plots. The straight line is attributed to the solid-state Li diffusion in the active material particles. The high frequency semi-circle is generally attributed to the Li diffusion resistance at the CEI film (Rf)7,41,42 or to the electrical contact resistance between the active material and current collector43,44 while the medium-low frequency semi-circle is attributed to the charge transfer resistance (Rct) against Li+ intercalation/deintercalation at the electrode surface.7,42,45 The experimental data were fitted against an equivalent circuit (Fig. 10e).
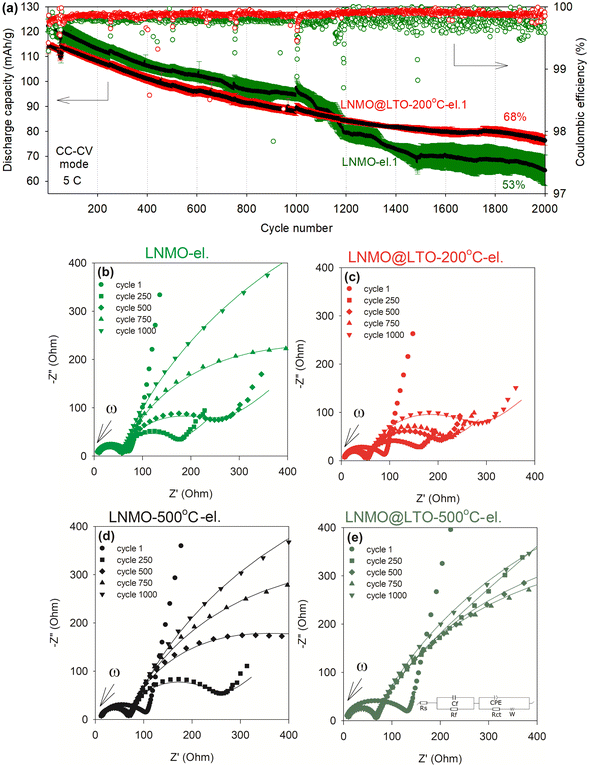 | ||
| Fig. 10 (a) Cyclic stability at 5C (following the 0.05C cycle 1), in CC–CV (CV at 4.9 V until the measured current is less than 10% of the initial value, no CV at 3.4 V), average coulombic efficiency, and impedance measurements of (b) bare LNMO-el. (black average discharge capacity data with green error bars) and (c) LNMO@LTO-200 °C-el. (black average discharge capacity data with red error bars), measured after the indicated cycles in (a). Impedance measurements for (d) bare LNMO-500 °C-el. and (e) LNMO@LTO-500 °C-el., measured in between cycles shown in Fig. S15.† Discharge capacities and error bars indicate average values (shown with black color) and standard deviations (shown with red and green colors), respectively, of three different coin cells for each material. | ||
Amorphous LTO surface modification reduced the initial discharge capacity by ∼10 mA h g−1 at 5C and increased the cell impedance measured after the 1st cycle. However, with increasing cycle number, the cell impedance increased more rapidly for the bare LNMO-el. compared to LNMO@LTO-200 °C-el., resulting in Rct values of 1247 Ω and 216 Ω, respectively, after 1000 cycles. In contrast, the cell impedances of the 500 °C annealed, bare and surface modified samples were similar (see Table 4). Additional surface reactions might be occurring slowly during cycling on LNMO@LTO-200 °C powders compared to bare LNMO, due to the presence of Ti-rich amorphous coatings/islands on LNMO surfaces. Amorphous coating-HF scavenging reactions might result in metal fluoride species formation and deposition on LNMO surfaces, such as TiFx (ref. 14) and Li2TiF6.46 The metal fluorides are reported to provide improved ionic conductivity and chemical stability, lowering the cell impedance and reducing the capacity loss after high-voltage electrochemical cycling.14
| Sample | Resistance | After the 250th cycle | After the 500th cycle | After the 750th cycle | After the 1000th cycle |
|---|---|---|---|---|---|
| LNMO-el. | Rf (Ω) | 43 | 45 | 48 | 43 |
| Rct (Ω) | 116 | 200 | 502 | 1247 | |
| LNMO@LTO-200 °C-el. | Rf (Ω) | 42 | 44 | 46 | 48 |
| Rct (Ω) | 107 | 147 | 160 | 216 | |
| LNMO-500 °C-el. | Rf (Ω) | 54 | 53 | 54 | 56 |
| Rct (Ω) | 186 | 416 | 704 | 1187 | |
| LNMO@LTO-500 °C-el. | Rf (Ω) | 55 | 56 | 54 | 52 |
| Rct (Ω) | 538 | 752 | 745 | 1127 |
Based on the aforementioned results, the capacity improvement at 10C of LNMO after amorphous LTO surface modification could be linked to an increase in the electrochemically active LNMO surface area as well as to the formation of an ionically more conductive CEI layer with increasing number of cycles. The modified CEI layer might increase the ionic conductivity, improve surface kinetics, reduce cell impedance and enhance rate performance.
Fig. 10a compares the cyclic stability of bare and amorphous LTO surface modified LNMO. The discharge capacity of LNMO@LTO-200 °C-el. was lower than bare LNMO-el. until ∼1100 cycles. This could be explained by the presence of LTO ‘dead weight’ inside the coated active material, which does not contribute to capacity at this voltage window. The coulombic efficiency of the surface modified powder was higher and more stable than that of bare LNMO, which is favorable to the application of amorphous LTO coatings in batteries. Also, at the end of 2000 cycles at 5C, LNMO@LTO-200 °C-el. demonstrated a 15% higher capacity retention than bare LNMO-el. On the other hand, the 500 °C annealed bare (LNMO-500 °C-el.) and surface modified LNMO (LNMO@LTO-500 °C-el.) electrodes had similar aging trends (Fig. S15†).
The reasons for improvement in cyclic stability after ∼1100 cycles for the amorphous LTO surface modified LNMO were investigated. Mn dissolution from LNMO-500 °C, LNMO@LTO-200 °C and LNMO@LTO-500 °C powders when in contact with EC-DEC electrolyte were determined with ICP-AES measurements. Interestingly, the highest extent of Mn dissolution was detected for LNMO@LTO-200 °C (Fig. 11), which could be related to the higher specific surface area of the powder. Amorphous coating-HF scavenging reactions probably occur on the amorphous LTO surface modified LNMO powder surfaces, resulting in metal fluoride species and water formation (MxO1/2 +HF → MxF + 1/2H2O47). Water reacts with LiPF6, causing a further increase in HF concentration and electrolyte acidity during cycling. This results in more Mn dissolution from the LNMO@LTO-200 °C powder into the electrolyte compared to bare LNMO-500 °C.20,21,41 The coating material does not mitigate the HF attack, furthermore, increases the TM loss. Nevertheless, the cyclic behaviour after ∼1100 cycles is improved for the coated material. This could imply the formation of a more stable and conductive CEI layer with the help of the coating material-HF reaction by products, especially with prolonged cycling. The negative effects of increased electrolyte acidity and Mn dissolution might be compensated by the formation of chemically more stable and conductive metal fluoride species on the LNMO surface during cycling, restricting further reactions with HF.46
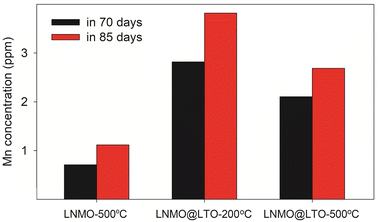 | ||
Fig. 11 Mn concentration detected via ICP-AES in 1.0 M LiPF6 EC/DEC (1![[thin space (1/6-em)]](https://www.rsc.org/images/entities/char_2009.gif) : :![[thin space (1/6-em)]](https://www.rsc.org/images/entities/char_2009.gif) 1, v/v) battery electrolyte after dispersion of LNMO-500 °C, LNMO@LTO-200 °C and LNMO@LTO-500 °C powders for 70 or 85 days. 1, v/v) battery electrolyte after dispersion of LNMO-500 °C, LNMO@LTO-200 °C and LNMO@LTO-500 °C powders for 70 or 85 days. | ||
An increased Mn dissolution was similarly reported for LNMO in 1 M LiPF6/EC-DMC electrolyte after YPO4 surface modification.48 YPO4 converts to YF3 Lewis acid when in contact with the LiPF6 and HF-traces in electrolyte. YF3 increases the acidity of the electrolyte and corrodes the alkaline, surface insulating impurities on LNMO surface. Surface corrosion due to YF3 presence continues through the surface lattice and increases Mn dissolution compared to pristine LNMO.48 A similar mechanism could be valid for our case. Furthermore, Ti-doped spinel surfaces could form after Mn dissolution during cycling, which can increase the structural stability and cyclability by providing strong Ti–O bonds on the particle surfaces.4,49
Conclusions
LNMO surface was modified with amorphous LTO material (LNMO@LTO-200 °C) via a solution-gel route, resulting in Ti-rich amorphous coatings/islands or Ti-rich spinel surfaces mostly on the {001} surfaces of LNMO. Transition metal ions on LNMO powder surface partly dissolved into the aqueous, citric acid based LTO precursor solution during the modification step. The resulting vacancies can be filled by Ti4+ ions, leading to the formation of Ti-doped spinel surface layers. Further, the dissolved Mn and Ni ions precipitated together with the Ti ions in the LTO precursor solution during the water removal step. After heating to 200 °C, this led to formation of Ti–Ni–Mn–O containing amorphous matter inside the LNMO@LTO-200 °C powder. Upon 500 °C annealing in dry air flow (LNMO@LTO-500 °C), the amorphous matter crystallized into spinel or rock-salt nanoparticles depending on the composition. The amorphous LTO surface modification had several beneficial effects: (1) improving the capacity at 10C, (2) mitigating the cell impedance increase during cycling compared to bare LNMO, and (3) improving the cyclic stability after ∼1100 cycles. The improved capacity at 10C could be attributed to the ∼4 times increase in specific surface area by amorphous LTO surface modification, compared to bare LNMO, which reduces the effective current density and polarization. It is hypothesized that scavenging reactions of the amorphous coating with HF occur more intensively on the LNMO@LTO-200 °C powder surfaces during cycling, causing more TM loss, but also providing the formation of a more favorable CEI layer composition and a more stable electrode surface compared to bare LNMO. This could result in the slower cell impedance rise during cycling of LNMO@LTO-200 °C, as well as the improved cyclic stability. On the other hand, crystallized LNMO@LTO-500 °C showed similar cell impedance and cyclic stability compared to its bare counterpart. The crystallized sample only showed an approximately 2-fold surface area increase. It can be hypothesized that similar surface areas, as well as similar CEI layer compositions and stabilities could be the reasons why these crystallized powders show similar electrochemical performance. In conclusion, amorphous multi-metal oxide surface modification was showcased to improve the capacity at 10C and durability of the LNMO cathode, encouraging further research on amorphous surface modification strategy for LNMO active material.Conflicts of interest
There are no conflicts to declare.Acknowledgements
The authors acknowledge the Research Foundation Flanders (FWO Vlaanderen, grant numbers G040116N and G053519N), SBO XL-Lion, the European Regional Development Fund ERDF, Flanders Innovation & Entrepreneurship and the Province of Limburg (project 936). The authors also thank Elsy Thijssen and An-Sofie Kelchtermans for the ICP-AES measurements, Bart Ruttens for the XRD measurements, Derese Deste and Ragha Thiruvallur Eachambadi for the C-AFM measurements, Hilde Pellaers for the SEM sample preparation, Sébastien Sallard and Ahmed Shafique for the electrical conductivity measurements.References
- J.-Y. Piao, Y.-G. Sun, S.-Y. Duan, A.-M. Cao, X.-L. Wang, R.-J. Xiao, X.-Q. Yu, Y. Gong, L. Gu, Y. Li, Z.-J. Liu, Z.-Q. Peng, R.-M. Qiao, W.-L. Yang, X.-Q. Yang, J. B. Goodenough and L.-J. Wan, Chem, 2018, 4(7), 1685–1695 CAS.
- W. Li, B. Song and A. Manthiram, Chem. Soc. Rev., 2017, 46(10), 3006–3059 RSC.
- T. Kim, W. Song, D.-Y. Son, L. K. Ono and Y. Qi, J. Mater. Chem. A, 2019, 7(7), 2942–2964 RSC.
- E. M. Erickson, W. Li, A. Dolocan and A. Manthiram, ACS Appl. Mater. Interfaces, 2020, 12(14), 16451–16461 CrossRef CAS PubMed.
- A. Guéguen, D. Streich, M. He, M. Mendez, F. F. Chesneau, P. Novák and E. J. Berg, J. Electrochem. Soc., 2016, 163(6), A1095–A1100 CrossRef.
- X. Xu, S. Deng, H. Wang, J. Liu and H. Yan, Nano-Micro Lett., 2017, 9(2) Search PubMed.
- W. Li, A. Dolocan, P. Oh, H. Celio, S. Park, J. Cho and A. Manthiram, Nat. Commun., 2017, 8, 14589 CrossRef PubMed.
- N. P. W. Pieczonka, Z. Liu, P. Lu, K. L. Olson, J. Moote, B. R. Powell and J.-H. Kim, J. Phys. Chem. C, 2013, 117(31), 15947–15957 CrossRef CAS.
- J.-K. Park, Principles and Applications of Lithium Secondary Batteries, 2012 Search PubMed.
- X. Hao and B. M. Bartlett, J. Electrochem. Soc., 2013, 160(5), A3162–A3170 CrossRef CAS.
- H. Wang, L. Ben, H. Yu, Y. Chen, X. Yang and X. Huang, J. Mater. Chem. A, 2017, 5(2), 822–834 RSC.
- J. Ma, P. Hu, G. Cui and L. Chen, Chem. Mater., 2016, 28(11), 3578–3606 CrossRef CAS.
- Z. Chen, Y. Qin, K. Amine and Y. K. Sun, J. Mater. Chem., 2010, 20(36), 7606 RSC.
- A. Zhou, Y. Lu, Q. Wang, J. Xu, W. Wang, X. Dai and J. Li, J. Power Sources, 2017, 346, 24–30 CrossRef CAS.
- J. S. Park, X. Meng, J. W. Elam, S. Hao, C. Wolverton, C. Kim and J. Cabana, Chem. Mater., 2014, 26(10), 3128–3134 CrossRef CAS.
- J. Lu, C. Zhan, T. Wu, J. Wen, Y. Lei, A. J. Kropf, H. Wu, D. J. Miller, J. W. Elam, Y. K. Sun, X. Qiu and K. Amine, Nat. Commun., 2014, 5, 5693 CrossRef CAS PubMed.
- R. Zhu, S. Zhang, Q. Guo, Y. Zhou, J. Li, P. Wang and Z. Gong, Electrochim. Acta, 2020, 342, 136074 CrossRef CAS.
- L. Li, R. Zhao, T. Xu, D. Wang, D. Pan, K. Zhang, C. Yu, X. Lu, G. He and Y. Bai, Nanoscale, 2019, 11(18), 8967–8977 RSC.
- R. Zhao, L. Li, T. Xu, D. Wang, D. Pan, G. He, H. Zhao and Y. Bai, ACS Appl. Mater. Interfaces, 2019, 11(17), 16233–16242 CrossRef CAS PubMed.
- Y. Bai, Y. Yin, N. Liu, B. Guo, H. Shi, J. Liu, Z. Wang and L. Chen, J. Power Sources, 2007, 174(1), 328–334 CrossRef CAS.
- J. Liu, N. Liu, D. Liu, Y. Bai, L. Shi, Z. Wang, L. Chen, V. Hennige and A. Schuch, J. Electrochem. Soc., 2007, 154(1), A55 CrossRef CAS.
- F. Ulu Okudur, S. K. Mylavarapu, M. Safari, D. De Sloovere, J. D'Haen, B. Joos, P. Kaliyappan, A.-S. Kelchtermans, P. Samyn, M. K. Van Bael and A. Hardy, J. Alloys Compd., 2021, 162175 Search PubMed.
- S. Gielis, A. Hardy, M. V. Bael and P. M. Vereecken, Conformal Coating on Three-Dimensional Substrates, U. S. P. A. Publication, Belgium, 2017 Search PubMed.
- A. Hardy, J. D'Haen, M. K. Van Bael and J. Mullens, J. Sol-Gel Sci. Technol., 2007, 44(1), 65–74 CrossRef CAS.
- M.-C. Yang, B. Xu, J.-H. Cheng, C.-J. Pan, B.-J. Hwang and Y. S. Meng, Chem. Mater., 2011, 23(11), 2832–2841 CrossRef CAS.
- L. Fu, H. Liu, C. Li, Y. Wu, E. Rahm, R. Holze and H. Wu, Prog. Mater. Sci., 2005, 50(7), 881–928 CrossRef CAS.
- J. Kasnatscheew, M. Evertz, B. Streipert, R. Wagner, R. Klopsch, B. Vortmann, H. Hahn, S. Nowak, M. Amereller, A. C. Gentschev, P. Lamp and M. Winter, Phys. Chem. Chem. Phys., 2016, 18(5), 3956–3965 RSC.
- F. Schipper, H. Bouzaglo, M. Dixit, E. M. Erickson, T. Weigel, M. Talianker, J. Grinblat, L. Burstein, M. Schmidt, J. Lampert, C. Erk, B. Markovsky, D. T. Major and D. Aurbach, Adv. Energy Mater., 2018, 8(4), 1701682 CrossRef.
- Q. Zhong, A. Bonakclarpour, M. Zhang, Y. Gao and J. R. Dahn, J. Electrochem. Soc., 1997, 144(1) CrossRef CAS.
- M.-L.-P. Le, P. Strobel, C. V. Colin, T. Pagnier and F. Alloin, J. Phys. Chem. Solids, 2011, 72(2), 124–135 CrossRef CAS.
- K. R. Chemelewski, E.-S. Lee, W. Li and A. Manthiram, Chem. Mater., 2013, 25(14), 2890–2897 CrossRef CAS.
- G. G. Amatucci, A. Blyr, C. Sigala, P. Alfonse and J. M. Tarascon, Solid State Ionics, 1997, 104, 13–25 CrossRef CAS.
- M. K. VanBael, A. Hardy and J. Mullens, in Chemical Solution Deposition of Functional Oxide Thin Films, Springer Science & Business Media, 2013 Search PubMed.
- N. N. Intan, K. Klyukin and V. Alexandrov, J. Electrochem. Soc., 2018, 165(5), A1099–A1103 CrossRef CAS.
- K. Leung, J. Phys. Chem. C, 2012, 116(18), 9852–9861 CrossRef CAS.
- A. Hardy, G. Vanhoyland, M. K. Van Bael, J. Mullens and L. C. Van Poucke, Thermochim. Acta, 2003, 397, 143–153 CrossRef CAS.
- M. Borner, P. Niehoff, B. Vortmann, S. Nowak, M. Winter and F. M. Schappacher, Energy Technol., 2016, 4, 1631–1640 CrossRef.
- T. R. Jow, S. A. Delp, J. L. Allen, J.-P. Jones and M. C. Smart, J. Electrochem. Soc., 2018, 165(2), A361–A367 CrossRef CAS.
- T. Yang, N. Zhang, Y. Lang and K. Sun, Electrochim. Acta, 2011, 56(11), 4058–4064 CrossRef CAS.
- M. Park, X. Zhang, M. Chung, G. B. Less and A. M. Sastry, J. Power Sources, 2010, 195(24), 7904–7929 CrossRef CAS.
- T. Xu, Y. Li, D. Wang, M. Wu, D. Pan, H. Zhao and Y. Bai, ACS Sustain. Chem. Eng., 2018, 6(5), 5818–5825 CrossRef CAS.
- Y. Dong, B. T. Young, Y. Zhang, T. Yoon, D. R. Heskett, Y. Hu and B. L. Lucht, ACS Appl. Mater. Interfaces, 2017, 9(24), 20467–20475 CrossRef CAS PubMed.
- X.-W. Gao, Y.-F. Deng, D. Wexler, G.-H. Chen, S.-L. Chou, H.-K. Liu, Z.-C. Shi and J.-Z. Wang, J. Mater. Chem. A, 2015, 3(1), 404–411 RSC.
- D. Pritzl, A. E. Bumberger, M. Wetjen, J. Landesfeind, S. Solchenbach and H. A. Gasteiger, J. Electrochem. Soc., 2019, 166(4), A582–A590 CrossRef CAS.
- G.-L. Xu, Q. Liu, K. K. S. Lau, Y. Liu, X. Liu, H. Gao, X. Zhou, M. Zhuang, Y. Ren, J. Li, M. Shao, M. Ouyang, F. Pan, Z. Chen, K. Amine and G. Chen, Nat. Energy, 2019, 4(6), 484–494 CrossRef CAS.
- M. Aykol, S. Kirklin and C. Wolverton, Adv. Energy Mater., 2014, 4(17), 1400690 CrossRef.
- M. Aykol, S. Kim, V. I. Hegde, D. Snydacker, Z. Lu, S. Hao, S. Kirklin, D. Morgan and C. Wolverton, Nat. Commun., 2016, 7, 13779 CrossRef CAS PubMed.
- T. Xu, et al., Enhanced Electrochemical Performance of LiNi0.5Mn1.5O4 Cathode Material by YPO4 Surface Modification, ACS Sustain. Chem. Eng., 2018, 6(5), 5818–5825 CrossRef CAS.
- J.-H. Kim, et al., In Situ Formation of a Cathode-Electrolyte Interface with Enhanced Stability by Titanium Substitution for High Voltage Spinel Lithium-Ion Batteries, Adv. Mater. Interfaces, 2015, 2(10), 1500109 CrossRef.
- H. An, D. 'H. Jan, M. K. Van Bael and J. Mullens, An aqueous solution–gel citratoperoxo–Ti (IV) precursor: synthesis, gelation, thermo-oxidative decomposition and oxide crystallization, J. Sol. Gel Sci. Technol., 44, 65–74 Search PubMed.
- D. Nelis, D. Mondelaers, G. Vanhoyland, A. Hardy, K. Van Werde, H. Van den Rul, M. K. Van Bael, J. Mullens, L. C. Van Poucke and D. 'H. Jan, Synthesis of strontium bismuth niobate (SrBi2Nb2O9) using an aqueous acetate–citrate precursor gel: thermal decomposition and phase formation, Thermochim. Acta, 426(1–2), 39–48 CAS.
- M. K. Van Bael, D. Nelis, A. Hardy, D. Mondelaers, K. Van Werde, J. D’Haen, G. Vanhoyland, H. Van den Rul, J. Mullens, L. C. Van Poucke, F. Frederix and D. J. Wouters, Aqueous chemical solution deposition of ferroelectric thin films, Integrated Ferroelectrics Int. J., 2002, 45(1), 113–122 CrossRef CAS.
Footnote |
| † Electronic supplementary information (ESI) available. See DOI: https://doi.org/10.1039/d3ra05599j |
| This journal is © The Royal Society of Chemistry 2023 |

