
 Open Access Article
 This Open Access Article is licensed under a Creative Commons Attribution-Non Commercial 3.0 Unported Licence
Biosynthesis enhancement of tropodithietic acid (TDA) antibacterial compound through biofilm formation by marine bacteria Phaeobacter inhibens on micro-structured polymer surfaces†‡
Ariadni Droumpalia,
Yuyan Liu a,
Xavier Ferrer-Florensab,
Claus Sternbergb,
Maria Dimakib,
Aaron J. C. Andersenb,
Mikael L. Strubeb,
Paul J. Kempena,
Lone Gramb and
Rafael Taboryski*a
a,
Xavier Ferrer-Florensab,
Claus Sternbergb,
Maria Dimakib,
Aaron J. C. Andersenb,
Mikael L. Strubeb,
Paul J. Kempena,
Lone Gramb and
Rafael Taboryski*a
aDTU Nanolab, National Centre for Nano Fabrication and Characterization, Technical University of Denmark, Ørsteds Plads, Building 347, DK-2800 Kgs. Lyngby, Denmark. E-mail: rata@dtu.dk
bDTU Bioengineering, Department of Biotechnology and Biomedicine, Technical University of Denmark, Søltofts Plads, Building 221, DK-2800 Kgs. Lyngby, Denmark
First published on 9th November 2023
Abstract
Although aquaculture is a major player in current and future food production, the routine use of antibiotics provides ample ground for development of antibiotic resistance. An alternative route to disease control is the use of probiotic bacteria such as the marine bacteria Phaeobacter inhibens which produces tropodithietic acid (TDA) that inhibit pathogens without affecting the fish. Improving conditions for the formation of biofilm and TDA-synthesis is a promising avenue for biocontrol in aquaculture. In this study, the biosynthesis of TDA by Phaeobacter inhibens grown on micro-structured polymeric surfaces in micro-fluidic flow-cells is investigated. The formation of biofilms on three surface topographies; hexagonal micro-pit-arrays, hexagonal micro-pillar-arrays, and planar references is investigated. The biomass on these surfaces is measured by a non-invasive confocal microscopy 3D imaging technique, and the corresponding TDA production is monitored by liquid chromatography mass spectrometry (LC-MS) in samples collected from the outlets of the microfluidic channels. Although all surfaces support growth of P. inhibens, biomass appears to be decoupled from total TDA biosynthesis as the micro-pit-arrays generate the largest biomass while the micro-pillar-arrays produce significantly higher amounts of TDA. The findings highlight the potential for optimized micro-structured surfaces to maintain biofilms of probiotic bacteria for sustainable aquacultures.
Introduction
In recent decades, aquaculture has gained more attention as an important source of animal protein for human beings. One of the main challenges in aquaculture food production is bacterial infectious disease, which has resulted in an increased use of antibiotics and therefore a risk of development and spread of bacterial antibiotic resistance. Vaccines have been very successful in reducing use of antibiotics in the Norwegian salmon industry, however, not all aquaculture organisms have an immune system allowing vaccination and this is particularly true at younger stages, such as larvae. Consequently, there is a need for more sustainable alternatives for disease control in aquaculture.1,2 A promising disease control solution is to steer the microbiome in a beneficial direction using probiotic bacteria.One example of probiotic bacteria is the marine bacteria of the Roseobacter group Phaeobacter inhibens, which can inhibit other microorganisms namely Vibrio and Tenacibaculum, by producing the antibacterial compound tropodithietic acid (TDA).3–8 TDA acts as a proton antiporter, and whilst the producer carries a resistance mechanism, this appears not to transfer to other bacteria in natural settings.13 Furthermore, TDA has shown properties as a signalling molecule enabling quorum sensing and regulating gene expression of Phaeobacter inhibens.14 In larval challenge trials, TDA producing roseobacters have successfully reduced mortality.3,8 The TDA producing bacteria have no adverse effects on the fish larvae or their live feed, and resistance to TDA is unlikely to develop in target bacteria.10,11
No reports on chemical synthesis of TDA could be found in the scientific literature. TDA is a sulfur containing tropone derivative (see Fig. 1) produced by several genera or species of the Roseobacter group, including some species of Phaeobacter Tritonibacter and Pseudovibrio.9 Both the central carbon and sulphur metabolism of the cell are involved in the biosynthesis of TDA. The latter steps of the biosynthesis depends on the so-called tda-genes typically harboured on a mega-plasmid.9,12 Hence, biosynthesis of TDA by probiotic bacteria appears to be the only option to replace the use of antibiotics in aquacultures. The biosynthesis of TDA is especially pronounced when the bacteria are attached to a surface and grow as biofilms.15,16 With the aim to promote sustainable aquaculture in the future, culturing TDA producing Phaeobacter inhibens on micro-structured surfaces may be a way forward to enhance biosynthesis of TDA (see Fig. 1).
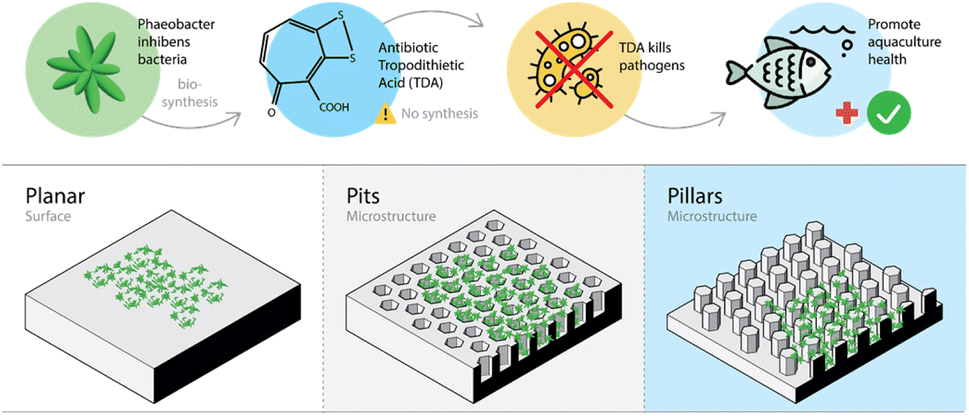 | ||
| Fig. 1 Illustration highlighting the research motivation and demonstrating the 3D structure of and bacterial growth on the micro-patterned surfaces. | ||
Most studies on correlations between biofilm culture and surface properties are concerned with avoiding bacterial biofilms and biofouling of the surfaces, i.e., inhibiting biofilm adhesion.17–24 Many physicochemical factors play essential roles in different stages of bacterial attachment and biofilm formation.25 The large number of these variables and factors makes it difficult to hypothesize which physicochemical factors are key in the formation of biofilms.20 Other studies have centred on chemically modifying surfaces to become antiadhesive, or even contain antibacterials to reduce bacterial attachment.21 Pajerski et al. show the relation between the increase of oxygen molecules in graphene and the enhancement of biofilm formation of five different strains.26 Thus, proving the importance of chemical factors on the attachment of cells on surfaces.
Very few studies have reported the importance of roughness and wettability of the surfaces to enhance biofilm formation.27–29 One exception is the study by Friedlander et al. on surfaces for promotion of Escherichia coli biofilms.30 Friedlander et al. studied hexagon shaped micro-pillar arrays with varying trench widths fabricated by soft-lithography in polydimethylsiloxane (PDMS). Although the results regarding the type of surface structures are relevant for the present work, PDMS is a hydrophobic material, with a surface energy expected to result in weak biofilm adhesion. The effect of surface energy on biofilm adhesion is debateable and other factors may play a larger role.31,32 In a more recent study by Gupta et al., the influences of fluid shear stress and surface roughness of Ti surfaces for attachment and retention of Staphylococcus aureus aggregates were investigated.33 In this study, of relevance for orthopaedic implants, the structures consisted of machined parallel grooves and ridges with depths and pitches in the hundred μm range. Gupta et al. found that the bacteria preferably colonized the structured surfaces over planar surfaces. Likewise, in a preliminary study the authors reported on Phaeobacter inhibens biofilm formation in batch reactors on micro structured Si surfaces, and found that both honeycomb pillar arrays and honeycomb pit arrays showed increased biomass formation over planar reference surfaces.34
This study aims to demonstrate TDA biosynthesis on micro-structured surfaces and to explore the potential of such biosynthesis in aquaculture disease control.
Experimental
Description of methodology
This study aims to demonstrate TDA biosynthesis in microfluidic flow channels that enable culture of Phaeobacter inhibens biofilms. In contrast to batch reactors, flow channels allow a well-controlled continuous supply of nutrients, and a predictable shear stress. Here, the biofilms were grown on weakly hydrophobic hard polymer surfaces comprising two different micro-fabricated honeycomb structures and a planar reference surface composed of the same material. As shown in Fig. 1, the two structured surfaces have comparable dimensions, and differ by their polarity, one being a hexagonal pillar array surface and the other a hexagonal pit array surface. The geometrical dimensions were chosen such that the widths of indentations in both cases could accommodate the so-called rosette aggregates of the bacteria that typically span about 5–10 μm.16,35,36 Both surfaces have a hexagon side length a = 5 μm, and depths h ≈ 12 μm, while the trench widths d for the pillar array is 10 μm, the corresponding wall widths for the pit array surface is only 5 μm.As mentioned above, the outcome of a preliminary study by the authors34 showed increased biomass growth on micro-structured Si surfaces over planar reference surfaces in batch reactors with magnetic stirring to emulate shear stress, and with no continuous supply of nutrients, but with rather weak significance levels. To rectify these shortcomings, this study was carried out in microfluidic flow cells, of the type shown in Fig. 2a, with each cell containing three independent flow channels.37 Nutrients are supplied through the tubing in the top of the cell as shown in Fig. 2a and drained through the tubing in the bottom of cell. Flow channels are 40 mm long, 4 mm wide, and 1 mm deep. The flow cells comprised polymer substrates with surfaces having small 3 × 3 mm micro-structured fields comprising planar reference fields, hexagonal pillar- and pit-array fields. The difference in d between the two patterned surfaces resulted in a larger surface area for the pit array surface. The surface area factor, total surface area divided by projected surface area, differs for the two surfaces with the pit array having the largest area factor rpits = 3.2, while the pillar array has rpillars = 2.2. By definition, the surface area factor for the planar reference surface is rplanar = 1 (see ESI, Fig. S1† for details).
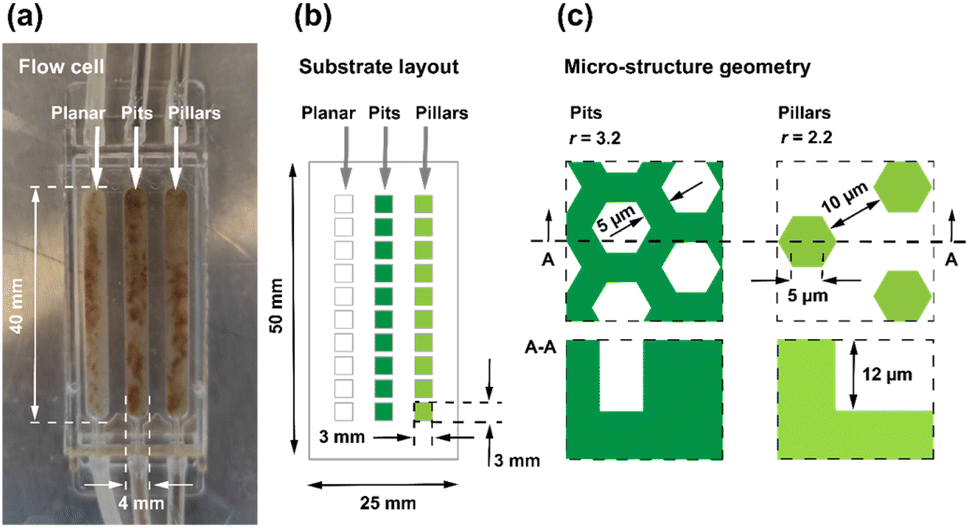 | ||
| Fig. 2 (a) Photographic image of the flow cells with three separate microfluidic channels comprising the three surfaces; the planar reference surface, the hexagonal pit array surface, and the hexagonal pillar array surface. The brown tarnish is a visual signature of TDA production. (b) Illustration showing the polymer substrate with 10 fields (3 by 3 mm) for each type of pattern. (c) Microstructure geometry for pits and pillars is shown. | ||
The so called DEEMO process (dry etching, electroforming, and moulding) was employed to micro-fabricate the substrates in a transparent and low auto-fluorescence polymer (see also Fig. S2†).38,39 The substrate dimensions and layouts are shown in Fig. 2b. To simplify the statistical analysis, an experimental design was chosen comprising only two microstructure topographies, a hexagonal pit array, and a hexagonal pillar array in addition to the planar reference surface. For the purpose of monitoring bacterial biomass, seven replicates were utilized for each channel. The bacteria were inoculated into the flow channels through the inlets and were stained with a green fluorescent dye to allow confocal imaging. Confocal laser scanning microscopy (CLSM) allowed for non-invasive 3D imaging of the biomass without interrupting the flow of nutrients. The biofilm formation was analysed on days 2, 4, 6, 7 and 8, and the average bacterial biomass was computed for the three surfaces. Liquid chromatography mass spectrometry (LC-MS) was used to detect the antimicrobial compound TDA, with a molecular ion mass of m/z 212.9675, from samples collected from the outlets of the microfluidic channels containing monocultures of Phaeobacter inhibens throughout the complete experimental timeline.
Materials and methods
UV lithography
Silicon surfaces comprising arrays of hexagonal micro-pillars and pits with the same hexagon side lengths and depths, but different pitches were originated on 100 mm diameter n-type 〈100〉 single-sided polished silicon wafers with a thickness of 525 ± 20 μm (Siegert Wafer GmbH). A layer of 1.5 μm photoresist (AZ5214E) was applied using a spin coater (Gamma 2M cluster, Süss MicroTec, Garching, Germany). The patterns were designed using CleWin5 software (WieWeb software, Hengelo, The Netherlands). The design was transferred to the photoresist using a maskless aligner (Heidelberg Instruments MLA150 Maskless Aligner) by means of an 8 W laser and a dose of 65 mJ cm−2, emitting at 375 nm. The development of samples was done for 60 s in a tetramethylammonium hydroxide (TMAH)-based solution (AZ 726 MIF in 2.38% TMAH water solution) to develop the pattern (Süss MicroTec Gamma 2M developer, s/n GAMMA-000233).Si etching and smoothing
Approximately 12 μm of Si was etched by deep reactive ion etching (DRIE). (STS Pegasus DRIE). An inner coil and an outer coil with 13.56 MHz RF generators produced the plasma, where the maximum power is 5 kW. A deposit-removal-etch-multiple-times (DREM) process, 1 kW power with 380 cycles was used with a descum/ashing step before etching to remove resist residues.40 An oxygen plasma ashing process removed the remaining photoresist. For smoothing the scallops, a layer ∼530 nm of SiO2 in a furnace with O2 gas at 1100 °C for 70 min was grown by wet oxidation. Subsequently, an annealing process of 20 min in N2 gas was carried out. Before starting the furnace, a standard RCA cleaning process was used to clean the samples from any residual traces. After the SiO2 growth, the silicon master was dipped in a buffered hydro-fluoric acid (BHF) bath with wetting agent, featuring a SiO2 etch rate of 75–80 nm min−1, for 5–7 min.Fabrication of nickel shim
A 100 nm seed layer of NiV alloy was deposited onto the Si master using sputter deposition (Sputter System Lesker). Subsequently, a 340–350 μm thick layer of Ni was electroformed (Technotrans Microform 200 nickel electroplating machine). Deposition started at a low current of 100 mA and remained at a max current of 1.5 A, the process lasted for 12.5 hours. After electroforming, the remaining Si wafer was etched away using an aqueous KOH solution. The etching was performed at 80 °C. For better anti-stiction properties, the produced Ni mould was coated with a self-assembled monolayer from the precursor per-fluorodecyltrichlorosilane (FDTS) (Applied Microstructures Inc. MVD 100 Molecular Vapour Deposition System).41Fabrication of polymer surfaces
The polymer substrates were produced by injection moulding on a standard microscopy slide of size 75 mm × 25 × 1 mm3. The microstructures were obtained by using the micro-structured negative relief Ni shim as a mould.39,42,43 Before moulding, the Ni shim was cut into a 80 mm diameter plate by a green (532 nm) laser micromachining tool (MicroSTRUCT vario, 3D-Micromac AG), comprising a flat edge to allow alignment against two alignment pins mounted on the fixed part of the Injection moulding tool. The nickel shim was mounted in the industrial injection moulding machine (Victory 80/45 Tech, Engel) with a back plate of 1 mm thickness, and aligned with the pins.44 The injection moulding was done using a vario-thermal process, whereby the heated polymer was filled and packed on the inverse relief polarity Ni shim, to ensure proper filling of the microstructures and subsequently allowed to cool down and solidify before demoulding.45 The polymer used for injection moulding was a cyclic-olefin-copolymer grade TOPAS 5013-L10 (TOPAS Advances polymers GmbH). To clean the nickel shim, after use, the remaining polymer was dissolved in a toluene bath (100% w/v) at room temperature overnight. Before reusing the shim in the machine, it was again coated with an FDTS anti-stiction layer.Fabrication of the flow cells
The flow chamber base was made by moulding in cyclic-olefin-copolymer grade TOPAS 5013-L10 (TOPAS Advances polymers GmbH), as described in a previous work by Tolker-Nielsen and Sternberg.46 The polymer substrates were also injection moulded to match a standard microscopy slide of size 75 mm × 25 × 1 mm3. Before bonding the microscope slide polymer part with the flow chamber base, the moulded slides were cut into the correct dimensions to allow bonding (CO2 laser Epiloglaser mini 30 W) with a vector cutting speed of 17%, power 45% and frequency 2500 Hz. For UV and thermal bonding, the polymer parts were placed inside the box of the UV/O3 custom build setup. The part that had to be bonded on the chip was placed upside down. The UV exposure was limited to 5 min. After the parts were exposed to light, they were carefully placed together. For a successful bonding, the pressure and temperature had to be evenly distributed on the polymer surface.38Scanning electron microscopy (SEM)
For characterizing the samples with different topographies, scanning electron microscope (SEM) images were obtained using a Zeiss Supra VP 40 instrument (Carl Zeiss AG, Jena, Germany). The accelerating voltage was either 3 or 5 kV. SmartSEMsoftware (Carl Zeiss AG, Jena, Germany) on the microscope was used for imaging and analysis.SEM was also applied to observe the bacteria growing on different surfaces. Samples were fixed with 2.5% glutaraldehyde in 0.1 M Sodium cacodylate buffer overnight at room temperature. The samples were rinsed twice in milliQ H2O for 5 min each time. Samples were dehydrated with an ethanol series of 50%, 70%, and 95% for 5 min each time. Samples were further dehydrated twice with 100% ethanol for 5 min each time. After dehydration, samples were placed in a Leica EM CPD300 critical point dryer and dried in supercritical CO2. Samples were placed in a Quorum Q150T sputter coater and a thin layer (around 3 nm) of gold was deposited on the bacterial samples. A FEI Quanta FEG 200 SEM operating at 10 kV was used to observe the location and shape of the bacteria on different surfaces.
Bacterial strain and culture conditions
The Phaeobacter inhibens DSM 17395 strain was used for the biofilm formation experiments. Bacterial stock cultures were stored at −80 °C in 20% (vol/vol) glycerol. Two to three days prior to use, stock cultures were streaked on Marine Agar plates (Marine Agar, Difco 2216), and incubated at 25 °C. Single colonies were used for the inoculation of each preculture. All bacterial precultures were grown in 20 ml of Marine Broth (MB) (Marine Broth, Difco 2216) at 25 °C for 24 h. The MB was solubilized in deionized water, and sterilized by autoclaving at 121 °C for 15 min. 4.5 l of 3% Instant Ocean® Sea Salt (IO) salts were prepared by dissolving 30 g of IO salts in 1 l deionized water, adjusting the pH to 7.8 and autoclaving at 121 °C for 15 min. The growth media for the flow cell experiment was 1/10 MB media diluted in 3% IO prepared by mixing 500 ml of MB in 4.5 l of 3% IO sterilized media and adjusted to a pH of 7.8. The sterilization of the flow system was carried out with sodium hypochlorite (14% Cl2) in aqueous solution. The system (including bubble traps) was completely filled with sodium hypochlorite using the highest flow rate on the peristaltic pump and left for 3 h at the lowest rate. After 3 h all traces of disinfectant were removed by emptying and filling the system for three times with sterile deionized water. Air was pumped into the system between each filing of water. At the end, the system was filled with growth media at a flow rate of 2.2 ml/hour (pump set on 1 RPM). The inoculation of the flow system was achieved by stopping the pump and adding 250 μl overnight culture of 1![[thin space (1/6-em)]](https://www.rsc.org/images/entities/char_2009.gif) :10 diluted P. inhibens in 3% IO, in the selected channels in the inlet of the flow chamber. It was important to clamp the silicone tubes, which were feeding the channels in order to avoid back flow. The channels were sterilized with ethanol before inoculation and the inoculation hole sealed with silicone glue. The adhesion of the bacteria in the flow cells was carried out in stop flow for 1 h and with the chip turned upside down. After 1 h, the clamps were removed, and the flow started. The flow rate was set to 2.2 ml per hour during the bacterial culture and the experiment was performed for 8 days. Outlet samples from all the two micro-structured surfaces and the reference surface were collected for enumeration of bacterial concentration (CFU ml−1) by 10-fold serial dilution and surface plating on MA plates. Aliquots were kept at −20 °C for chemical analyses (see below).
:10 diluted P. inhibens in 3% IO, in the selected channels in the inlet of the flow chamber. It was important to clamp the silicone tubes, which were feeding the channels in order to avoid back flow. The channels were sterilized with ethanol before inoculation and the inoculation hole sealed with silicone glue. The adhesion of the bacteria in the flow cells was carried out in stop flow for 1 h and with the chip turned upside down. After 1 h, the clamps were removed, and the flow started. The flow rate was set to 2.2 ml per hour during the bacterial culture and the experiment was performed for 8 days. Outlet samples from all the two micro-structured surfaces and the reference surface were collected for enumeration of bacterial concentration (CFU ml−1) by 10-fold serial dilution and surface plating on MA plates. Aliquots were kept at −20 °C for chemical analyses (see below).
Staining and microscopic analysis with CLSM
Bacterial biofilms were stained with SYTO9 (ThermoFischer Scientific, Waltham, MA, Cat. no. S34854) by diluting the stock solution 1:3000 with sterile milliQ water. Then, 250 μl of the diluted stain was injected through the inlet tubing of each flow chamber. The tubings were sterilized with ethanol before staining and the holes were subsequently sealed with silicone glue. During staining, the inlet was clamped to avoid bacteria back-growth in the channel and potentially entering the medium. The flow was stopped for 15 min to allow for the staining of the bacterial cells.
Microscopic observations of bacterial biofilms in the flow channels were obtained using an inverted Leica TCS SP8 confocal laser scanning microscope (Leica Microsystems, Mannheim, Germany) equipped with solid state lasers, and detectors and filter sets for monitoring GFP (excitation: 488 nm, emission: 493–558 nm). Images were obtained using an HC PL Fluotar 10×/0.30 dry objective. Confocal microscopy images were acquired at z-intervals of 1 μm. Biofilms grown on all polymer surfaces were analysed, acquiring up to seven randomly chosen images (technical replicates) from different regions of the flow chamber to account for any heterogeneity within the replicates. 3D rendered images were made using Imaris software (Oxford Instruments, Abingdon, UK). Each channel of the 3D confocal stacks was quantified for biomass using the image-analysis COMSTAT version 2.1 software,47 to determine the relative volume of biomass on the specific region. The biomass per area is determined as the observed biofilm volume divided by the size of the observed area The unit is μm3 μm−2.
LC-MS analysis of TDA
To explore biosynthesis of TDA by Phaeobacter inhibens from the different surfaces a semi-quantitative analysis of TDA using LC-MS was performed. The presence of TDA in culture extracts was determined via targeted analysis with reference to the accurate mass, retention time and fragmentation of a known TDA reference standard (Sigma-Aldrich, St. Louis, MO) (Fig. S3†). Outlet samples, kept in the −20 °C freezer, were thawed at room temperature. The samples were divided into 3 technical replicates with a volume of 50 μl. Then 50 μl samples were diluted in a ratio 1:2 with isopropanol:ethyl acetate 1:3 v/v with 1% formic acid in 1.5 ml Eppendorf tubes. Samples were shaken for 10 s by vortex, and then sonicated for 15 min at 50/60 Hz. After sonication, the organic phase was collected in a clean Eppendorf. The extraction procedure was repeated twice and extracts were pooled. All samples were evaporated under N2 flow on a 35 °C heating block. Extracts were re-dissolved in 80 μl methanol. The extracts were then centrifuged for 2 min at 12000 RCF and the supernatant was transferred to HPLC vials with inserts.
Chromatographic separation of the extracts was achieved with an ultra-high performance liquid chromatography (UHPLC) system (Agilent Infinity II 1290 equipped with an Agilent InfinityLab Poro-chell 120 phenyl hexyl column (2.1 × 150 mm, 1.9 μm)). Eluting metabolites were detected with a mass spectrometer (Agilent 6545 QTOF) operating in positive ionisation mode with an electrospray ionisation (ESI) source. The data was processed and analysed (Agilent MassHunter Qualitative Analysis B.07.00). Data from both biomass and TDA analyses were averaged in terms of technical replicates for each biological replicate and expressed as the mean ± SD. Graphs were made in Origin Pro 2019 (Version 9.6.0.172, OriginLab Corporation, Northampton, United States). Statistical analyses were conducted in Rstudio. The processed data were fitted to a model containing the surface pattern, day as well as their interaction. Due to the non-linear trend across time, the day of the CLSM imaging and outlet sampling (for TDA analysis) was considered as a categorical variable. Given significance of the interaction term, post hoc pairwise comparisons between patterns within individual days were conducted using the emmeans package in R.
Finite element simulations
To calculate the shear stress and the concentration of species inside the chip, COMSOL Multiphysics version 6.1 was used and specifically the laminar flow module (low Reynolds number Navier–Stokes equation) coupled one-way with the Transport of Diluted Species module (diffusion equation). The geometry was limited to a unit cell for each case and the flow rate was adjusted, so that the velocity of the liquid inside this limited geometry was the same as in the experiments. Three cases were simulated: (a) a bare flat surface, (b) pillars and (c) pits, matching the dimensions used in the experiments. Oxygen was used as one of our species, with a diffusion coefficient of ∼2 × 10⁻⁹ m2 s−1. The bacteria growing in the system were modelled as a surface reaction on all available surfaces except the channel walls. The surfaces were set as consuming oxygen in a first order reaction with a reaction rate varying between 0.01 m s−1 down to 10−6 m s−1. The changing reaction rate models the varying biomass of bacteria growing on the surfaces. The inlet concentration was normalized to 1 mol m−3, therefore all the reported concentrations are not absolute but relative to the inlet concentration.Results
When the bacteria were inoculated into the flow channels for confocal imaging and TDA sampling, a brown tarnish, indicating TDA production was observed in the flow channels after only a few days of culture (Fig. 2A), The brown colour originates from the formation of a Fe and TDA complex.48 The CLSM analysis, and SEM images of the three surfaces with bacteria cells after the experiment are shown in Fig. 3a.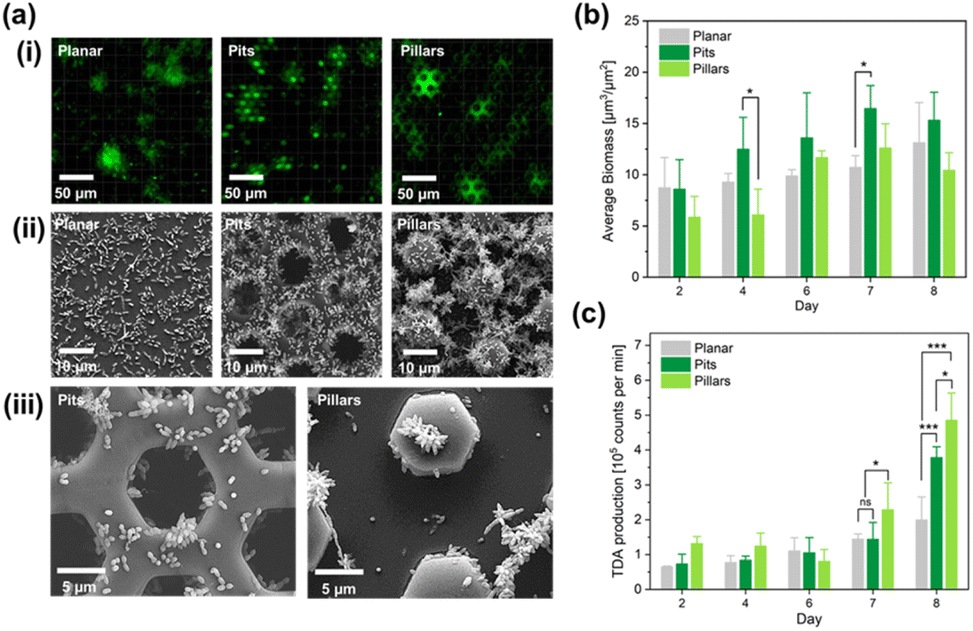 | ||
| Fig. 3 (a) CLSM imaging of stained biomass on the three surfaces. Planar reference surface, pit array surface, and pillar array surface (i). SEM images of Phaeobacter inhibens on the three surfaces (ii). Close-up SEM images of Phaeobacter inhibens obtained with higher magnification, where the so-called rosette formations are clearly visible (iii). (b) Quantification of biomass per projected surface area (μm3 μm−2) (iv). (c) Evolution of TDA biosynthesis over time quantified by LC-MS semi-quantitative analysis. The insert shows the chemical diagram of the TDA molecule. Significance level: *, p-value < 0.05; ***, p-value < 0.001; ns, not significant. | ||
Quantification of biomass, in units of volume per unit area, was conducted by CLSM to yield the evolution of biomass over time in the flow channels. This quantitative analysis allowed us to obtain the bacterial biomass (Fig. 3b). Means and standard deviations acquired from seven randomly chosen images from each type of surface in the same flow channel (technical replicates) are based on (n = 3) biological replicates (three independent flow cells). Overall, the statistical analysis revealed that the biomass production for all three surfaces peaked on day 7 and revealed a significant difference between pit and planar surfaces (p = 0.0084) and between pit and pillar surfaces (p < 0.001) on day 7, but not between pillar and planar surfaces. On the last day (day 8) of the experiment, the biomass production was reduced slightly on the two structured surfaces. This analysis showed that the average bacterial biomass on pit surfaces was higher than the biomass on the other surfaces during the whole experiment (Fig. 3b).
The quantification of TDA production was obtained by liquid chromatography mass spectrometry (LC-MS) semi-quantitative analysis with sampling from the channel outlets (expressed in arbitrary units proportional to integrated MS peak counts). Interestingly, the biosynthesis of TDA increased for the two structured surfaces on the last day of the experiment, and in contrast to the biomass growth, the pillar surface exhibited the most pronounced biosynthesis of TDA (Fig. 3c). The high TDA levels from the pillar surfaces is a surprising result, as apparently the TDA level does not scale with the volume of biomass, nor with the surface area, as the relative surface area of the pillar surface is smaller than the pit surface.
For a statistical analysis to yield the Pearson correlation coefficients between biomass level and TDA counts, a dataset comprising day, surface, average biomass level, and average TDA counts was prepared. The day entry comprised 5 values (2, 4, 6, 7, 8). The surface entry comprised 3 values (planar, pits, pillars). The average biomass entry was computed as the average of the biomass recorded from at least seven fields in each flow channel, and finally the average of the biomass values for each surface for the three flow cells (3 x-values) and average TDA counts were computed as the average of the three technical replicates for the three flow cells (3 y-values). For each day, the obtained correlation coefficients are shown in the ESI Table S1.† If the correlation coefficients are computed based on the whole dataset across the days of sampling, the following correlation coefficients are obtained for the planar, the pit, and the pillar surfaces respectively: 0.05, −0.02, and 0.13. In addition, the ratio of TDA counts to biomass level is shown in Fig. S4.† Both the data in Table S1† and the summed up values indicate no, or very weak correlation between TDA production and biomass. Of course some threshold biomass is anticipated to support TDA production. Whereas this threshold biomass cannot be extracted from the dataset, the data indicate that other biological factors, such as the formation of rosette shape aggregates must be responsible for the onset of TDA production.
It is interesting to investigate what might have caused the higher levels of TDA biosynthesis from the pillar surfaces as compared to the pit surfaces. The pit surfaces supported more biomass which, in part, could be because of the protected growth. In contrast, the pillar surfaces required strong attachment which is facilitated by the rosette formation49 which also facilitates TDA production.50 Thus, it was assumed that TDA biosynthesis is correlated with aggregation of the bacteria cells in rosette formations as clearly seen in the SEM images of (Fig. 3a(III)).
Another explanation may be associated with the differences in shear stress and metabolic conditions. Perni and Prokopovich51 found that bacteria primarily adhere to valleys rather than the tops of cones, as anticipated in biofilm formation due to lower shear rates and removal forces in the valleys under fluid flow. To investigate the last hypothesis, finite element simulations were performed that allowed us to rank the surfaces according to two factors, (1) the average shear stress imposed on the bacteria, and (2) the average availability of nutrients to the bacteria growing on the surfaces Fig. 4. In Fig. 4a, the schematic graph shows the simulated properties, the average shear stress felt by the bacteria growing on different surfaces, and the nutrient concentration available for the bacteria on the surfaces. It can be seen clearly in Fig. 4b that the cells growing on the pit surfaces are exposed to the lowest shear stress, whereas cells growing on the planar surfaces experience the highest shear stress, slightly higher than cells growing on the pillar surfaces. The availability of nutrients is modelled in Fig. 4c, where the saturation concentration of oxygen at the surface level is shown for the three surfaces. Oxygen was used for simplicity, as diffusion coefficients for oxygen in water are well known. Other nutrients will only differ by having other diffusivities and reaction rates. The oxygen concentration is set to a reference value at the inlets to the micro channels, and the concentration is monitored after a certain amount of time, when equilibrium is reached between the supply of fresh oxygen in the flow channel and the uptake of oxygen by the bacteria cells on the surface. For simplicity, an equal consumption (reaction rate) over the entire unit cell surface for each of the three surfaces was assumed. Thus, this simulation predicts that the pit surfaces will have the largest consumption of nutrients (oxygen), but only slightly higher than the pillar surfaces. This is clearly correlated with the surface area factor, although nutrients supply by diffusion is not straightforward in complicated geometries like the honeycomb structures used here. The simulation results corroborate the observations that the pit surface support the strongest bacteria growths. This surface has the largest area, allowing for the largest uptake of nutrients, while simultaneously, the bacteria growing on this surface are best protected from shear stress imposed by the liquid flow.
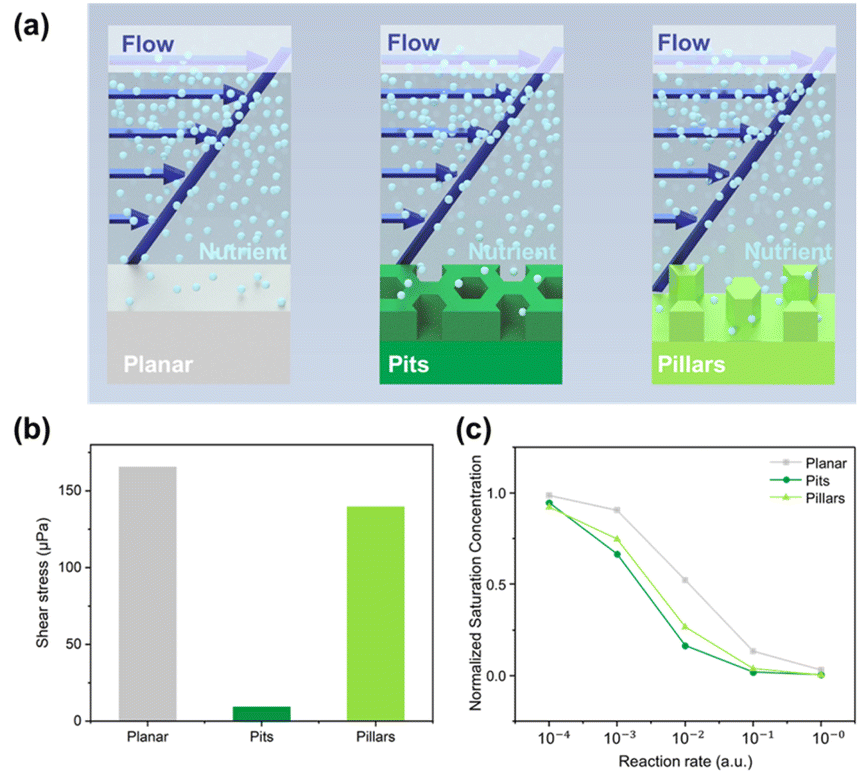 | ||
| Fig. 4 Finite element simulations of shear stress and nutrient concentration for the flow in the microfluidic channels. (a) Unit cell geometries for the planar reference surface, pit array surface, and pillar array surface constructed for the simulations. (b) Calculated average shear stress on the three surfaces. (c) Simulation of nutrient concentration investigated with a series of different reaction rates in arbitrary units representing consumption of nutrients by the bacteria. | ||
Discussion
This study has investigated correlations between surface topographies of micro-fabricated polymeric surfaces, Phaeobacter inhibens biofilm growth on these surfaces, and the biosynthesis of TDA. The two micro-fabricated honeycomb surfaces differed on two geometrical parameters, (1) the polarity, (one being a hexagonal pit array surface and the other a hexagonal pillar array surface), and surface area, with surface area factors of 3.2 and 2.2 for the pit-array and the pillar array respectively. The performance of the two micro-fabricated surfaces were compared and bench-marked against an unstructured planar surface. Regarding biofilm formation, the micro-pit array surfaces were found to best support growth of biomass. This observation is further corroborated by finite element simulations that show a relatively much lower average shear stress for this surface when compared to the micro-pillar surface and the planar reference surface. Also, the simulation of nutrient consumption seems to favour the micro-pit surface over the two other topographies. The relative area surface is largest for the micro-pit surface, and the average consumption of nutrients is accordingly highest for this surface. Quite surprisingly, the significantly largest biosynthesis of TDA was supported by the micro-pillar surface. Hence, the biosynthesis by the bacteria growing on the pillar surface, cannot simply be explained by flow conditions and supply of nutrients, and further do not seem simply to correlate with the amount of bacterial biomass. This empirical observation of TDA biosynthesis must thus be explained by biological mechanisms, and may be correlated with aggregation of rosettes in the biofilm, as also qualitatively supported by SEM images. The formation of rosettes by roseobacters facilitates their biofilm formation and in TDA producing bacteria, also the production of TDA.16,50 It is not known if it is the rosette formation per se or the biofilm formation that enhances bacterial TDA production and given their inter-connection this can be difficult to disentangle. The present study indicates that the rosette formation is a key driver in inducing TDA production.The tested surfaces were micro-fabricated on a thermoplastic materials platform that will allow upscaling of fabrication either by industrial scale injection moulding, or roll-to-roll fabrication of polymer films.52 Such surfaces may then be inserted into filter elements for closed loop aquacultures or breeding tanks for fish larvae that have not yet developed an immune system. A practical application of this research will require large-scale implementation in fish farms, and while polymer materials are ideal for scaling production, specific polymer materials should be investigated with respect to properties, fabrication requirements, and economy factors.
Author contributions
AD: investigation, formal analysis, visualization. YL: investigation, formal analysis, visualization, writing original draft, writing – review & editing. XFF: investigation, writing, review, and editing. CS: methodology, supervision, resources. MD: software, visualization. JCA: investigation, formal analysis. MLS: formal analysis. PJK: methodology, supervision, writing – review & editing. LG: conceptualization, funding acquisition, methodology, resources, supervision, validation, writing – review & editing. RT: conceptualization, funding acquisition, methodology, resources, supervision, validation, wring original draft, visualization, writing – review & editing.Conflicts of interest
There are no conflicts to declare.Acknowledgements
The authors wish to acknowledge funding from Novo Nordisk Foundation (grant #: NNF19OC0055625) for the infrastructure “Imaging microbial language in biocontrol (IMLiB)”, and from the “Exploratory Interdisciplinary Synergy Programme 2021” with grant #: NNF21OC0070817 for the project “R2R fabrication of pro-bacterial surfaces (R2R ProBac)”. MLS and LG were also supported by a grant from the Danish National Research Foundation [DNRF137]. Finally, the authors acknowledge access to cleanroom facilities and electron microscopy facilities at DTU Nanolab.References
- K. Holmstrom, S. Graslund, A. Wahlstrom, S. Poungshompoo, B. E. Bengtsson and N. Kautsky, Int. J. Food Sci. Technol., 2003, 38, 255–266 CrossRef CAS.
- T. Defoirdt, P. Sorgeloos and P. Bossier, Curr. Opin. Microbiol., 2011, 14, 251–258 CrossRef PubMed.
- P. W. D’Alvise, S. Lillebo, M. J. Prol-Garcia, H. I. Wergeland, K. F. Nielsen, O. Bergh and L. Gram, PLoS One, 2012, 7(8), 43996 CrossRef PubMed.
- B. B. Rasmussen, K. E. Erner, M. Bentzon-Tilia and L. Gram, Microb. Biotechnol., 2018, 11, 1070–1079 CrossRef CAS PubMed.
- N. L. Brock, A. Nikolay and J. S. Dickschat, Chem. Commun., 2014, 50, 5487–5489 RSC.
- H. F. Geng and R. Belas, J. Bacteriol., 2010, 192, 4377–4387 CrossRef CAS PubMed.
- J. E. Tesdorpf, A. U. Geers, M. L. Strube, L. Gram and M. Bentzon-Tilia, Appl. Environ. Microbiol., 2022, 88(6), e0241821 CrossRef PubMed.
- M. Prol-Garcia and J. Pintado, Mar. Biotechnol., 2013, 15, 726–738 CrossRef CAS PubMed.
- N. Henriksen, L. L. Lindqvist, M. Wibowo, E. C. Sonnenschein, M. Bentzon-Tilia and L. Gram, FEMS Microbiol. Rev., 2022, 46 Search PubMed.
- C. H. Porsby, M. A. Webber, K. F. Nielsen, L. J. V. Piddock and L. Gram, Antimicrob. Agents Chemother., 2011, 55, 1332–1337 CrossRef CAS PubMed.
- B. B. Rasmussen, T. Grotkjaer, P. W. D'Alvise, G. L. Yin, F. X. Zhang, B. Bunk, C. Sproer, M. Bentzon-Tilia and L. Gram, Appl. Environ. Microbiol., 2016, 82, 4802–4810 CrossRef CAS PubMed.
- Y. Duan, M. Petzold, R. Saleem-Batcha and R. Teufel, ChemBioChem, 2020, 21, 2384–2407 CrossRef CAS PubMed.
- M. Z. Wilson, R. Wang, Z. Gitai and M. R. Seyedsayamdost, Proc. Natl. Acad. Sci. U. S. A., 2016, 113, 1630–1635 CrossRef CAS PubMed.
- P. G. Beyersmann, J. Tomasch, K. Son, R. Stocker, M. Goker, I. Wagner-Dobler, M. Simon and T. Brinkhoff, Sci. Rep., 2017, 7, 730 CrossRef PubMed.
- P. W. D'Alvise, O. Magdenoska, J. Melchiorsen, K. F. Nielsen and L. Gram, Environ. Microbiol., 2014, 16, 1252–1266 CrossRef PubMed.
- J. B. Bruhn, K. F. Nielsen, M. Hjelm, M. Hansen, J. Bresciani, S. Schulz and L. Gram, Appl. Environ. Microbiol., 2005, 71, 7263–7270 CrossRef CAS PubMed.
- L. C. Xu and C. A. Siedlecki, Acta Biomater., 2012, 8, 72–81 CrossRef CAS PubMed.
- M. Cloutier, D. Mantovani and F. Rosei, Trends Biotechnol., 2015, 33, 637–652 CrossRef CAS PubMed.
- A. V. Gulyuk, D. R. LaJeunesse, R. Collazo and A. Ivanisevic, Adv. Mater., 2021, 33, 2004655 CrossRef CAS PubMed.
- L. C. Hsu, J. Fang, D. A. Borca-Tasciuc, R. W. Worobo and C. I. Moraru, Appl. Environ. Microbiol., 2013, 79, 2703–2712 CrossRef CAS PubMed.
- X. Ge, Y. Leng, X. Lu, F. Z. Ren, K. F. Wang, Y. H. Ding and M. Yang, J. Biomed. Mater. Res., Part A, 2015, 103, 384–396 CrossRef PubMed.
- F. Ghilini, D. E. Pissinis, A. Minan, P. L. Schilardi and C. Diaz, ACS Biomater. Sci. Eng., 2019, 5, 4920–4936 CrossRef CAS PubMed.
- D. P. Linklater, V. A. Baulin, S. Juodkazis, R. J. Crawford, P. Stoodley and E. P. Ivanova, Nat. Rev. Microbiol., 2021, 19, 8–22 CrossRef CAS PubMed.
- X. X. Zhang, L. Wang and E. Levanen, RSC Adv., 2013, 3, 12003–12020 RSC.
- V. Carniello, B. W. Peterson, H. C. van der Mei and H. J. Busscher, Adv. Colloid Interface Sci., 2018, 261, 1–14 CrossRef CAS PubMed.
- W. Pajerski, J. Duch, D. Ochonska, M. Golda-Cepa, M. Brzychczy-Wloch and A. Kotarba, Mater. Sci. Eng., C, 2020, 113, 110972 CrossRef CAS PubMed.
- M. Ahmad, S. T. Liu, N. Mahmood, A. Mahmood, M. Ali, M. S. Zheng and J. R. Ni, Bioresour. Technol., 2017, 234, 360–369 CrossRef CAS PubMed.
- I. De-la-Pinta, M. Cobos, J. Ibarretxe, E. Montoya, E. Eraso, T. Guraya and G. Quindos, J. Mater. Sci.: Mater. Med., 2019, 30, 77 CrossRef PubMed.
- T. R. Scheuerman, A. K. Camper and M. A. Hamilton, J. Colloid Interface Sci., 1998, 208, 23–33 CrossRef CAS PubMed.
- R. S. Friedlander, H. Vlamakis, P. Kim, M. Khan, R. Kolter and J. Aizenberg, Proc. Natl. Acad. Sci. U. S. A., 2013, 110, 5624–5629 CrossRef CAS PubMed.
- R. E. Baier, J. Mater. Sci.: Mater. Med., 2006, 17, 1057–1062 CrossRef CAS PubMed.
- A.-K. Niebergall, S. Pfeiffer, C. Gruber, H. Sievers, A. Nies, A. Kehlen and B. Hiebl, Journal of Cellular Biotechnology, 2018, 3, 107–115 Search PubMed.
- N. Gupta, T. T. Gupta, K. Patel and P. Stoodley, Appl. Environ. Microbiol., 2022, 88(22), e0121722 CrossRef PubMed.
- A. Droumpali, J. Hubner, L. Gram and R. Taboryski, Micromachines, 2021, 12 Search PubMed.
- R. D. Boyd, J. Verran, M. V. Jones and M. Bhakoo, Langmuir, 2002, 18, 2343–2346 CrossRef CAS.
- K. A. Whitehead, J. Colligon and J. Verran, Colloids Surf., B, 2005, 41, 129–138 CrossRef CAS PubMed.
- T. Tolker-Nielsen, C. Sternberg, Methods and Protocols, 2014, vol.1149, pp. 615–629 Search PubMed.
- P. F. Ostergaard, J. Lopacinska-Jorgensen, J. N. Pedersen, N. Tommerup, A. Kristensen, H. Flyvbjerg, A. Silahtaroglu, R. Marie and R. Taboryski, J. Micromech. Microeng., 2015, 25, 105002 CrossRef.
- S. Tanzi, P. F. Ostergaard, M. Matteucci, T. L. Christiansen, J. Cech, R. Marie and R. Taboryski, J. Micromech. Microeng., 2012, 22(11), 115008 CrossRef.
- B. D. Chang, P. Leussink, F. Jensen, J. Hubner and H. Jansen, Microelectron. Eng., 2018, 191, 77–83 CrossRef CAS.
- J. Cech and R. Taboryski, Appl. Surf. Sci., 2012, 259, 538–541 CrossRef CAS.
- M. Matteucci, T. L. Christiansen, S. Tanzi, P. F. Ostergaard, S. T. Larsen and R. Taboryski, Microelectron. Eng., 2013, 111, 294–298 CrossRef CAS.
- N. Gadegaard, S. Mosler and N. B. Larsen, Macromol. Mater. Eng., 2003, 288, 76–83 CrossRef CAS.
- K. Ø. Andresen, M. Hansen, M. Matschuk, S. T. Jepsen, H. S. Sørensen, P. Utko, D. Selmeczi, T. S. Hansen, N. B. Larsen, N. Rozlosnik and R. Taboryski, J. Micromech. Microeng., 2010, 20 Search PubMed.
- E. Søgaard, N. K. Andersen, K. Smistrup, S. T. Larsen, L. Sun and R. Taboryski, Langmuir, 2014, 30, 12960–12968 CrossRef PubMed.
- T. Tolker-Nielsen and C. Sternberg, Current Protocols in Microbiology, 2011, 21, 1B CrossRef PubMed.
- A. Heydorn, A. T. Nielsen, M. Hentzer, C. Sternberg, M. Givskov, B. K. Ersboll and S. Molin, Microbiology, 2000, 146, 2395–2407 CrossRef CAS PubMed.
- P. W. D'Alvise, C. B. W. Phippen, K. F. Nielsen and L. Gram, Appl. Environ. Microbiol., 2016, 82, 502–509 CrossRef PubMed.
- E. Segev, A. Tellez, H. Vlamakis and R. Kolter, PLoS One, 2015, 10(11), 0141300 Search PubMed.
- J. B. Bruhn, L. Gram and R. Belas, Appl. Environ. Microbiol., 2007, 73, 442–450 CrossRef CAS PubMed.
- S. Perni and P. Prokopovich, Soft Matter, 2013, 9, 1844–1851 RSC.
- S. Murthy, M. Matschuk, Q. Huang, N. K. Mandsberg, N. A. Feidenhans'l, P. Johansen, L. Christensen, H. Pranov, G. Kofod, H. C. Pedersen, O. Hassager and R. Taboryski, Adv. Eng. Mater., 2016, 18, 484–489 CrossRef CAS.
Footnotes |
| † Electronic supplementary information (ESI) available. See DOI: https://doi.org/10.1039/d3ra05407a |
| ‡ Shown data is available in repository DTU data. See DOI: https://doi.org/10.11583/DTU.24514312 |
| This journal is © The Royal Society of Chemistry 2023 |