 Open Access Article
Novel H2S sensing mechanism derived from the formation of oligomeric sulfide capping the surface of gold nanourchins†
Hana Parka,
Su-Jin Yoonac,
Yun-Sik Namb,
Ji Yeong Leeb,
Yeonhee Lee b,
Jin Young Kimac and
Kang-Bong Lee
 *ac
*ac
aClimate and Environmental Research Institute, Korea Institute of Science & Technology, Hwarang-ro 14-gil 5, Seongbuk-gu, Seoul 02792, Republic of Korea. E-mail: leekb@kist.re.kr
bAdvanced Analysis and Data Center, Korea Institute of Science and Technology, Hwarangno 14-gil 5, Seongbuk-gu, Seoul 02792, Republic of Korea
cDepartment of Energy and Environment Technology, KIST School, University of Science and Technology, Seoul, 02792, Republic of Korea
First published on 8th November 2023
Abstract
A gold nanourchin (AuNU) probe with a novel sensing mechanism for monitoring H2S was developed as a feasible colorimetric sensor. In this study, AuNUs that are selectively responsive to H2S were fabricated in the presence of trisodium citrate and 1,4-hydroquinone using a seed-mediated approach. Upon exposure of the AuNU solution to H2S, the hydrosulfide ions (HS−) in the solution are converted into oligomeric sulfides by 1,4-hydroquinone used as a reducing agent during the synthesis of AuNUs. The oligomeric sulfides formed in the AuNU solution upon the addition of H2S were found to coat the surface of the AuNUs, introducing a blue shift in absorption accompanied by a color change in the solution from sky blue to light green. This colorimetric alteration by the capping of oligomeric sulfides on the surface of AuNUs is unique compared to well-known color change mechanisms, such as aggregation, etching, or growth of nanoparticles. The novel H2S sensing mechanism of the AuNUs was characterized using UV-Vis spectroscopy, high-resolution transmission microscopy, X-ray photoelectron spectroscopy, surface-enhanced Raman spectroscopy, secondary ion mass spectroscopy, liquid chromatography-tandem mass spectrometry, and atom probe tomography. H2S was reliably monitored with two calibration curves comprising two sections with different slopes according to the low (0.3–15 μM) and high (15.0–300 μM) concentration range using the optimized AuNU probe, and a detection limit of 0.29 μM was obtained in tap water.
1 Introduction
H2S is a potentially fatal substance in the workplace and for workers in many industries, including farms, oil refineries, and sewage treatment. Low-level exposure to H2S usually causes irritation of the mucous membrane and skin, whereas high-level exposure causes fatal toxicity. H2S is readily water-soluble and exists as a hydrosulfide ion (HS−) in aqueous solutions with pH 6–12.1–5Although U.S. Environmental Protection Agency has not established a standard for H2S, the U.S. Occupational Safety and Health Administration has set an 8 h average professional standard of 20 ppm. The World Health Organization suggests that H2S gas concentrations should not exceed a 7 μg m−3, average over a half hour period.6–9
Various instrumental analysis methods such as flow injection analysis,10 ion exchange chromatography (IC) 11, electrochemical methods,12–14 ultra-performance liquid chromatography-tandem mass spectrometry (LC-MS/MS),15,16 and fluorometry17 have been employed to analyze the concentration of H2S. However, these analytical techniques generally require the use of state-of-the-art analytical apparatus and laborious sample pre-treatment, and must be performed by well-trained experts. This has motivated the recent development of several original and innovative nanoparticle probes for H2S detection.
Gold and silver nanoparticles (AuNPs and AgNPs) are commonly used in chemical sensors for H2S; in particular, colorimetric analysis using these nanoparticles is common because of facile, cost-efficient manufacturing, and the user-friendliness of colorimetric analysis.18–25 Visual sensing using AuNPs/AgNPs for H2S in aqueous systems involves mechanisms based on aggregation,26 etching,27 or growth28 of nanoparticles. In addition to the colorimetric sensing mechanisms of AuNPs established to date, a novel mechanism using gold nanourchins (AuNUs) was found for the detection of H2S in this study. In seed-mediated synthesis using dual reducing agents, citrate and 1,4-hydroquinone were used together to generate an urchin morphology of AuNP with multiple-tips on the {111}, {200}, {220} and {311} crystalline faces.29
In this study, the AuNU solution was exposed to H2S existing as HS− in aqueous solutions, as described above. Hydrosulfides spontaneously form oligomeric sulfides by reacting with 1,4-hydroquinone, which is used as a reducing agent in the synthesis of AuNUs (see below).30,31
| 1,4-Hydroquinone + O2 → O2˙− + 1,4-semiquinone˙− + 2H+ | (1) |
| HS− + 1,4-semiquinone˙− → HS˙ + 1,4-benzoquinone | (2) |
| HS˙ → S˙− + H+ | (3) |
| 2S˙− → S22− | (4) |
| S˙− + S2˙− → S32− | (5) |
Superoxide (O2˙−) is formed during the oxidation of 1,4-hydroquinone to a 1,4-semiquinone anion radical (eqn (1)). This radical reduces hydrosulfide to a hydrosulfide radical (eqn (2)), which initiated the formation of oligomeric sulfides (Sn2−) with various chain lengths (n = 1–9) (eqn (3)–(5)).
The colorimetric change mechanism in the AuNUs upon the addition of H2S is unique compared to those in nanoparticles due to the aggregation, etching, or growth of AuNPs,26–28 based on UV-Vis absorption. The H2S sensing mechanism of the AuNUs was characterized using UV-Vis spectroscopy, high-resolution transmission electron microscopy (HR-TEM), X-ray photoelectron spectroscopy (XPS), surface-enhanced Raman spectroscopy (SERS), LC-MS/MS, time-of-flight secondary ion mass spectroscopy (TOF-SIMS), and atom probe tomography (APT). The color-change mechanism in the AuNU solution upon the addition of H2S should be investigated to determine the origin of the localized surface plasmon resonance (LSPR) frequency perturbation in a manner different from that of the conventional sensing mechanism.
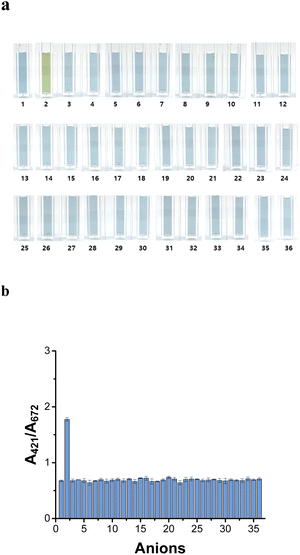
The AuNUs responded selectively to H2S, as indicated by a clear change in the color of the solution from sky blue to light green. In addition, none of the studied metal cations or anions interfered with the H2S monitoring. The prepared AuNU probe for H2S was optimized with respect to pH, temperature, and salt concentration. Additionally, the limits of detection (LOD) and linearity were determined. We concluded that this optimized AuNU probe could be employed as a simple and practical system for real-time H2S detection owing to its high capacity for H2S sensing.
2 Materials and methods
2.1 Chemicals and reagents
Hydrogen tetrachloroaurate (III) trihydrate (HAuCl4·3H2O), trisodium citrate (TSC) and H2S were purchased from Sigma-Aldrich (St. Louis, MO, USA). The anions F−, Cl−, Br−, I−, NO2−, NO3−, SO42−, ClO3−, ClO2−, ClO4−, BrO3−, CH3COO−, C2H5COO−, C4H7O2−, C8H4O42−, Cr2O27−, C6H5O73−, NaSCN−, CO32−, PO43−, S2O82−, SCN−, C6H8O42−, C6H5COO−, C2H4O2(COO)22−, C4H3O53−, C3H2O42−, C2H4(COO)22−, C2H5COO−, C3H4O32−, HCOO−, (C2O4)2−, SiO32−, C2H3O3− and CN− were purchased from AccuStandard (New Haven, CT, USA). HCl, NaOH and 1,4-hydroquinone were purchased from Samchun Chemical (Gyeonggi-do, Republic of Korea). Double distilled water was obtained from a Milli-Q water purifier (Millipore, Billerica, MA, USA). To examine the usability of the probe, tap, pond and waste water samples were obtained from the laboratory, pond and clarifier tanks, respectively at the Korea Institute of Science and Technology (KIST) campus.2.2 Instruments and analyses
The absorption spectra of the AuNU solutions in the wavelength range of 200–900 nm were measured using a UV-Vis spectrophotometer (S-3100, Scinco, Republic of Korea). The pH was measured using an HI 2210 pH meter (Hanna Instruments, Woonsocket, RI, USA). The H2S concentrations in the water samples were analyzed using IC (Metrohm, Ionenstrasse, Herisau, Switzerland). Particle size distribution was evaluated using dynamic light scattering (DLS; Zetasizer, Malvern Instruments, Worcestershire, UK). XPS characterization of the Au–Au and Au–S bonds of the oligomeric sulfides was carried out using a PHI 5000 VersaProbe III system (ULVAC-PHI, Chigasaki, Japan).The physico-chemical properties of the polymeric chain coated on the surface of the AuNUs were evaluated in the wavenumber range of 100–1800 cm−1 using a Raman spectrometer (LabRam Aramis, Horiba, Kyoto, Japan) with either a 633 nm or 785 nm diode laser power below 1 mW as the source. The LabSpec 4.16 software was used for Raman peak analysis and deconvolution of the spectra.
The morphologies, surfaces and diameters of the AuNUs and AuNUs with H2S (AuNUs-H2S) were evaluated using HR-TEM (CM30, Philips, NC, USA). TOF-SIMS was used to characterize molecular chain capping on the surface of the AuNUs.
The analytes were identified by LC-MS/MS on a Waters ACQUITY UPLC system coupled to a Waters SYNAPT G2-Si quantitative time-of-flight mass spectrometer equipped with an electrospray ionization source (Waters Corporation, Milford, MA, USA). The samples were measured in positive mode.
APT offers both 3D imaging and chemical composition measurements at the atomic scale and was performed using a LEAP 4000X HR™ system (Ametek Inc., Berwyn, PA, USA). HR-TEM and APT samples were prepared using the precipitates of AuNUs and AuNUs-H2S, and the solvent was subsequently evaporated. The APT specimens were further processed by annular milling using a dual beam focused ion beam (FIB; Nova Nanolab 600; Thermo Fisher Scientific, Waltham, MA, USA). An LC-MS/MS instrument (Waters, Manchester, UK) was used to characterize the structure of the polymer chain formed in the AuNUs upon the addition of H2S.
2.3 Synthesis of AuNUs
AuNUs were synthesized using the seed-mediated growth method.32 Spherical Au nanoseeds were fabricated by citrate reduction of HAuCl4. A 100 mM HAuCl4 aqueous solution was prepared by dissolving HAuCl4 (2 g) in double distilled water (50 mL). The HAuCl4 solution (150 μL) was mixed in a flask with deionized water (60 mL) under vigorous stirring, and boiling. After boiling, a 1% aqueous sodium citrate solution (1 mL) was immediately added, and the solution was boiled until its color changed to wine red. The solution was then cooled by stirring to form seed solution. The growth solution was prepared by adding aqueous HAuCl4 (100 mM, 50 μL) to distilled water (19.2 mL) under vigorous stirring. Then, Au nanoseeds (100 μL), 1% sodium citrate (44 μL), and 1,4-hydroquinone (30 mM, 2 mL) were sequentially added to the solution. The solution was stirred at 25 °C for 30 min to obtain Au nanourchins with multiple tips (Fig. S1†).332.4 Optical sensing of H2S in real samples
To evaluate the practical application of the newly designed probe, the concentrations of H2S in tap water, pond water, and waste water obtained from KIST were monitored. A standard H2S solution was added to tap water and pond water samples to obtain the H2S concentrations of 150 μM and 300 μM, but waste water was used intact without addition of H2S. The concentration of H2S in the samples was measured using the AuNU solution (1000 μL). The H2S concentrations measured by the AuNUs were validated using IC.3 Results and discussion
3.1 Optical properties, stabilities, and morphologies of AuNUs and AuNUs-H2S
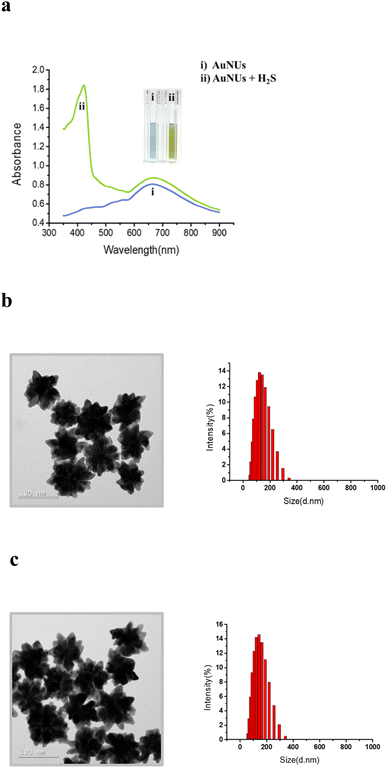
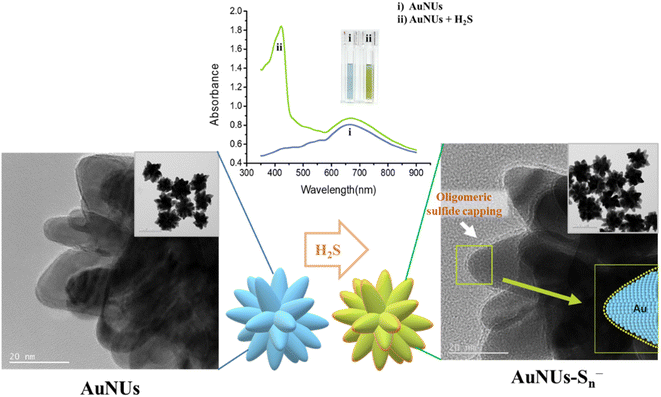
AuNUs with a size of approximately 115 nm were synthesized using the seed-mediated growth method, and Au nanoseeds were fabricated by reducing of HAuCl4 with trisodium citrate. The wavelength of the maximum LSPR peak of the AuNUs was 672 nm, and an additional LSPR peak appeared at 421 nm for AuNUs-H2S with a size of ∼122.1 nm, introducing a unique absorption accompanied by a color change from sky blue to light green (Fig. 1a). This color change of the AuNUs occurred only upon H2S addition; that is, other anions did not interfere (see below). The UV-Vis spectra for AuNUs and AuNUs-H2S are shown in the range of 350–900 nm (Fig. 1a), because highly intense UV-Vis absorbance is observed for H2S and 1,4-hydroquinone in the 200–350 nm range (Fig. S2†). Furthermore, the absorbances of the AuNU solution at 672 nm and the AuNU-H2S solution at 421 nm were measured to evaluate its long-term stability for at least 4 weeks, and the results indicated that the AuNUs and the AuNUs-H2S were relatively stable within ±3% (Fig. S3†).Colorimetric changes in nanoparticle solutions upon the addition of specific chemicals have been known to be due to the aggregation, etching, or growth of nanoparticles.26–28 However, examination of the HR-TEM images and particle size distributions (Fig. 1b and c) showed that the morphology and particle size of AuNUs-H2S did not differ from those of AuNUs. Therefore, it could be deduced that an unrecognized mechanism caused colorimetric and UV-Vis spectral change in AuNUs-H2S relative to those of the AuNU solution. Investigation of the structural changes in the AuNUs upon H2S addition showed that the AuNU surface was capped by a polymeric chain, as indicated by the HR-TEM image in the expanded region on the lower right of Scheme 1. Accordingly, the structure of the molecular chain coating on the surface of AuNUs should be characterized.
3.2 Mechanism of H2S sensing by AuNUs
Colorimetric sensing probes using nanoparticles rely on the variations in the interparticle distance and the morphological change of the nanoparticles that result in both LSPR spectral shifts and color changes. The aggregation of nanoparticles induced by the presence of the target analyte changes the interparticle distance and forms the basis of colorimetric assays.26 The growth reaction and etching of nanoparticles are known to be additional colorimetric sensing mechanisms arising from morphological changes.27,28It was initially predicted that AuNUs could be applied as a feasible and selective color sensor owing to an LSPR peak shift causing changes in their morphology. Because AuNUs have multiple tips with high crystal energies, it was assumed that their color change originated from morphological changes caused by anion etching.34,35 However, the intensity of the strong absorption band of the AuNUs at 672 nm did not decrease upon addition of H2S, and an additional high-intensity peak at 421 nm appeared with no concomitant decrease in the absorbance intensity at 672 nm. This new band reflected a chemical change at the AuNU surface rather than a morphological transformation of the AuNUs. Thus, the aforementioned polymeric coatings, having formed on the surface of the AuNUs-H2S and observed using HR-TEM, appeared to induce a colorimetric change in the AuNU solution from sky blue to light green (Scheme 1).
3.3 Spectroscopic characterization for the surface of the AUNUs-H2S
Upon addition to the aqueous AuNU solution, H2S was immediately ionized to HS− at neutral pH,36,37 and the hydrosulfide ions were spontaneously converted to hydrosulfide radicals using a 1,4-hydroquinone catalyst, which was used as the reducing agent in the synthesis of AuNUs.30,38 These hydrosulfide radicals dissociated into sulfide radicals, which further oligomerized to form oligomeric sulfides. The surface of the AuNUs was likely coated with this oligomeric sulfide and stabilized through Au–S bonding. The oligomeric sulfide capping on the surface of the AuNUs was displayed on the periphery of the cone with AuNU–Sn− (inset on the right-hand side of Scheme 1).This oligomeric sulfide chain capping the surface of the AuNUs appeared to be maintained through Au–S bonding, and it was confirmed by XPS. Wide-scan XPS spectra of the AuNUs and AuNUs-H2S were recorded to examine the variations in Au 4f (Fig. 2a). The two Au 4f binding energies, representing the Au 4f7/2 (84.0 eV) and Au 4f5/2 (87.7 eV) states, exhibited peaks in the XPS spectrum of the AuNUs, which were ascribed to metallic Au. The much smaller XPS peaks of the Au 4f7/2 (84.1 eV) and Au 4f5/2 (87.8 eV) states in AuNUs-H2S suggested that Au was bound to sulfur (Fig. 2b). These electron-rich sulfur atoms gave rise to a 0.1 eV shift to higher energies of the Au 4f doublets, thus providing XPS validation for the coordination between the Au and S atoms.39,40
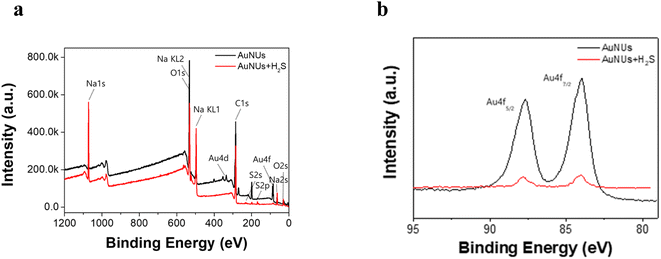 | ||
| Fig. 2 (a) Wide-scan XPS spectra of AuNUs (black) and AuNUs-H2S (red). (b) XPS Au4f spectra of AuNUs (black) and AuNUs-H2S (red) at pH 4.0 and 25 °C in 20 mM NaCl. | ||
The sensitivity of the SERS peak with respect to the interactions at the surface of plasmonic nanoparticles makes it particularly suitable for structural investigations of molecular chains in contact with nanoparticles.41,42 AuNUs with sharp edges and tips exhibit highly sensitive SERS signals upon chemical enhancement due to electron transfer to the AuNUs, as well as large electromagnetic enhancements around the AuNUs when forming Au–S bonds.43
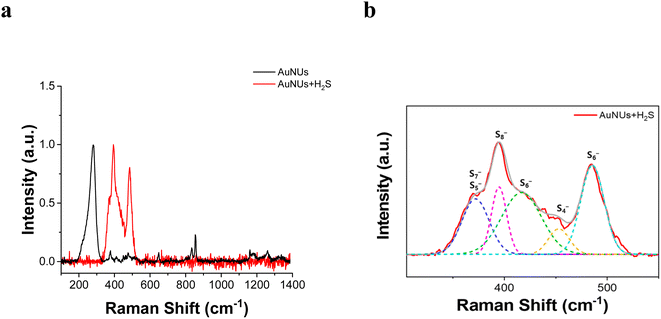
Thus, the chemical structure of the oligomeric chains capping the surface of the AuNUs was characterized using SERS peaks. The SERS peaks for the molecular chains appeared in the 300–550 cm−1 frequency range corresponding to the S–S stretching vibration (Fig. 3a), and these peaks were deconvoluted using LabSpec 4.16 software (Fig. 3b). Raman scattering peaks at 363, 394, 419, and 485 cm−1 appear to originate from the sulfide bonds of AuS4−, AuS5−, AuS6−, AuS7−, and AuS8−.44,45 Therefore, these SERS peaks revealed that the molecular chains in contact with the surface of the AuNUs contained various oligomeric sulfides bound to Au.
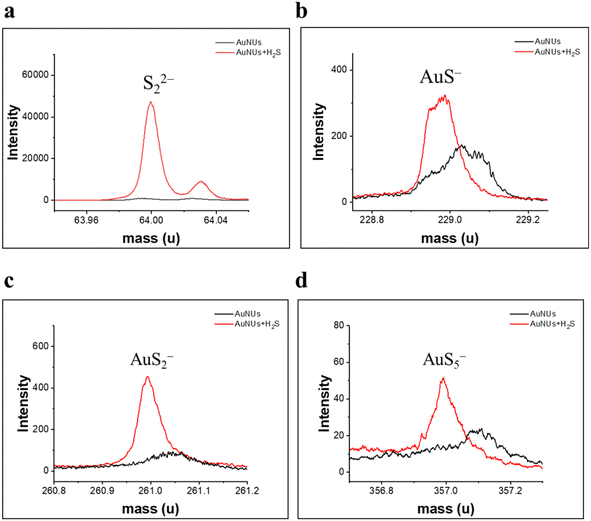
Moreover, TOF-SIMS analysis has previously been applied to characterize oligomeric sulfides coated on the surface of AuNUs.46,47 Specific fragment ions (S22−, AuS−, AuS2−, and AuS5−), found in the TOF-SIMS spectra of the AuNUs-H2S solution (Fig. 4), verify that the H2S added to the AuNU solution was oligomerized to AuSn− by the 1,4-hydroquinone catalyst, as described in the reaction mechanism (eqn. (1)–(5)).
The oligomeric chains capping the surface of the AuNUs were further identified using LC-MS/MS, which enables the detection of oligomeric sulfides of various lengths.48,49 The LC chromatograms and MS spectra of AuNUs-H2S (Fig. 5) indicated that the polymeric chains were oligomeric sulfides, namely AuSn− (n = 1–9). Characteristic mass fragments associated with oligomeric sulfide formation were also found in trace amounts of Au2Sn (n = 1–9) (not shown).
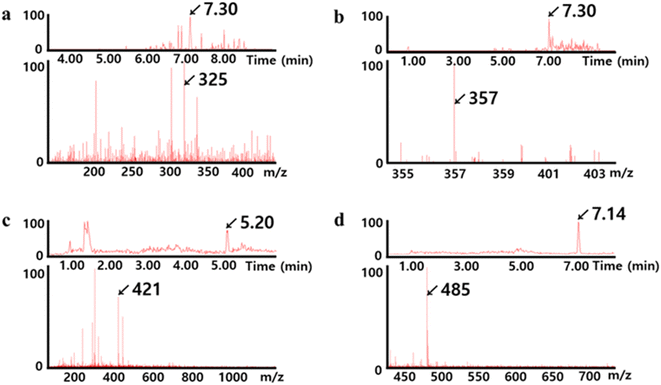 | ||
| Fig. 5 LC chromatograms (above) and MS spectra (below) for (a) AuS4−, (b) AuS5−, (c) AuS7−, and (d) AuS9− showing Au–Sn− associated with the oligomeric sulfide coated on the surface of AuNUs. | ||
APT is a well-established analytical technique for imaging the 3D structure and chemical constituents of materials at the atomic level in conjunction with FIB sample preparation methods. APT was employed to investigate the changes in certain elements and compounds on the surface of AuNUs upon the addition of H2S. APT images of the AuNUs and AuNUs-H2S were compared to confirm the presence of sulfide compounds capping the AuNU surface (Fig. 6).50,51 An FIB instrument was used to selectively taper the micron-sized samples acquired from the AuNUs and AuNUs-H2S. The 3-D chemical map displayed the distribution of Au on the surface of the AuNUs in the absence of H2S, whereas sulfide compounds are distinctly observable in the chemical map of AuNU-H2S (Fig. 6).
 | ||
| Fig. 6 Associated 3D chemical map of the volume containing a partial section of (a) AuNUs and (b) AuNUs-H2S (pH 4.0, 25 °C, and 20 mM NaCl) at near-atomic resolution. | ||
3.4 Optimized conditions for obtaining high sensitivity of AuNUs
The sensitivity of the probe to H2S was studied by varying the pH, temperature, and salt concentration. The highest absorbance ratio (A421 nm/A672 nm) was the index chosen to determine the optimal conditions (pH, temperature, and NaCl concentration) for probe sensitivity. Optimal H2S probe sensitivity was obtained at a solution pH of 4.0 (Fig. S4a†).The sensitivity of the AuNU probe was tested as a function of temperature, and it was confirmed that the A421 nm/A672 nm ratio did not change as the temperature increased from 15 to 55 °C in 5 °C intervals (Fig. S4b†). Therefore, 25 °C was arbitrarily chosen as the optimal temperature.
The absorbance ratio (A421 nm/A672 nm) of the AuNU solution in the presence of H2S was monitored at various NaCl concentrations and did not change as the NaCl concentration increased from 20 to 120 mM; thus, 20 mM NaCl was arbitrarily chosen as the buffer (Fig. S4c†). Hence, for H2S added to the AuNU solution probe, the optimal conditions for the AuNU solution probe were selected as pH 4.0, 25 °C and 20 mM NaCl buffer (Fig. S4†).
The reaction kinetics of the AuNUs were studied with various concentrations of H2S by measuring the UV-Vis absorbance ratio (A421 nm/A672 nm). Immediately upon the addition of H2S to the AuNU solution, oligomeric sulfides on the surface of the AuNUs were completely formed at approximately 40 s, regardless of the H2S concentration (Fig. S5†).
3.5 H2S selectivity of AuNUs
The H2S selectivity of the AuNU probe was investigated using various anions, namely F−, Cl−, Br−, I−, NO2−, NO3−, SO42−, ClO3−, ClO2−, ClO4−, BrO3−, CH3COO−, C2H5COO−, C4H7O2−, C8H4O42−, Cr2O27−, C6H5O73−, CO32−, PO43−, S2O82−, SCN−, C6H8O42−, C6H5COO−, C2H4O2(COO)22−, C4H3O53−, C3H2O42−, C2H4(COO)22−, C2H5COO−, C3H2O32−, HCOO−, (C2O4)2−, SiO32−, C2H3O3−, and CN− at concentration of 1.5 mM. Notably, 0.15 mM H2S induced color variation in the AuNU solution, and no colorimetric changes were observed upon the addition of the other anions (Fig. 7a).The absorbance ratio (A421 nm/A672 nm) of the AuNU solution containing each anion was measured to determine the selectivity of the optimized AuNU probe toward various anions (Fig. 7b). The absorbance (A421 nm) of the AuNUs upon H2S addition increased considerably, whereas the absorbance (A672 nm) of the AuNU-H2S did not decrease. This indicates that the variation in the UV-Vis peaks is not due to conventional mechanisms such as aggregation, etching, or growth of nanoparticles. Rather, it was attributed to the morphological changes caused by the unique formation of oligomeric sulfides on the surface of the AuNUs, which gave rise to a remarkably high absorbance ratio (A421 nm/A672 nm). The absorbance ratio was approximately four times greater than that obtained upon the addition of other anions, demonstrating that a molecular chain on the surface of the AuNUs was not formed upon the addition of other anions.
The H2S selectivity of the AuNU probe was further tested upon addition of diverse metal ions (Fig. S6†) and some sulfur compounds (cysteine, dithiothreitol, 1-thioglycerol, and 2-thiophenecarboxaldehyde) (not shown) at 1.5 mM; the developed AuNU probe exhibited excellent selectivity toward H2S and no reaction to the metal ions.
3.6 Quantitative analysis of H2S using AuNUs
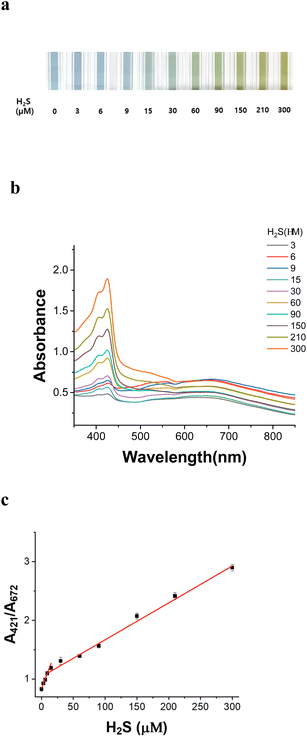
The color variation caused by H2S in the AuNU solution is related to the quantity of H2S as indicated by UV-Vis spectroscopy. The color of the AuNU solution gradually changed from sky blue to light green with increasing H2S concentration (Fig. 8a). To evaluate the measurement error, the absorbance ratio (A421 nm/A672 nm) was observed upon the gradual addition of H2S (0–300 μM) in AuNUs (three times at each H2S concentration) (Fig. 8b). A linear regression analysis was performed. And two calibration curves with good linearity were obtained in the concentration range of 0.3–15 μM (r2 = 0.9984) and 15.0–300 μM (r2 = 0.9954) (Fig. 8c). It was believed that a lower amount of H2S on the AuNUs added to the AuNUs facilitated the formation of oligomeric sulfides in the AuNU solution, which increased the slope (response or sensitivity). The LOD was determined according to the 3σ/m criterion in the calibration plot, with H2S concentration in the range of 0.3–15 μM. Corresponding to a standard deviation (σ) of 0.084 and a calibration plot slope (m) of 0.85365, the LOD for this novel probe was estimated to be 0.29 μM in the tap water sample.3.7 Usability of the AuNU probe in real samples
To demonstrate the applicability of the AuNU probe, we measured its absorbance intensities in the tap and pond water samples spiked with 150.0 and 300.0 μM H2S and in a real waste-water sample with unknown H2S concentration. The H2S concentration in the water samples determined using the AuNU probe was in good agreement with the amount of H2S added to the water samples, as well as with concentrations determined using IC (Table 1). Hence, the AuNU probe developed for H2S detection may be superior to IC instruments in terms of analytical cost, operational simplicity, and expertise required. In addition, the sensing mechanism of the AuNU-based assay for H2S differed from that of other conventional probes (Table 2).| Amount of H2S added to real samples (n = 6) | |||||||||
|---|---|---|---|---|---|---|---|---|---|
| AuNUs colorimetric probe | IC | ||||||||
| Sample | Concentration (μM) | Detected concentration (μM) | RSD (%) | Recovery (%) | Intraday analysisa | Interday analysisb | Detected concentration (μM) | ||
| RSD (%) | Accuracy (bias%) | RSD (%) | Accuracy (bias%) | ||||||
| a Intraday analysis: four replicates with 2 h interval.b Interday analysis: 1st, 3rd, and 5th day.c Tap water: spiked sample.d Pond water: spiked sample.e Waste water: real sample. | |||||||||
| Tap waterc | 150 | 148 ± 4.73 | 3.20 | 98.4 ± 3.15 | 3.41 | 8.77 | 5.11 | −1.72 | 152 |
| 300 | 302 ± 23.2 | 7.69 | 101 ± 7.75 | 7.12 | −2.27 | 6.95 | 2.83 | 298 | |
| Pond waterd | 150 | 140 ± 9.86 | 7.13 | 93.7 ± 6.57 | 6.87 | −4.31 | 5.23 | −2.19 | 146 |
| 300 | 290 ± 8.55 | 2.95 | 96.6 ± 2.85 | 3.48 | 2.58 | 4.01 | 2.81 | 303 | |
| Waste watere | Unknown | 189 ± 5.14 | 3.50 | 97.9 ± 3.43 | 4.65 | −1.22 | 3.76 | −0.93 | 192 |
| Nanoparticle probe | Sensing mechanism | Ligand or modified agents | Detection range | LOD | Ref. |
|---|---|---|---|---|---|
| a Thiolated azido derivates and active esters.b Carboxymethyl cellulose sodium.c Poly-polyhedral oligomeric silsesquioxane-formaldehyde.d Au/Ag coreshell nanoparticles. | |||||
| AuNPsa | Aggregation | AEa | 3–10 μM | 0.2 μM | 18 |
| AgNPs | Aggregation | Dopamine | 2–15 μM | 0.03 μM | 19 |
| AgNPs | Etching | Chitosan | 0.80–6.40 μM | 0.35 μM | 20 |
| AgNPs | Nanocluster | CMSb | 15 to 70 μM | 0.24 μM | 21 |
| Cu@Au NPs | Growth | Iodide | 0–1.5 μM | 0.3 μM | 22 |
| PPF-AgNPsc | Growth | PPFc | 0.7–10 μM | 0.2 μM | 23 |
| Au/AgI NPs | Etching | Dimeric nanoparticles | 0–80 μM | 0.5 μM | 24 |
| Au/Ag NPsd | Etching | Core–shell | 0.05–100 μM | 1.0 μM | 25 |
| AuNUs | Oligomeric sulfide capping | Oligomeric sulfide | 2.0–312.5 μM | 0.29 μM | This work |
4 Conclusions
In this study, we developed a novel AuNU nanoprobe for the feasible and selective colorimetric sensing of H2S. This H2S sensing probe is based on the formation of oligomeric sulfides on the surface of AuNUs, which manifests a new distinctive absorbance peak at 421 nm and changes the color of the AuNU solution from sky blue to light green. The mechanism of colorimetric alteration by oligomeric sulfide formation in AuNUs differs from conventional sensing mechanisms such as aggregation, etching, or growth of nanoparticles. This AuNU probe can determine H2S concentrations without interference from surrounding anions, providing a simpler H2S assay compared with previous nanoprobes functionalized with various ligands. The AuNU probe accurately determined H2S in real waste water samples and demonstrated a better performance than the IC instrument in terms of time, selectivity, convenience, and cost. The development of a smartphone-based colorimetric sensing method for H2S is currently underway.Conflicts of interest
The authors have no conflict of interest in the publication of this manuscript.Acknowledgements
This research was supported by the Korea Institute of Science and Technology with projects 2E31670 and 2E32432.References
- T. L. Guidotti, Internet J. Toxicol., 2010, 29, 569–581 CrossRef CAS PubMed.
- M. C. Shivanthan, H. Perera, S. Jayasinghe, P. Karunanayake, T. Chang, S. Ruwanpathirana, N. Jayasinghe, Y. D. Silva and D. Jayaweerabandara, J. Occup. Med. Toxicol., 2013, 8, 1–5 CrossRef PubMed.
- H. Kfir, S. Rimbrot and A. Markel, Int. J. Med., 2015, 108, 977–978 CAS.
- J. Jiang, A. Chan, S. Ali, A. Saha, K. J. Haushalter, W.-L. M. Lam, M. Glasheen, J. Parker, M. Brenner, S. B. Mahon, H. H. Patel, R. Ambasudhan, S. A. Lipton, R. B. Pilz and G. R. Boss, Sci. Rep., 2016, 6, 20831 CrossRef CAS PubMed.
- P. C. Ng, T. B. Hendry-Hofer, A. E. Witeof, M. Brenner, S. B. Mahon, G. R. Boss, P. Haouzi and V. S. Bebarta, J. Med. Toxicol., 2019, 15, 287–294 CrossRef PubMed.
- T. Ausma and L. J. De Kok, Front. Plant Sci., 2019, 10, 743 CrossRef PubMed.
- A. M. El-Melih, L. Iovine, A. A. Shoaibi and A. K. Gupta, Int. J. Hydrogen Energy, 2017, 42, 4764–4773 CrossRef CAS.
- K. Jones, Toxicol. Lett., 2014, 231, 374–377 CrossRef CAS PubMed.
- S. L. M. Rubright, L. L. Pearce and J. Peterso, Nitric Oxide, 2017, 71, 1–13 CrossRef PubMed.
- Y. J. Yuan and H. Kuriyama, Biotechnol. Lett., 2000, 22, 795–799 CrossRef CAS.
- W. Zgagacza, R. Zakrzewskia, K. Urbaniakb, G. Chwatkoa and A. Nowickia, J. Chromatogr. B, 2020, 1157, 122309 CrossRef PubMed.
- J. R. Hall and M. H. Schoenfisch, Anal. Chem., 2018, 90, 5194–5200 CrossRef CAS PubMed.
- M. D. Brown, J. R. Hall and M. H. Schoenfisch, Anal. Chim. Acta, 2019, 1045, 67–76 CrossRef CAS PubMed.
- T. J. Sherbow, G. M. Kuhl, G. A. Lindquist, J. D. Levine, M. D. Pluth, D. W. Johnson and S. A. Fontenot, Sens. Bio-Sens., 2021, 31, 100394 CrossRef PubMed.
- B. Tan, S. Jin, J. Sun, Z. Gu, X. Sun, Y. Zhu, K. Huo, Z. Cao, P. Yang, X. Xin, X. Liu, L. Pan, F. Qiu, J. Jiang, Y. Jia, F. Ye, Y. Xie and Y. Z. Zhu, Sci. Rep., 2017, 7, 46278 CrossRef CAS PubMed.
- L.-A. Lan, S.-Y. Wuc, X.-G. Meng, J.-J. Jiang, M.-Y. Zheng and G.-R. Fan, J. Chromatogr. A, 2020, 1625, 461243 CrossRef CAS PubMed.
- Y. Zhou, F. Mazur, K. Liang and R. Chandrawati, Chem.–Asian J., 2022, 17, e202101399 CrossRef CAS PubMed.
- Z. Yuan, F. Lu, M. Peng, C.-W. Wang, Y.-T. Tseng, Y. Du, N. Cai, C.-W. Lien, H.-T. Chang, Y. He and E. S. Yeung, Anal. Chem., 2015, 87, 7267–7273 CrossRef CAS PubMed.
- L. Zhao, L. Zhao, Y. Miao, C. Liu and C. Zhang, Sensors, 2017, 17, 626 CrossRef PubMed.
- K. Shanmugaraj and M. Ilanchelian, Microchim. Acta, 2016, 183, 1721–1728 CrossRef CAS.
- Y. Xue, L. Ma, L. Zhang, W. Zhao, Z. Li and Q. Li, Polymers, 2020, 12, 113 CrossRef CAS PubMed.
- J. Zhang, X. Xu, Y. Yuan, C. Yang and X. Yang, ACS Appl. Mater. Interfaces, 2011, 3, 2928–2931 CrossRef CAS PubMed.
- Y. Zhang, H.-Y. Shen, X. Hai, X.-W. Chen and J.-H. Wang, Anal. Chem., 2017, 89, 1346–1352 CrossRef CAS PubMed.
- J. Zeng, M. Li, A. Liu, F. Feng, T. Zeng, W. Duan, M. Li, M. Gong, C.-Y. Wen and Y. Yin, Adv. Funct. Mater., 2018, 28, 1800515 CrossRef.
- J. Hao, B. Xiong, X. Cheng, Y. He and E. S. Yeung, Anal. Chem., 2014, 86, 4663–4667 CrossRef CAS PubMed.
- S. Alizadeh and Z. Nazari, Chem. Rev., 2020, 2, 228–242 CAS.
- K. Kermanshahian, A. Yadegar and H. Ghourchian, Coord. Chem. Rev., 2021, 442, 213934 CrossRef CAS.
- N. T. K. Thanh, N. Maclean and S. Mahiddine, Chem. Rev., 2014, 114, 7610–7630 CrossRef CAS PubMed.
- J. Li, J. Wu, X. Zhang, Y. Liu, D. Zhou, H. Sun, H. Zhang and B. Yang, J. Phys. Chem. C, 2011, 115, 3630–3637 CrossRef CAS.
- K. R. Olson, Y. Gao and K. D. Straub, Int. J. Mol. Sci., 2021, 22, 961 CrossRef CAS PubMed.
- M. Hayyan, M. A. Hashim and I. M. AlNashef, Chem. Rev., 2016, 116, 3029–3085 CrossRef CAS PubMed.
- Y. Xia, K. D. Gilroy, H.-C. Peng and X. Xia, Angew. Chem., Int. Ed., 2017, 56, 60–95 CrossRef CAS PubMed.
- J. Li, J. Wu, X. Zhang, Y. Liu, D. Zhou, H. Sun, H. Zhang and B. Yang, J. Phys. Chem. C, 2011, 115, 3630–3637 CrossRef CAS.
- S. Lee, Y.-S. Nam, S.-H. Choi, Y. Lee and K.-B. Lee, Microchim. Acta, 2016, 183, 3035–3041 CrossRef CAS.
- S.-J. Yoon, Y.-S. Nam, H.-J. Lee, Y. Lee and K.-B. Lee, Sens. Actuators, B, 2019, 300, 127045 CrossRef CAS.
- E. Cuevasanta, M. Lange, J. Bonanata, E. L. Coitiño, G. Ferrer-Sueta, M. R. Filipovic and B. Alvarez, J. Biol. Chem., 2015, 290, 26866–26880 CrossRef CAS PubMed.
- J. Myszkowska, I. Derevenkov, S. V. Makarov, U. Spiekerkoetter and L. Hannibal, Antioxidants, 2021, 10, 1065 CrossRef CAS PubMed.
- K. R. Olson, A. Briggs, M. Devireddy, N. A. Iovino, N. C. Skora, J. Whelan, B. P. Villa, X. Yuan, V. Mannam, S. Howard, Y. Gao, M. Minnion and M. Feelisch, Redox Biol., 2020, 37, 101 Search PubMed.
- M.-C. Bourg, A. Badia and R. B. Lennox, J. Phys. Chem. B, 2000, 104, 6562–6567 CrossRef CAS.
- G. Greczynski and L. Hultman, Prog. Mater. Sci., 2020, 107, 100591 CrossRef CAS.
- R. W. Taylor, R. Esteban, S. Mahajan, J. Aizpurua and J. J. Baumberg, J. Phys. Chem. C, 2016, 120, 10512–10522 CrossRef CAS.
- M. V. Gorbachevskii, D. S. Kopitsyn, M. S. Kotelev, E. V. Ivanov, V. A. Vinokurov and A. A. Novikov, RSC Adv., 2018, 8, 19051–19057 RSC.
- J. Reguera, J. Langer, D. Jiménez de Aberasturi and L. M. Liz-Marzán, Chem. Soc. Rev., 2017, 46, 3866–3885 RSC.
- M. Hagen, P. Schiffels, M. Hammer, S. Dörfler, J. Tübke, M. J. Hoffmann, H. Althues and S. Kaskel, J. Electrochem. Soc., 2013, 160, A1205–A1214 CrossRef CAS.
- J. D. McBrayer, T. E. Beechem, B. R. Perdue, C. A. Apblett and F. H. Garzon, J. Electrochem. Soc., 2018, 165, A876–A881 CrossRef CAS.
- A. Marcus and N. Winograd, Anal. Chem., 2006, 78, 141–148 CrossRef CAS PubMed.
- Y.-P. Kim, H. K. Shon, S. K. Shin and T. G. Lee, Mass Spectrom. Rev., 2015, 34, 237–247 CrossRef CAS PubMed.
- S.-I. Bibli, B. Luck, S. Zukunft, J. Wittig, W. Chen, M. Xian, A. Papapetropoulos, J. Hu and I. Fleming, Redox Biol., 2018, 18, 295–304 CrossRef CAS PubMed.
- A. Schweighuber, M. Gall, J. Fischer, Y. Liu, H. Braun and W. Buchberger, Anal. Bioanal. Chem., 2021, 413, 1091–1098 CrossRef CAS PubMed.
- B. E. Janicek, J. G. Hinman, J. J. Hinman, S. H. Bae, M. Wu, J. Turner, H.-H. Chang, E. Park, R. Lawless, K. S. Suslick, C. J. Murphy and P. Y. Huang, Nano Lett., 2019, 19, 308–6314 CrossRef PubMed.
- K. Jang, S.-H. Kim, H. Jun, C. Jung, J. Yu, S. Lee and P.-P. Choi, Nat. Commun., 2021, 12, 4301 CrossRef CAS PubMed.
Footnote |
| † Electronic supplementary information (ESI) available. See DOI: https://doi.org/10.1039/d3ra05527b |
| This journal is © The Royal Society of Chemistry 2023 |

