DOI:
10.1039/D3RA04856J
(Paper)
RSC Adv., 2023,
13, 33038-33046
Highly sensitive detection of circulating tumour cells based on an ASV/CV dual-signal electrochemical strategy†
Received
19th July 2023
, Accepted 19th October 2023
First published on 8th November 2023
Abstract
Circulating tumour cells (CTCs), as a tumour marker, may provide more information in early diagnosis and accurate therapy of cancer patients. Electrochemical detection of CTCs has exhibited exceptional advantages. However, single-signal electrochemical detection usually has a high probability of false positives coming from interferents, operating personnel, and nonstandard analytical processes. Herein, a dual-signal strategy using anodic stripping voltammetry (ASV) and cyclic voltammetry (CV) for highly sensitive detection of CTCs was developed. When MCF-7 cells were present, aptamer DNA (DNA1)-magnetic beads (MBs) were captured by CTCs and detached from the biosensing electrodes. Following magnetic separation, polystyrene bead (PS)–CdS QDs labelled on MCF-7 cells were dissolved by HNO3 and the intensity of the oxidation peak current of Cd2+ ions was proportional to the amount of MCF-7 cells in ASV (y = 6.8929![[thin space (1/6-em)]](https://www.rsc.org/images/entities/char_2009.gif) lgCcells + 1.0357 (Ccells, cells per mL; R2, 0.9947; LOD, 3 cells per mL)). Meanwhile, the anodic peak currents of the remaining electrode in CV were also proportional to the amount of MCF-7 cells (y = 3.7891lgCcells + 52.3658 (Ccells, cells per mL; R2, 0.9846; LOD, 3 cells per mL)). An ASV/CV dual-signal biosensor for electrochemical detection of CTCs was achieved, which overcame the limitations of any single-signal mode and improved the detection reliability and precision.
lgCcells + 1.0357 (Ccells, cells per mL; R2, 0.9947; LOD, 3 cells per mL)). Meanwhile, the anodic peak currents of the remaining electrode in CV were also proportional to the amount of MCF-7 cells (y = 3.7891lgCcells + 52.3658 (Ccells, cells per mL; R2, 0.9846; LOD, 3 cells per mL)). An ASV/CV dual-signal biosensor for electrochemical detection of CTCs was achieved, which overcame the limitations of any single-signal mode and improved the detection reliability and precision.
1. Introduction
Circulating tumour cells (CTCs), first described in 1869 by Prof. Ashworth, are shed from primary or metastatic tumours and spread into the peripheral blood leading to future metastasis.1,2 Numerous studies have demonstrated that CTCs can be regarded as a tumour marker in the monitoring of metastasis and postoperative recurrence.3 Meanwhile, as a “liquid biopsy”, CTC detection may provide additional information before fatal metastasis occurs via a convenient and non-invasive method. Therefore, it is essential to monitor CTCs in peripheral blood for early diagnosis, assessing the cancer status of patients, and prescribing personalized anticancer therapy. The analysis of CTCs is still challenging because of their low blood concentration (about one CTC per 109 hematopoietic cells). Currently, several approaches have been proposed for CTC detection, such as DNA nanomachine technology,4 microfluidic technology,5,6 magnetic microgel technology,7 and photoelectrochemical (PEC) technology.8 Nevertheless, the fundamental drawbacks of these approaches remain, including their limited sensitivity, complicated production technology, and standard sample frequency. Therefore, the development of novel, useful, sensitive, and accurate methods for CTC detection is still absolutely essential.
Electrochemical (EC) methods offer outstanding benefits in detection because of their high sensitivity, quick response, simplicity, quick reaction, ease of use, and capacity for miniaturization.9,10 EC cytosensors can convert the analytical information between tumour cells and bio-probes to observable electrical readouts, including current, potential, or impedance.11 Wang et al. reported a novel ultrasensitive EC biosensor for the detection of K562 cells by a signal amplification strategy based on multiple-layer CdS quantum dot (QD)-functionalized polystyrene microspheres (PSs) as a bio-probe and a graphene oxide (GO)–polyaniline (PANI) composite as a modified material of the capture electrode.12 Xiang et al. described an EC cytosensor based on rolling circle amplification extension of electrode-immobilized primer/circular DNA complexes for efficiently capturing and sensitively detecting CTCs in whole blood. In their design, long DNA strands containing multiple repeated aptamer sequences were prepared through rolling circle amplification (RCA) reactions. These repeated sequences could contact cancer cells in a cooperative fashion, which significantly enhances the avidity to the target cells. By using rolling circle amplification extension to couple the multivalent binding probes with the catalytic enzymatic signal amplification, the target MCF-7 cells were efficiently captured and sensitively detected.13 Single-signal electrochemical detection often has a chance of false positives or false negatives coming from interferents, operational personnel, the instrument, and nonstandard analysis processes.14,15 Dual- or multi-signal detection has already been established to further improve the sensitivity and accuracy, including PEC and EC assays,16 colorimetric and PEC analysis,17 and colorimetric and fluorescence detection. The dual-signal technique not only possesses the properties of each mode, but also introduces reciprocal authentication in various modes, which significantly increases the reliability and precision of detection.18,19 For example, Kuang et al. created plasmonic circular dichroism- and luminescent-driven DNA-driven gold-upconversion nanoparticle (Au-UCNP) pyramids to identify miRNA in live cells.20 For the purpose of detecting miRNA-210, Chen et al. created a magnetic-assisted EC-PEC dual-mode biosensing device.21 However, multi-mode detection is in the initial stages due to the high demand for biosensor structural design, sensing materials and choice of bio-probe, which serve to effectively respond to target changes of various signals.
Carbon nanotubes (CNTs), as a new class of advanced materials, have attracted tremendous interest due to their unique properties.22–24 CNTs can be divided into two categories, either single-walled CNTs (SWCNTs) or multi-walled CNTs (MWCNTs). Easy functionalization of CNTs makes them biocompatible for biological applications. Biomolecules,25 nanoparticles (NPs)26 and polystyrene nanofibers26 attached to CNTs have been reported. In particular, CNT and metal-NP hybrids exhibit the properties of both CNTs and metal-NPs. Among them, Au-NPs, as the most stable biocompatible NPs, can be functionalized with CNTs through covalent or non-covalent linkages,27,28 and exhibit excellent electronic and mechanical properties. Moreover, quantum dots (QDs), with unique chemistry and physics, and confined size on the nanoscale (1–10 nm), have attracted attention from researchers for the construction of QD-based electrochemical sensors.29–31 Depending on the excellent electrochemical and photophysical characteristics of QDs, the introduction of QDs can provide an increase in sensitivity and response speed in electrochemical sensors.31,32 Among them, cadmium sulfide (CdS) has found applications in various fields with a bulk band gap value of ∼2.42 eV. CdS QDs have also been widely reported to prepare CdS QD/polystyrene (PS) composites for electrochemical detection due to PS's low specific weight, biocompatibility, flexibility, and high chemical resistance.33,34
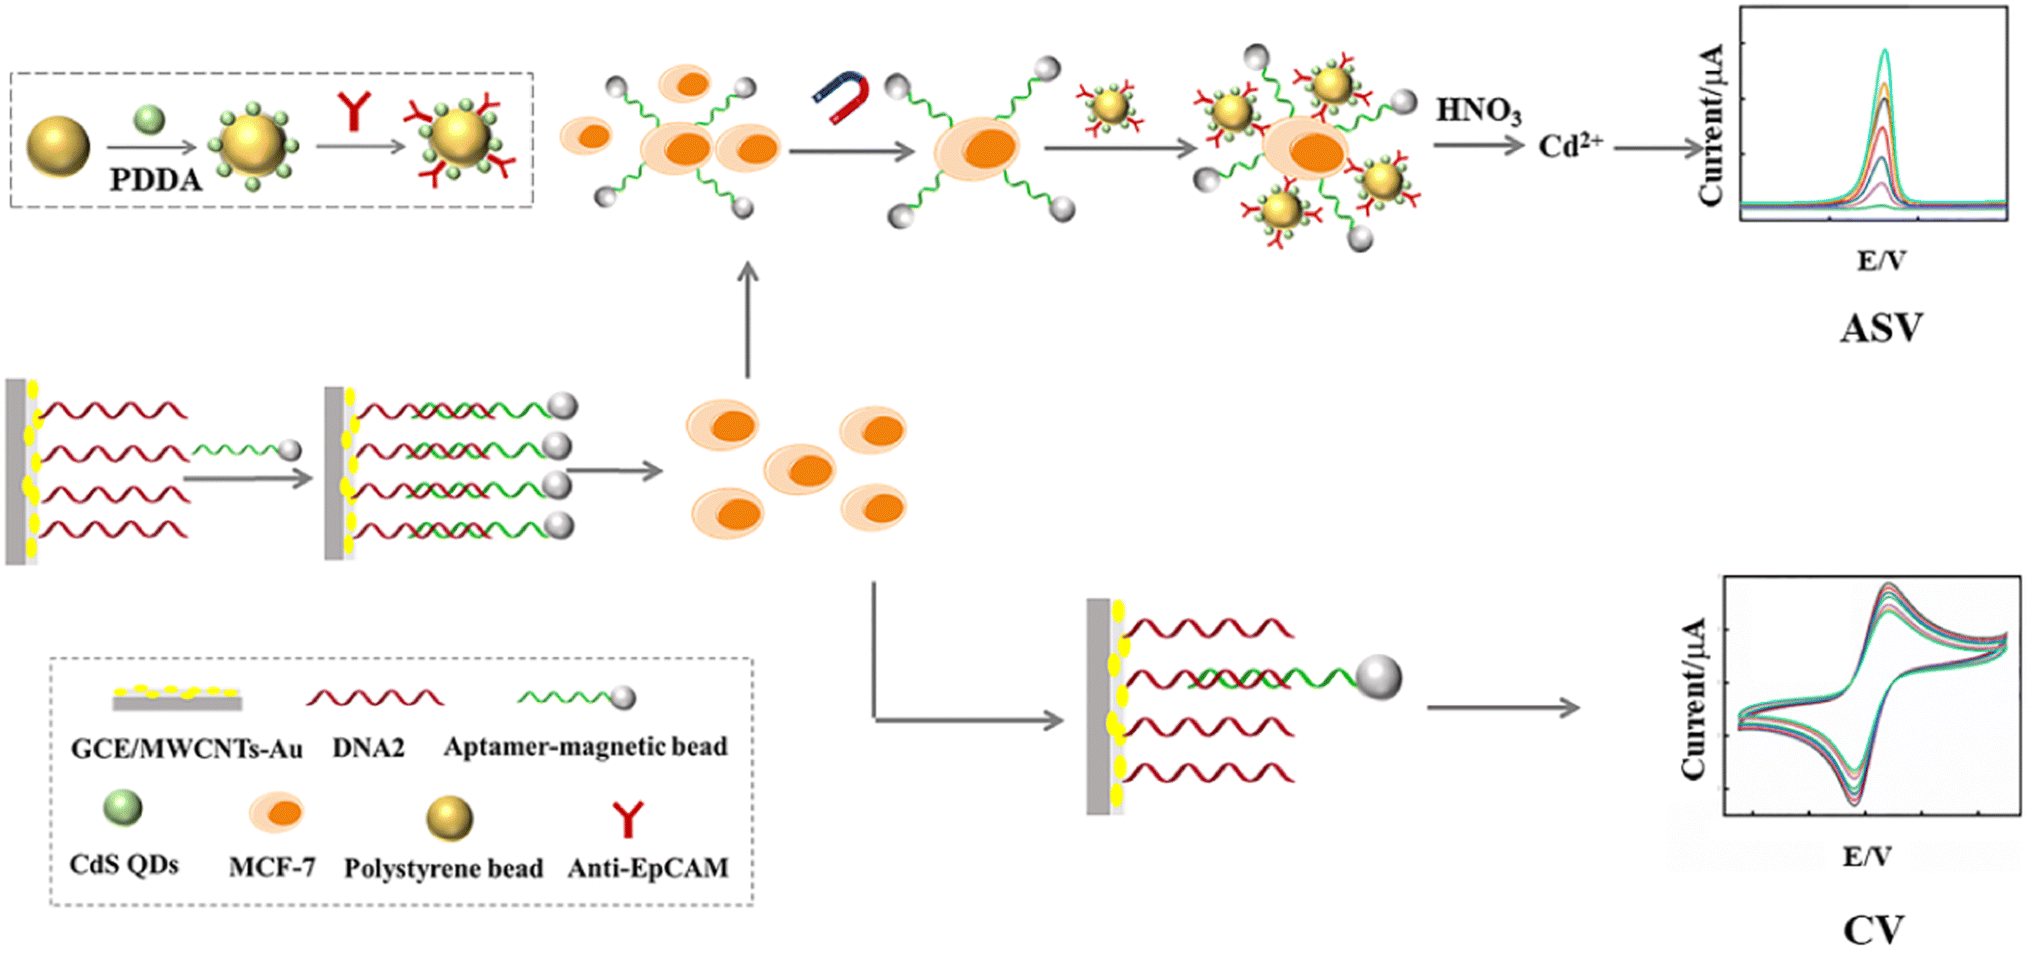
Herein, we have developed a dual-signal electrochemical strategy for the highly sensitive detection of CTCs based on anodic stripping voltammetry (ASV) and cyclic voltammetry (CV) as shown in Scheme 1. In our design, the capture electrode, GCE/multi-walled carbon nanotubes (MWCNTs)–Au/linked DNA (DNA2)–aptamer (DNA1)-magnetic beads (MB), was created using layer-by-layer assembly technology. When MCF-7 cells are present, DNA1-MB was captured and released from the capture electrode. Following magnetic separation, the MCF-7 cells were labelled with polystyrene beads (PS)–CdS quantum dots (QDs). After the CdS QDs were dissolved by HNO3, Cd2+ ions were released. The intensity of the peak current of Cd2+ ions in ASV was proportional to the amount of MCF-7 cells. Meanwhile, the anodic peak current of the remaining electrode in CV was also proportional to the quantity of MCF-7 cells. An ASV/CV dual-signal electrochemical biosensor for the detection of CTCs was obtained, which would overcome the limitations of any single-signal detection and improve both the sensitivity and accuracy.
 |
| | Scheme 1 Schematic representation of the ASV/CV dual-signal electrochemical detection of CTCs. | |
2. Experimental
2.1 Materials
The glassy carbon electrode (GCE), polyetherimide (PEI), multi-walled carbon nanotubes (MWCNTs), CdCl2, MPA, Na2S, poly dimethyl diallyl ammonium chloride (PDDA), trisodium citrate solution (1% by weight) and HAuCl4 were obtained from Aladdin Chemistry Co. Ltd (Shanghai, China). Bovine serum albumin (BSA), phosphate-buffered saline (PBS), potassium chloride, K3[Fe(CN)6], K4[Fe(CN)6]·3H2O, trisodium citrate solution, polystyrene microspheres (PS), and anti-epithelial cell adhesion molecule antibody (anti-EpCAM) were obtained from Abcam Co., Ltd Carboxyl-Fe3O4 magnetic microbeads (COOH-MB, 300–400 nm) were obtained from BaseLine ChromTech Research Centre (Tianjin, China). Glacial acetic acid, N-(3-(dimethylamino)-propyl)-N′-ethyl carbodiimide hydrochloride (EDC), N-hydroxy sulfosuccinimide (NHS), and the oligonucleotides used in this work were received from Sangon Biotechnology Co. Ltd (Shanghai, China).
MUC1 aptamer (NH2-DNA1): 5′-NH2-GGG AGA CAA GAA TAA ACG CTC AAG CAG TTG ATC CTT TGG ATA CCC TGG TTC GAC AGG AGG CTC ACA ACA GGC-3′.
Linker DNA2: 5′-SH-TTT TTT TTT TTT TTT TTT TTT TTT TTT GCC TGT TGT GAG-3′.
2.2 Preparation of the sensing electrode
2.2.1 Fabrication of the MWCNT–Au NP composite. First, carboxylated MWCNTs (COOH-MWCNTs) were synthesized as previously described.35 0.50 g MWCNTs were added to 40 mL of an acidic solution (H2SO4:HNO3 = 3:1, volume ratio) and sonicated for 6 h. After being centrifuged and washed repeatedly with ultrapure water, COOH-MWCNTs were obtained. Then, 10 mg COOH-MWCNTs were mixed with PEI solution (0.1% wt) and sonicated for 30 min. After being filtered and washing with ultrapure water, the MWCNT–PEI composites were achieved and were dispersed in ultrapure water (about 1.5 mg mL−1). Third, Au NPs were synthesized according to the previous methods.36 Briefly, 1.6 mL aqueous trisodium citrate solution (1% by weight) was added into 100 mL boiling HAuCl4 solution (0.25 mM) under vigorous stirring and reflux. The Au NPs were obtained after 30 min with a colour change from blue to wine red. Last, 10 mL Au NP aqueous solution (0.39 mg mL−1) was added to 10 mL MWCNTs–PEI solution and stirred for 4 h to obtain MWCNTs–Au NPs.
2.2.2 Preparation of DNA1-MBs. 40 μL carboxyl-group-coated MBs (COOH-MBs) were transferred into a 1.5 mL Eppendorf tube and washed three times with 500 μL PBS buffer (10 mM phosphate, 0.1 M NaCl, pH 7.4). After magnetic separation, the MBs were dispersed in 500 μL PBS buffer (pH 7.4) and 100 μL capture NH3-DNA1 (0.4 μM) was added. Under gentle shaking at 37 °C for 1 h, the DNA1-MBs were obtained by magnetic separation and washing with 500 μL of PBS buffer three times.
2.2.3 Preparation of the capture electrode. First, the GCE was polished with 0.3 and 0.05 μm Al2O3 powder and sonicated in alcohol and distilled water, respectively. Then, the GCE was dried by nitrogen gas at room temperature. In addition, 10 μL of MWCNT–Au composites (10 mg mL−1) were added dropwise on the electrode to form the MWCNTs–Au film at room temperature. Subsequently, 5 μL (10 μM) linker DNA (DNA2) solution was dropped on the surface of the electrode and incubated for 12 h at room temperature. The DNA2 was modified on the electrode by Au–S bonds, which were formed from –SH in DNA2 and Au in the electrode of GCE/MWCNTs–Au. 1% BSA was used to block non-specific sites, and the electrode GCE/MWCNTs–Au/DNA2/BSA was immersed in PBS solution containing DNA1-MBs (10 μM), which came from –COOH in COOH-MB and –NH3 in DNA1 through activation of EDC/NHS and heated to 95 °C for 5 min. Then, the mixture solution was cooled to room temperature and kept for 2 h. Finally, the capture electrode, GCE/MWCNTs–Au/DNA2–DNA1-MB, was achieved after being washed with 500 μL of PBS buffer three times.
2.3 Synthesis of the PS/CdS QDs/anti-EpCAM probe
First, CdS QDs were synthesized as Wang et al. reported via a one-pot route.12 0.4 mmol CdCl2, 0.2 mmol MPA, and 0.2 mmol C6H5Na3O7 were dissolved into distilled water under vigorous stirring at a pH of 9. Then, 0.02 mmol Na2S was added into the above solution under stirring overnight. MPA-capped CdS QDs were obtained after being washed with absolute ethanol and distilled water three times. Third, 50 μL COOH-PS (5%) was mixed with 1 mL PDDA (0.2 wt%) solution and sonicated for 20 min. After being washed three times by distilled water, 1 mL CdS QDs (3 × 10⁻⁶ M) were added and stirred for 12 h. And the above two procedures were repeated alternately three times. Then, the produced PS–CdS QD composites were activated by EDC and NHS at 37 °C and 10 μL anti-EpCAM (Ab, 1 μg mL−1) solution was dropped into the active PS–CdS QDs under shaking for 6 h at 25 °C. After washing three times with distilled water, the PS/CdS QDs/anti-EpCAM probe was achieved.
2.4 ASV/CV dual-signal electrochemical detection of CTCs
The capture electrode, GCE/MWCNTs–Au/DNA2–DNA1-MB, was immersed in MCF-7 cell solutions with different concentrations and incubated for 1 h at 37 °C. First, after MCF-7 cells were captured, DNA1-MB separated from the capture electrode. After magnetic separation and being washed by PBS, 5 μL PS–CdS QDs-Ab probe solution was added into the captured MCF-7 cells by DNA1-MB. The Cd2+ solution dissolved by HNO3 (200 μL, 0.1 M) was transferred into acetate buffer (HAc-NaAc buffer, 4.8 mL, 0.2 M, pH 5.2) containing 20 μg per mL Hg2+ for detection of metal ions by ASV. The electrode position was at −1.2 V for 30 min. A square-wave voltammetric waveform was recorded by stripping from −1.1 to 0.5 V (potential step, 4 mV; amplitude, 25 mV; frequency, 25 Hz). Based on the relationship between Cd2+ content and the MCF-7 cell concentration, MCF-7 cells were detected due to the sharp peak of Cd2+ in ASV at −0.72 V.37–39 On the other hand, after DNA1-MB had separated, the electrochemical characteristics of the capture electrode was investigated using cyclic voltammetry (CV) in 5 mM K3Fe(CN)6/K4Fe(CN)6 (0.1 M KCl). Based on the relationship between the anodic peak current intensity and the MCF-7 cell concentration, MCF-7 cells were detected. An ASV/CV dual-signal electrochemical biosensor for detection of CTCs was achieved.
3. Results and discussion
3.1 Characterization of MWCNTs, Au NPs and the MWCNT–Au NP composite
To reveal the morphology of the COOH-MWCNTs, they were examined using scanning electron microscopy (SEM). As illustrated in Fig. 1A, the MWCNTs exhibited tubular structures with a length of about twenty microns. According to Fig. 1B, the Au NPs showed a regular spherical form and a diameter of about 15 nm, whose absorption peak was at 520 nm as shown in Fig. 1C. The composite of MWCNTs–Au NPs was investigated by SEM as exhibited in Fig. 1D, and it was discovered that the Au NPs dispersed over the MWCNTs' exterior walls like dewdrops. As expected, the EDS pattern (Fig. 1E) displayed the distribution of C, N, O and Au, which provided direct evidence that the MWCNT–Au NP composite had been synthesized successfully.
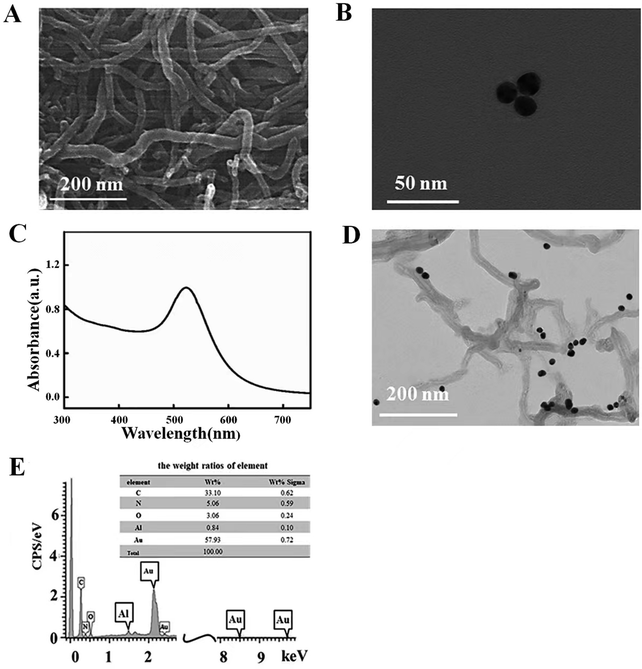 |
| | Fig. 1 (A) SEM image of the COOH-MWCNTs. (B) TEM image of the Au NPs. (C) The UV-vis absorption of the Au NPs. (D and E) TEM image and EDS pattern of the MWCNTs–Au NPs. | |
3.2 Characterization of CdS QDs, PS and PS–CdS QDs
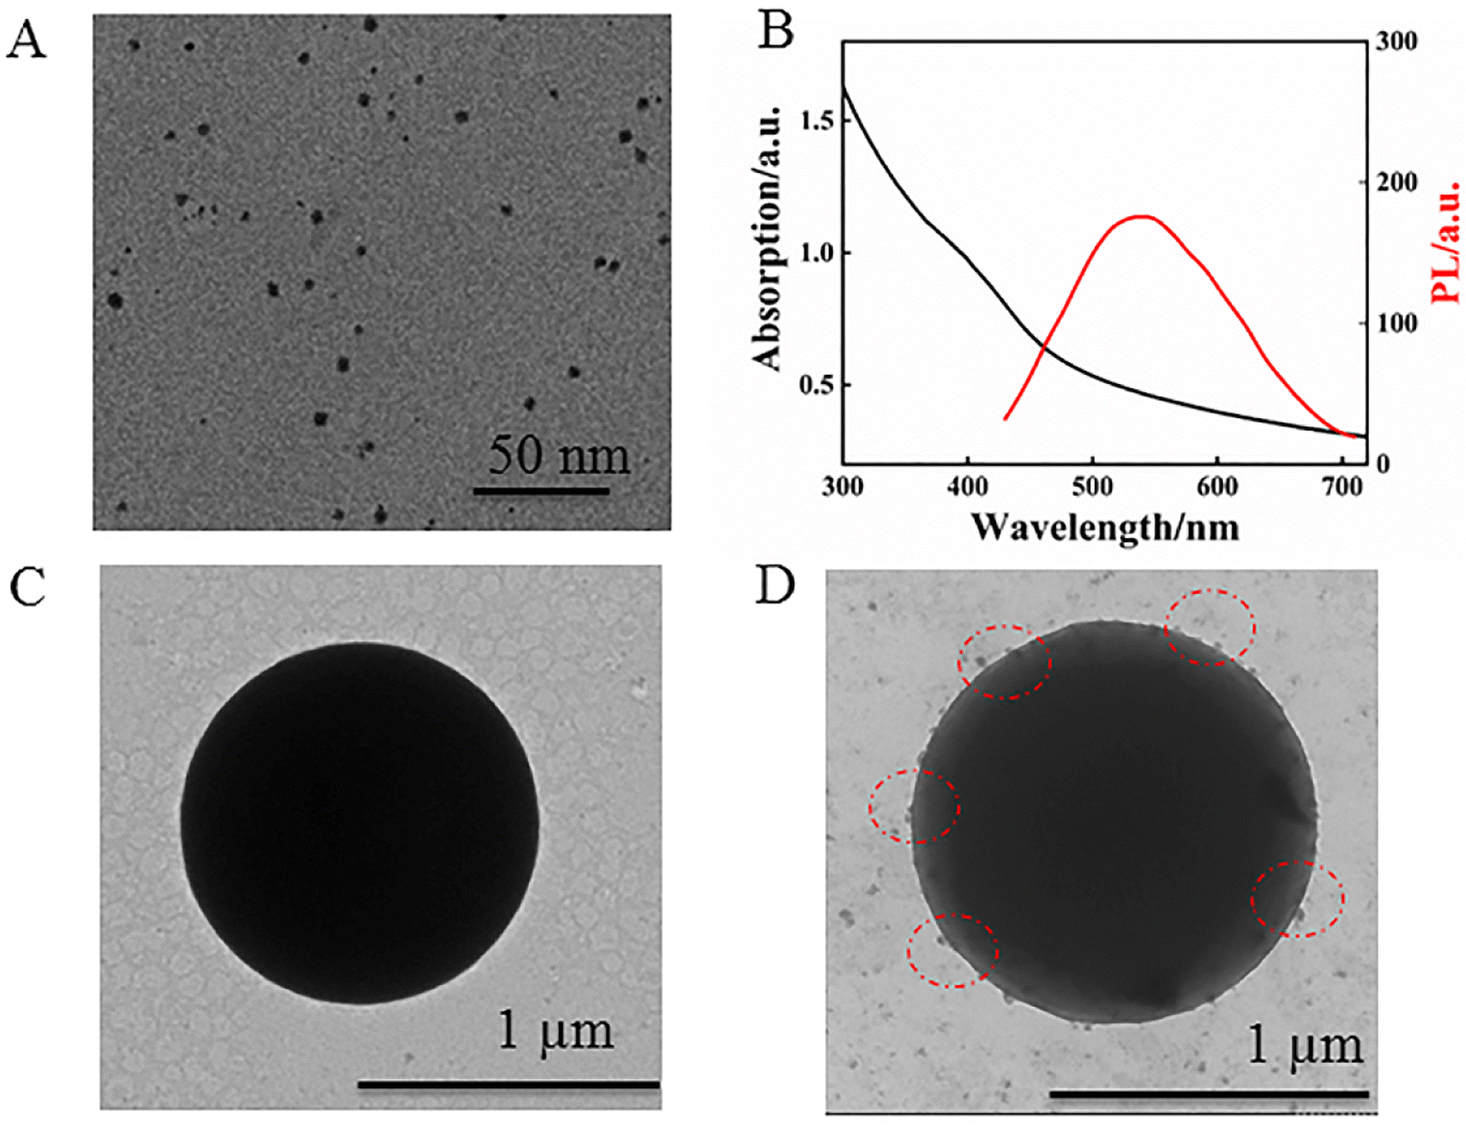
The TEM image of the synthesized MPA-QDs exhibited spherical shapes with an average size of 3.7 nm as shown in Fig. 2A. The UV-vis absorption and PL spectra of the CdS QDs were recorded in Fig. 2B. The absorption peak appeared at 410 nm and the fluorescence emission peak at 540 nm, indicating a Stokes shift of about 130 nm, which showed that there might be a lot of dangling bonds or flaws on the surface of the QDs, benefitting the attachment of PDDA. The size of the CdS QDs was predicted to be around 3.73 nm using empirical formula:40 D = (−6.6521 × 10⁻⁸)λ3 + (1.9557 × 10⁻⁴)λ2 − (9.2352 × 10⁻²)λ + 13.29 (D, the diameter of CdS QDs; λ (nm), absorption peak position), which was consistent with the above TEM results. Meanwhile, the morphology of PS and the PS–CdS QDs were investigated by TEM as shown in Fig. 2C and D. A uniform and smooth surface with a diameter of about 1 μm was visible on the PS. The TEM picture of the PS–CdS QDs, on the other hand, showed a few projecting sections dispersed over the PS surface, indicating that CdS QDs had formed on the surface of PS via PDDA by electrostatic attraction.
 |
| | Fig. 2 (A) TEM image, and (B) UV-vis absorption and PL spectra of CdS QDs. (C) TEM image of PS and (D) PS–CdS QDs. | |
3.3 Characterization of the biosensor
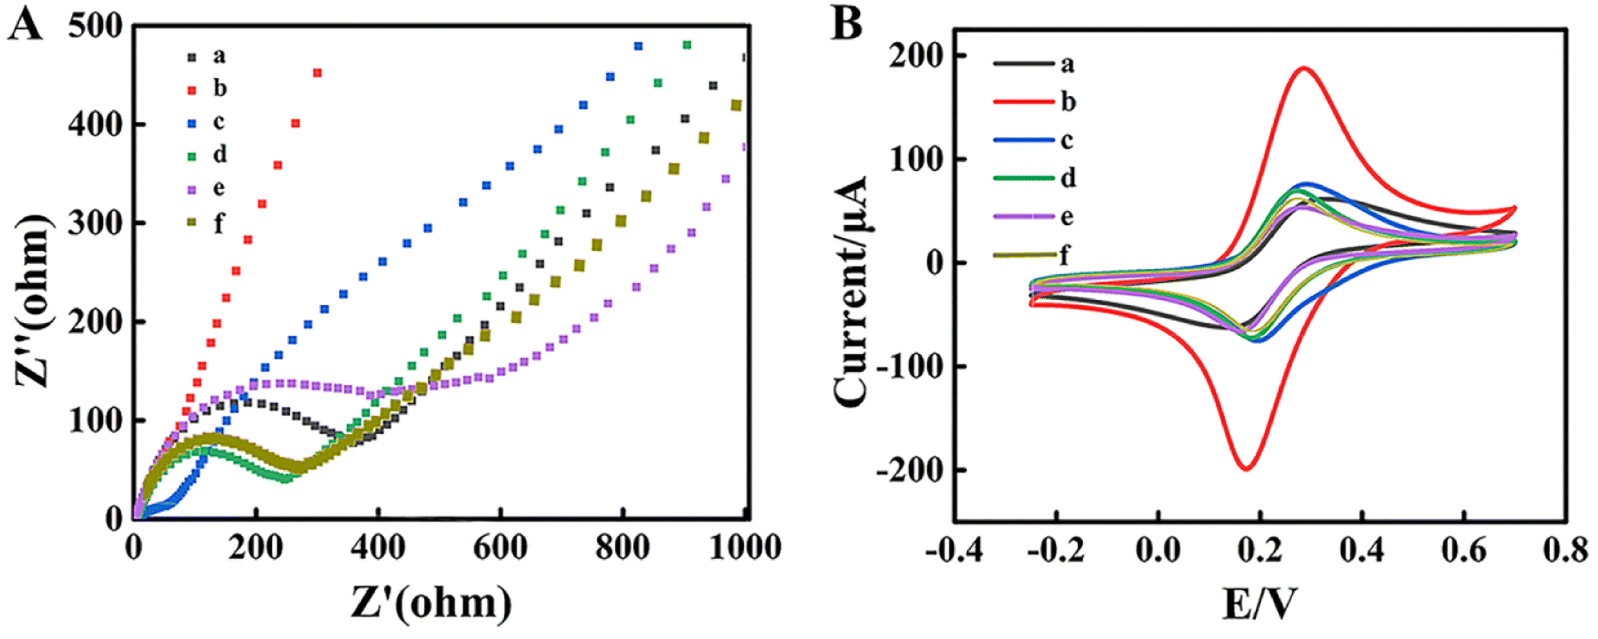
Electrochemical impedance spectroscopy (EIS) and cyclic voltammetry (CV) were employed to investigate the assembly process of the biosensors. EIS and CV were performed in a support solution containing 5 mM [Fe(CN)6]3−/4−. In the EIS spectrum, the semicircle at high frequencies represented the electron transfer resistance (Ret) and the linear counterpart at low frequencies meant the diffusion process, respectively.39 Compared with the bare GCE as shown in Fig. 3A curve a and Fig. 3B curve a, due to its high electrical conductivity, the MWCNT–Au NP nanocomposite significantly promoted the interfacial electron transfer, exhibiting an ultra-small Ret in the ESI† (Fig. 3A curve b), while the peak current of CV increased (Fig. 3B curve b).
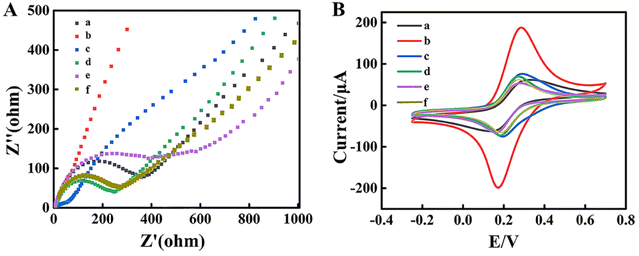 |
| | Fig. 3 (A) Electrochemical impedance spectroscopy of the (a) bare GCE, (b) GCE/MWCNTs–Au, (c) GCE/MWCNTs–Au/DNA2, (d) GCE/MWCNTs–Au/DNA2/BSA, (e) GCE/MWCNTs–Au/DNA2/BSA/DNA1-MB, and (f) remaining GCE/MWCNTs–Au/DNA2/BSA (after DNA1-MB was captured by MCF-7) in 0.1 M KCl solution containing 5 mM K3Fe(CN)6/K4Fe(CN)6 (impedance spectral frequency: 0.1–105 Hz, amplitude: 5 mV). (B) Cyclic voltammograms of the (a) bare GCE, (b) GCE/MWCNTs–Au, (c) GCE/MWCNTs–Au/DNA2, (d) GCE/MWCNTs–Au/DNA2/BSA, (e) GCE/MWCNTs–Au/DNA2/BSA/DNA1-MB, and (f) remaining GCE/MWCNTs–Au/DNA2/BSA (after DNA1-MB was captured by MCF-7) in 0.1 M KCl solution containing 5 mM K3Fe(CN)6/K4Fe(CN)6 (scan rate: 100 mV s−1). | |
However, when the aptamer DNA1 coated on the GCE/MWCNTs–Au NPs, the Ret increased as shown in the EIS data (Fig. 3A curve c) and the peak current of CV enhanced (Fig. 3B curve c). Subsequently, after the immobilization of BSA on the GCE/MWCNTs–Au NPs/DNA2 electrode to block the residual nonspecific binding sites, the Ret increased (Fig. 3A curve d), which indicated that electron transfer was hindered by the presence of BSA. Meanwhile, the peak current of CV decreased. The impedance significantly increased when DNA1-MB hybridized with DNA2 on the surface of the GCE/MWCNTs–Au NPs/DNA2 (Fig. 3A curves e). As expected, the peak current of CV further decreased (Fig. 3B curves e). Finally, when MCF-7 cells are present, DNA1-MBs are captured and released from the capture electrode. The Ret of the remaining electrode decreased as shown in the EIS data (Fig. 3A curve e), and the peak current of CV increased.
3.4 Optimization of the experimental conditions
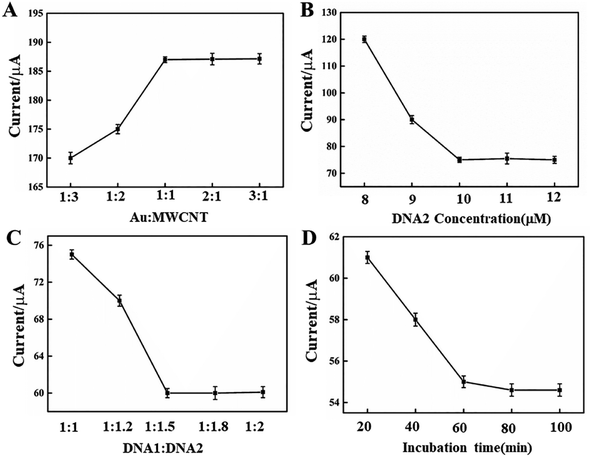
To obtain excellent performance of the EC biosensor for MCF-7 cell detection, some experimental parameters were discussed, including the molar ratio of Au NPs to MWCNTs, the quantity of DNA2 and DNA1, and the incubation time of DNA2 and DNA1-MB in CV, as shown in Fig. 4. In Fig. 4A, the anodic peak current in CV increased when the ratio of Au to MWCNTs decreased from 1:3 to 1:1, but there was almost no change after 1:1. As a result, the ideal ratio for electrode alteration was determined to be 1:1. In addition, in CV detection, the link DNA, DNA2, was another parameter that affected the EC signal. The peak current may be decreased by adding more DNA2, as shown in Fig. 4B. However, additional DNA2, such as beyond 50 μM, did not lead to a greater decrease in peak current, demonstrating a saturated linker of DNA2. Hence, the optimal concentration of DNA2 was 50 μM. The amount of DNA1-MBs that hybridized with DNA2 on the electrode surface of the GCE/MWCNTs–Au NPs/DNA2 is shown in Fig. 4C. DNA1-MB caused a shift in the peak current. The peak current decreased with the increase of the ratio between DNA2 and DNA1. When the ratio of DNA2 to DNA1 was more than 1:1.5, there was essentially no change in the peak current, indicating full hybridization of DNA2 with DNA1. The effect of incubation time was also discussed as shown in Fig. 4D. The peak current decreased with the increase of the incubation time, and there was almost no obvious change after 60 min. Thus, 60 min was chosen as the incubation time for the construction of the electrochemical biosensor.
 |
| | Fig. 4 The effect of (A) molar ration of Au NPs:MWCNTs, (B) amount of DNA2, (C) amount of DNA1, and (D) incubation time of DNA2 and DNA1-MB in CV. Data are presented as mean ± SD (n = 5 independent experiments). | |
3.5 Dual-signal electrochemical detection of CTCs
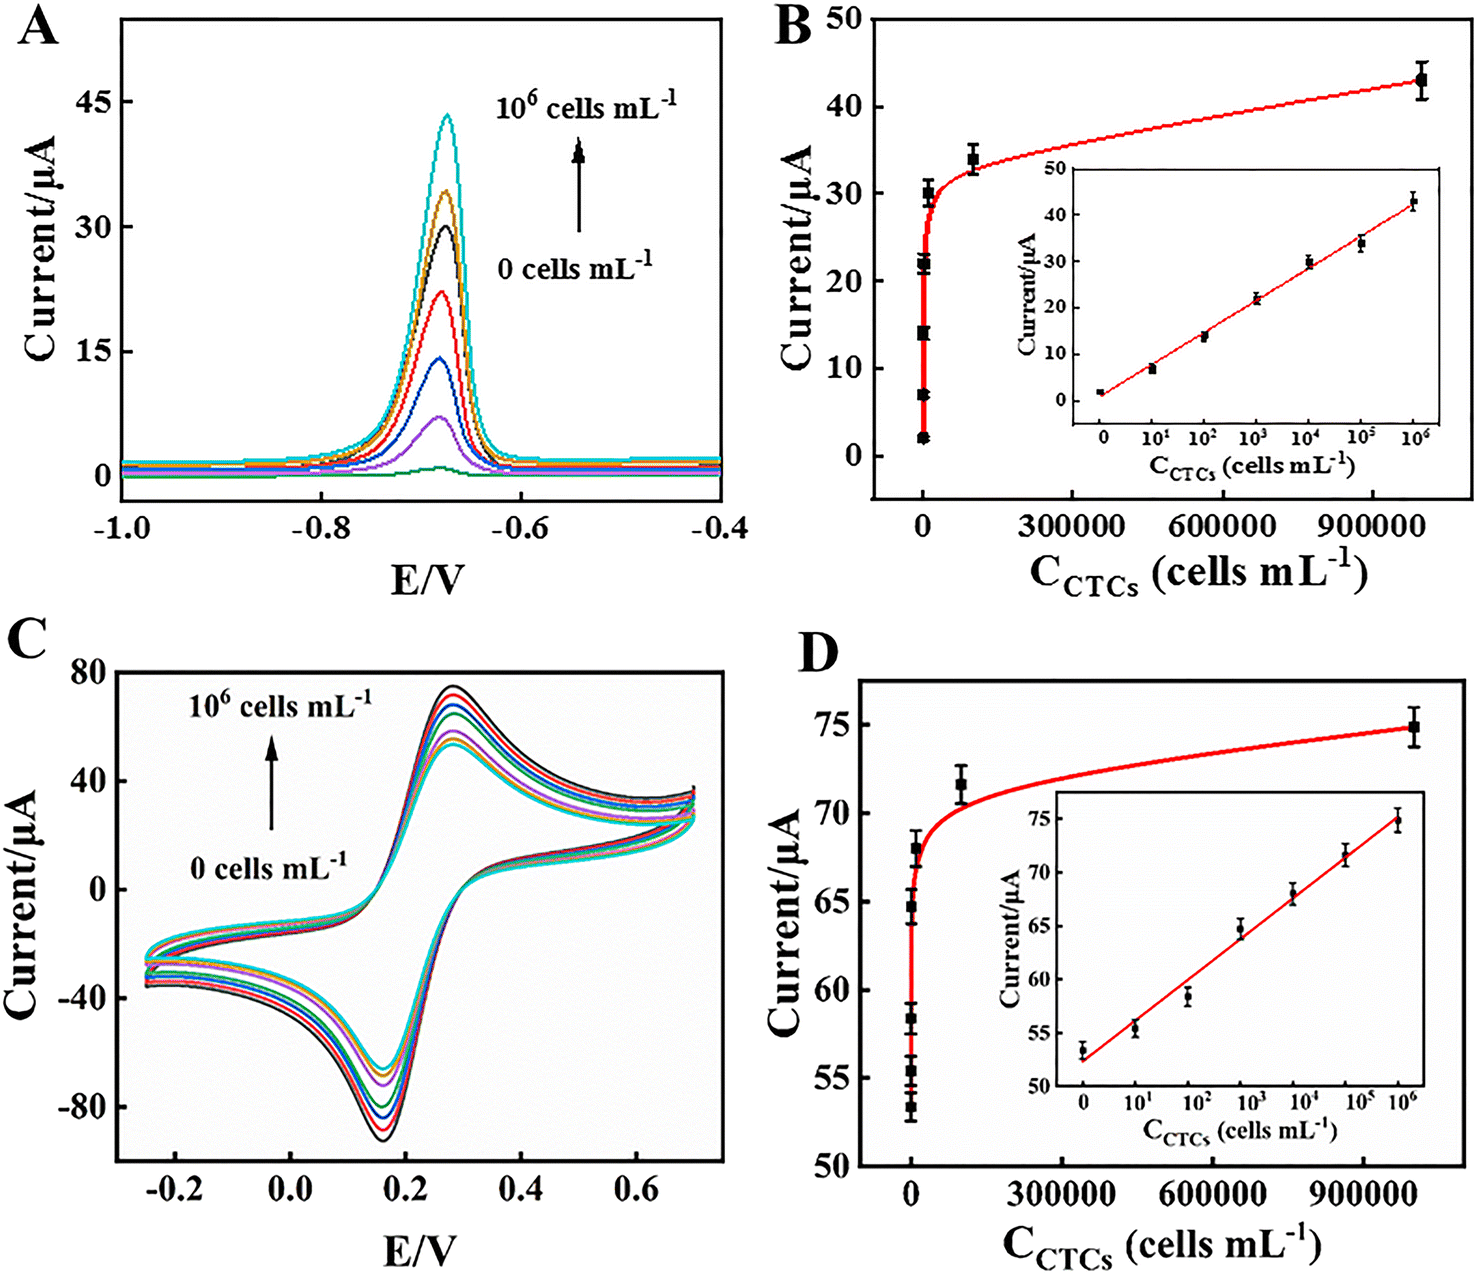
The MCF-7 cells were captured by DNA1-MB, which was isolated from the GCE/MWCNTs–Au NPs/DNA2/DNA1-MB, and were labelled with PS–CdS QDs. Cd2+ ions from the collected PS–CdS QDs after magnetic separation were detected by ASV following being dissolved in HNO3 solution. According to Fig. 5A, the number of MCF-7 cells had a direct correlation with the strength of the Cd2+ oxidation peak current at around −0.72 V. The peak current intensity was significantly correlated with the logarithm of the MCF-7 cell concentration in the range from 0 to 1.0 × 10⁶ cells per mL. The linear regression equation was y = 6.8929lgCcells + 1.0357 (Ccells, cells per mL) with a correlation coefficient of 0.9947 (n = 6), and the limit of detection (LOD) was 3 cells per mL (S/N = 3) as shown Fig. 5B. As a result, the electrochemical biosensor demonstrated the accurate tumour cell identification at low concentration. Furthermore, the anodic peak currents of the remaining electrode in CV after DNA1-MB had detached from it also presented a linear correlation (Fig. 5C) and the equation was y = 3.7891lgCcells + 52.3658 (Ccells, cells per mL), with a coefficient of determination (R2) of 0.9846 and a LOD of 3 cells per mL (S/N = 3), as shown in Fig. 5D. The ASV/CV dual-signal electrochemical biosensor for detection of CTCs indicated a high sensitivity compared with previous reports (Table 1).
 |
| | Fig. 5 (A) ASV and (C) CV responses of the electrochemical biosensor incubated with different concentrations of MCF-7 cells in 0.01 M phosphate buffer (pH = 6.5; 0, 10, 1 × 10², 1 × 10³, 1 × 10⁴, 1 × 10⁵, 1 × 10⁶ cells per mL); (B) and (D) calibration curve of the cytosensor for MCF-7 cells. | |
Table 1 Previous reports on electrochemical sensors for detecting CTCs
| Electrochemical approaches |
Electrochemical materials |
Detection range (cells per mL) |
Detection limit (cells per mL) |
Ref. |
| Amperometry |
Au NP/HRP-TMB |
1 × 10² to 5 ×10⁴ |
5 |
13 |
| DPV |
rGO/AuNPs/CuO nanozyme |
50 to 7 × 10³ |
27 |
41 |
| SWV |
Au/Fe3O4-modified graphene |
5–500 |
3 |
42 |
| LSV |
AgNPs/nanofibers |
10 to 5 × 10⁵ |
6 |
43 |
| EIS |
Galactosylated gold-nanoisland |
1 × 10² to 1 × 10⁵ |
30 |
44 |
| ASV/CV |
MWCNTs–Au |
0 to 1.0 × 10⁶ |
3 |
This work |
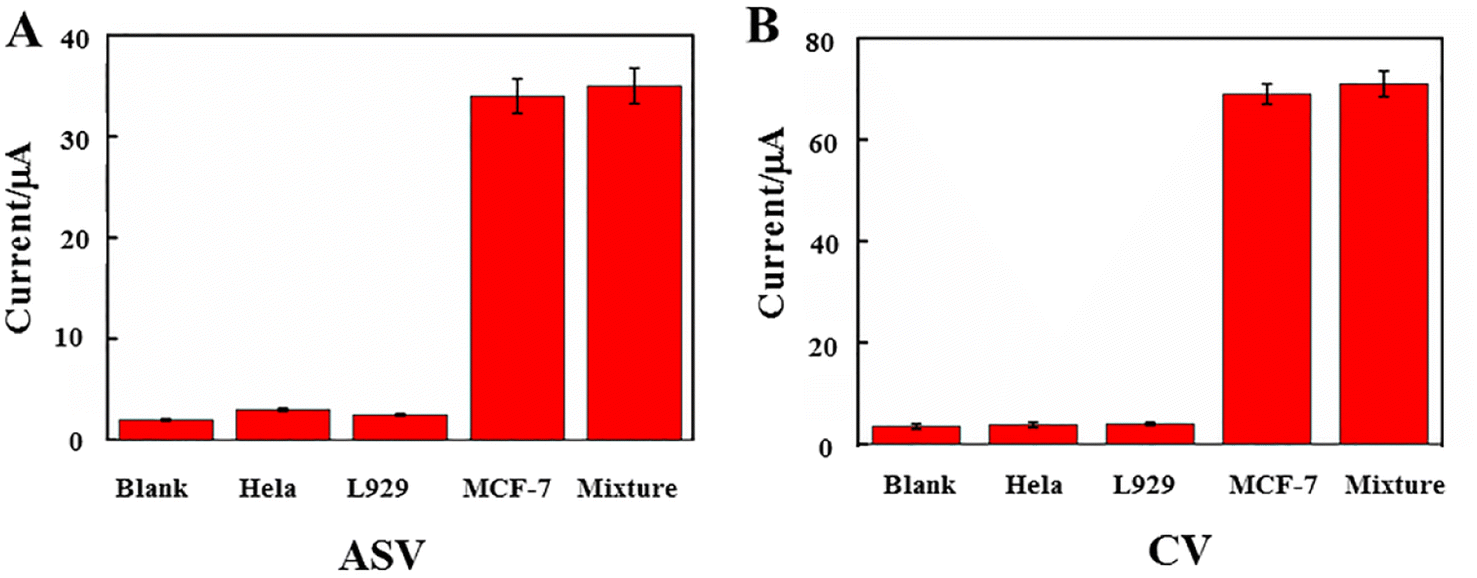
The reproducibility of the biosensor was investigated from the response to 1.0 × 10³ cells per mL with this dual-signal electrochemical strategy. A series of five electrodes were prepared for CTC detection in the ESI† (Table 2). The relative standard deviation (RSD) of the measurements for the five electrodes was 2.70%, suggesting that the precision and reproducibility of the proposed biosensor was quite good. To determine the biosensor's selectivity, it was assessed in the presence of HeLa, L929, MCF-7, and a combination of all the cells (Fig. 6). Other interfering substances had almost no effect on the signal for the detection of MCF-7 cells. To test the stability of this dual-signal electrochemical biosensor, at five, eight, ten, and twenty days, the current response of the as-prepared biosensor used for the detection of CTCs (103 cells per mL) was measured, as shown in the ESI† (Table 3). The ASV/CV signal decreased respectively to about 98.0–90.0% and 96.5–89.0% of its initial value, suggesting that the stability of the proposed electrochemical biosensor was good.
Table 2 Reproducibility of the dual-signal electrochemical biosensor (n = 5; CTC concentration, 103 cells per mL)
| |
No. 1 |
No. 2 |
No. 3 |
No. 4 |
No. 5 |
RSD (%) |
| ASV (μA) |
22.19 |
20.85 |
21.10 |
20.76 |
21.20 |
2.7 |
| CV (μA) |
64.77 |
62.85 |
63.76 |
65.02 |
63.84 |
0.84 |
 |
| | Fig. 6 The detection of different cells (HeLa, L929, MCF-7 and a mixture) in (A) ASV and (B) CV. | |
Table 3 Stability of the dual-signal electrochemical biosensor (CTC concentration, 103 cells per mL)
| |
Initial value |
5 days |
8 days |
10 days |
20 days |
| I0 |
I1 |
I1/I0, % |
I2 |
I2/I0, % |
I3 |
I3/I0, % |
I4 |
I4/I0, % |
| ASV (μA) |
22.20 |
21.75 |
98.0 |
21.20 |
95.50 |
20.76 |
93.50 |
19.98 |
90.0 |
| CV (μA) |
64.80 |
62.53 |
96.5 |
61.75 |
95.30 |
59.75 |
92.20 |
57.64 |
89.0 |
4. Conclusions
In conclusion, we demonstrated an electrochemical method for the ultrasensitive detection of CTCs using an ASV/CV dual-signal. This sensor was dependent on the intensity of the Cd2+ ion oxidation peak current from the PS–CdS QDs tagged on the MCF-7 cells that were captured by DNA1-MB separated from the capture electrode, GCE/MWCNTs–Au NPs/DNA2/DNA1-MB, which was proportional to the number of MCF-7 cells in ASV, and showed a linear correlation in the range of 0 to 1.0 × 10⁶ (y = 6.8929lgCcells + 1.0357 (R2, 0.9947; LOD, 3 cells per mL)). The anodic peak currents of the residual electrode in CV likewise showed a linear correlation after DNA1-MB had separated from the capture electrode (y = 3.7891lgCcells + 52.3658 (R2, 0.9846; LOD, 3 cells per mL)). An ASV/CV dual-signal detection strategy for CTCs was developed, which overcomes the limitations of any single-signal mode and improved the detection reliability and accuracy.
Conflicts of interest
The authors declare no competing interests.
Acknowledgements
We would like to thank the Hebei Key Laboratory of Applied Chemistry, Yanshan University for their assistance with the TEM, SEM, and EDS techniques.
References
- A. A. Adams, P. I. Okagbare, J. Feng, M. L. Hupert, D. Patterson, J. Göttert, R. L. McCarley, D. Nikitopoulos, M. C. Murphy and S. A. Soper, J. Am. Chem. Soc., 2008, 130, 8633–8641 CrossRef CAS PubMed.
- N. Sun, X. Li, Z. Wang, R. Zhang, J. Wang, K. Wang and R. Pei, ACS Appl. Mater. Interfaces, 2016, 8, 12638–12643 CrossRef CAS PubMed.
- J. Luo, D. Liang, D. Zhao and M. Yang, Biosens. Bioelectron., 2020, 151, 111976 CrossRef CAS PubMed.
- F. Ma, S.-h. Wei and C.-y. Zhang, Anal. Chem., 2019, 91, 7505–7509 CrossRef CAS PubMed.
- J. Chen, C. Y. Liu, X. Wang, E. Sweet, N. Liu, X. Gong and L. Lin, Biosens. Bioelectron., 2020, 150, 111900 CrossRef CAS PubMed.
- J. Wang, Z. Gao, M. Dong, J. Li, H. Jiang, J. Xu, J. Gu and D. Wang, Microchim. Acta, 2023, 190, 221 CrossRef CAS PubMed.
- A. Seyfoori, S. Seyyed Ebrahimi, E. Samiei and M. Akbari, ACS Appl. Mater. Interfaces, 2019, 11, 24945–24958 CrossRef CAS PubMed.
- J. Wang, Z. Gao, M. Dong, J. Li, H. Jiang, J. Xu, J. Gu and D. Wang, Microchim. Acta, 2023, 190, 221 CrossRef CAS PubMed.
- Y. Zheng, X. Wang, S. He, Z. Gao, Y. Di, K. Lu, K. Li and J. Wang, Biosens. Bioelectron., 2019, 126, 261–268 CrossRef CAS PubMed.
- M. Dong, Z. Gao, Y. Zhang, J. Cai, J. Li, P. Xu, H. Jiang, J. Gu and J. Wang, RSC Adv., 2023, 13, 12966–12972 RSC.
- F. Vajhadin, S. Ahadian, J. Travas-Sejdic, J. Lee, M. Mazloum-Ardakani, J. Salvador, G. E. Aninwene II, P. Bandaru, W. Sun and A. Khademhossieni, Biosens. Bioelectron., 2020, 151, 111984 CrossRef CAS PubMed.
- J. Wang, X. Wang, H. Tang, Z. Gao, S. He, J. Li and S. Han, Biosens. Bioelectron., 2018, 100, 1–7 CrossRef CAS PubMed.
- J. Yang, X. Li, B. Jiang, R. Yuan and Y. Xiang, Anal. Chem., 2020, 92, 7893–7899 CrossRef CAS PubMed.
- M. Lagos-Quintana, R. Rauhut, W. Lendeckel and T. Tuschl, Science, 2001, 294, 853–858 CrossRef CAS PubMed.
- X. Gao, H. Li, Y. Zhao and G. Jie, Biosens. Bioelectron., 2019, 143, 111602 CrossRef CAS PubMed.
- H. Deng, Y. Chai, R. Yuan and Y. Yuan, Anal. Chem., 2020, 92, 8364–8370 CrossRef CAS PubMed.
- J. Sun, L. Li, S. Ge, P. Zhao, P. Zhu, M. Wang and J. Yu, ACS Appl. Mater. Interfaces, 2021, 13, 3645–3652 CrossRef CAS PubMed.
- X. Xu, R. Hou, P. Gao, M. Miao, X. Lou, B. Liu and F. Xia, Anal. Chem., 2016, 88, 2386–2391 CrossRef CAS PubMed.
- L.-P. Mei, X.-Y. Jiang, X.-D. Yu, W.-W. Zhao, J.-J. Xu and H.-Y. Chen, Anal. Chem., 2018, 90, 2749–2755 CrossRef CAS PubMed.
- S. Li, L. Xu, W. Ma, X. Wu, M. Sun, H. Kuang, L. Wang, N. A. Kotov and C. Xu, J. Am. Chem. Soc., 2016, 138, 306–312 CrossRef CAS PubMed.
- Q. Zhang, S. Liu, C. Du, Y. Fu, K. Xiao, X. Zhang and J. Chen, Anal. Chem., 2021, 93, 14272–14279 CrossRef CAS PubMed.
- S. Iijima and T. Ichihashi, Nature, 1993, 363, 603–605 CrossRef CAS.
- H. Tao, T. Wu, M. Aldeghi, T. C. Wu, A. Aspuru-Guzik and E. Kumacheva, Nat. Rev. Mater., 2021, 6, 701–716 CrossRef.
- Y. Wang, J. Mao, X. Meng, L. Yu, D. Deng and X. Bao, Chem. Rev., 2018, 119, 1806–1854 CrossRef PubMed.
- R. J. Chen, Y. Zhang, D. Wang and H. Dai, J. Am. Chem. Soc., 2001, 123, 3838–3839 CrossRef CAS PubMed.
- D. Eder, Chem. Rev., 2010, 110, 1348–1385 CrossRef CAS PubMed.
- T. Singh, S. Shukla, P. Kumar, V. Wahla, V. K. Bajpai and I. A. Rather, Front. Microbiol., 2017, 8, 1501 CrossRef PubMed.
- B. D. Chithrani, A. A. Ghazani and W. C. Chan, Nano Lett., 2006, 6, 662–668 CrossRef CAS PubMed.
- R. Wu, Z. Feng, J. Zhang, L. Jiang and J.-J. Zhu, TrAC, Trends Anal. Chem., 2022, 148, 116531 CrossRef CAS.
- S. Li and Q. Ma, Biosens. Bioelectron., 2022, 214, 114554 CrossRef CAS PubMed.
- Z.-Y. Song, Y.-Y. Li, W. Duan, X.-Y. Xiao, Z.-W. Gao, Y.-H. Zhao, B. Liang, S.-H. Chen, P.-H. Li and M. Yang, TrAC, Trends Anal. Chem., 2023, 116977 CrossRef CAS.
- Q. Yang, X. Huang, B. Gao, L. Gao, F. Yu and F. Wang, Analyst, 2023, 148, 9–25 RSC.
- S. Tripathi and R. Kaur, Opt. Commun., 2015, 352, 55–62 CrossRef CAS.
- I. Rathinamala, N. Jeyakumaran and N. Prithivikumaran, Vacuum, 2019, 161, 291–296 CrossRef CAS.
- H. E. Misak, R. Asmatulu, M. O'Malley, E. Jurak and S. Mall, Int. J. Smart Nano Mater., 2014, 5, 34–43 CrossRef.
- W. Yan, L. Xu, C. Xu, W. Ma, H. Kuang, L. Wang and N. A. Kotov, J. Am. Chem. Soc., 2012, 134, 15114–15121 CrossRef CAS PubMed.
- H. Liu, Y. Lou, F. Zhou, H. Zhu, E. Abdel-Halim and J.-J. Zhu, Biosens. Bioelectron., 2015, 71, 249–255 CrossRef CAS PubMed.
- Y. Zheng, X. Wang, S. He, Z. Gao, Y. Di, K. Lu, K. Li and J. Wang, Biosens. Bioelectron., 2018, 126, 261–268 CrossRef PubMed.
- J. Wang, X. Wang, H. Tang, Z. Gao, S. He, J. Li and S. Han, Biosens. Bioelectron., 2018, 100, 1–7 CrossRef CAS PubMed.
- W. W. Yu, L. H. Qu, W. Z. Guo and X. G. Peng, Chem. Mater., 2004, 16, 560 CrossRef CAS.
- L. Tian, J. Qi, K. Qian, O. Oderinde, Q. Liu, C. Yao, W. Song and Y. Wang, J. Electroanal. Chem., 2018, 812, 1–9 CrossRef CAS.
- B. Dou, L. Xu, B. Jiang, R. Yuan and Y. Xiang, Anal. Chem., 2019, 91, 10792–10799 CrossRef CAS PubMed.
- Y. Tang, Y. Dai, X. Huang, L. Li, B. Han, Y. Cao and J. Zhao, Anal. Chem., 2019, 91, 7531–7537 CrossRef CAS PubMed.
- J. Liu, J. Cai, H. Chen, S. Zhang and J. Kong, J. Electroanal. Chem., 2016, 781, 103–108 CrossRef CAS.
|
| This journal is © The Royal Society of Chemistry 2023 |
Click here to see how this site uses Cookies. View our privacy policy here. 
 Open Access Article
 This Open Access Article is licensed under a Creative Commons Attribution-Non Commercial 3.0 Unported Licence
 *
*