 Open Access Article
Molecular dynamics study of fluorosulfonyl ionic liquids as electrolyte for electrical double layer capacitors†
Siqi Wanga,
Zhuo Lia,
Guangmin Yang*a,
Jianyan Lin *a and
Qiang Xu*b
aCollege of Physics, Changchun Normal University, Changchun 130032, China. E-mail: yangguangmin@mail.ccsfu.edu.cn; linjy994@nenu.edu.cn
bCollege of Prospecting and Surveying Engineering, Changchun Institute of Technology, Changchun 130021, China. E-mail: 627287881@qq.com
First published on 13th October 2023
Abstract
The development of high-performance supercapacitors is an important goal in the field of energy storage. Ionic liquids (ILs) are promising electrolyte materials for efficient energy storage in supercapacitors, because of the high stability, low volatility, and wider electrochemical stability window than traditional electrolytes. However, ILs-based supercapacitors usually show a relatively lower power density owing to the inherent viscosity-induced low electrical conductivity. Fluorosulfonyl ILs have aroused much attention in energy storage devices due to its low toxicity and excellent stability. Here, we propose that structural modification is an effective way to improve the energy storage performance of fluorosulfonyl ILs through the classical molecular dynamics (MD) method. Four fluorosulfonyl ILs with different sizes and symmetries were considered. Series of properties including conductivity, interface structure, and double-layer capacitance curves were systematically investigated. The results show that smaller size and more asymmetric structure can enhance self-diffusion coefficient and conductivity, and improve the electrochemical performance. Appropriate modification of the electrodes can further enhance the capacitive performance. Our work provides an opportunity to further understand and develop the fluorosulfonyl ILs electrolyte in supercapacitors.
Introduction
With the increasing scarcity of traditional energy sources and the growing problem of environmental pollution, it is urgent to develop clean and efficient energy.1,2 Compared with traditional energy sources, renewable energy such as solar energy, wind energy and water energy, are easily affected by regional, seasonal and climatic conditions. Therefore, it is of high requirements to develop new energy storage devices. Electrical double layer capacitors (EDLCs) have attracted much attention because of their high output power, long life, safety and high efficiency, which could serve as an excellent energy storage system.3–5 However, the energy density of EDLCs is much lower than that of lithium-ion batteries, severely limiting their applications.6 One of the effective ways to improve the energy density of supercapacitors is to select appropriate electrolytes with a wide electrochemical window.7 Ionic liquids (ILs) exist in liquid states at room temperature and exhibit many excellent physical and chemical properties, such as wide electrochemical stability window, high chemical and thermal stability, and extremely low volatility.8,9 Because of the unique performance and environmental protection characteristics, ILs have been widely used in many advanced chemical engineering devices, including supercapacitors,10–12 lithium-ion batteries,13,14 lithium–sulfur batteries,15 and so on.The electrical double layer is formed between the charged electrode surface and the oppositely charged ions. The chemical structure of ILs may affect the formation process of the electrical double layer.14–18 In order to reveal the formation mechanism and the properties of the electric double layer constructed by ILs, a lot of experimental and theoretical studies have been carried out in recent years.16–19 However, the effects of size/geometry and ion interactions on the microstructure and the performance of the electric double layer have rarely been investigated. S. Jo et al. found that the size and distribution of ions affected both the double-layer structure and capacitor behavior through the decreased differential capacitance with the increase of alkyl chain length of imidazolidyl ionic liquid.20 Wang et al. simulated anions with different geometries and sizes in capacitors, and proposed that large size anions could inhibit ion motion and improve the capacitance under high voltage.21 Dou et al. modified the IL structure by grafting silica group, which increased the energy density of the EDLC and greatly improved the cycle stability.22 Therefore, adjusting the size/geometry of the ions significantly affects the performance of supercapacitors.
Bis(trifluoromethyl sulfonyl)imide (TFSI), with low toxicity, excellent electrochemical and thermal stability,23 has been popularly used in energy storage devices.24–29 The delocalized negative charge on the entire O–S–N skeleton and the steric hindrance effect of fluoroalkyl groups give rise to the strong stability and weak coordination reactivity of TFSI,30 which is beneficial to achieving excellent electrochemical performances. However, the symmetric geometry of TFSI anions may cause relatively high melting points and viscosities, limiting the conductivity of the ILs.31,32 For fluorinated sulfonyl ILs, the conventional method to improve the electrochemical performances is to modify the anions. One approach is to extend or shorten the perfluoroalkyl chain.33 Another method is to introduce substituents to reduce the symmetries.34 Thus, we attempt to modify TFSI anion through these two methods to construct efficient electrolytes of high-temperature supercapacitors.
In this work, we systematically investigate the IL electrolytes of fluorosulfonyl anions with different sizes and symmetric structures by molecular dynamics (MD) simulation to further understand the effect of the IL geometries on the performance of EDLCs. Imidazole ion (EMIM) was selected as the complement cation. Four anions with different sizes and symmetries were selected, including TFSI, bis(fluorosulfonyl)imide (FSI),35 2,2,2-trifluoro-N-(trifluoromethyl sulfonyl) acetamide (TSAC)36 and 2,2,2-(trifluoromethyl)sulfonyl-N-cyanoamide (TFSAM).34,37 Based on the analysis of number density, ion orientation and charge potential distribution, the interface structure of fluorinated sulfonyl anions near the electrode is clarified. The results show that the modified fluorosulfony ILs is more suitable as the electrolyte for supercapacitors. In addition, the effects of introducing defects to graphene electrode on the capacitance of EDLCs were also investigated. The results show that the defect graphene can further improve the capacitance performance.
Methods
The atomic structures of anions used in this simulation system are shown in Fig. 1. The cation is 1-ethyl-3-methyl imidazolium (EMIM), and the anions are four fluorosulfonyl anions with different structures and sizes, namely TFSI, FSI, TSAC, TFSAM. We constructed a 30 × 32 × 100 Å3 graphene electrode model and randomly placed the ionic liquid into the 3D model, as shown in Fig. 1a. The density was determined by NPT ensemble simulation at 350 K and 1 atm. Three-dimensional periodic boundary conditions were adopted, and a 40 Å vacuum layer was set in the z direction to avoid interference caused by adjacent boxes under periodic boundary conditions. In this simulation, OPLS force field model was used to describe the interactions between atoms and molecules.38,39 The reliability and accuracy of this force field have been demonstrated in previous studies.40–43 The parameters of the Lennard-Jones force field between different kinds of elements were obtained by using the Lorentz–Berthelot mixed rules εij = (εiiεjj)½ and σij = (σii + σjj)/2.44 The large-scale atomic/olecular massively parallel simulator (Lammps) software package was used to complete the molecular dynamics simulations.45 The canonical ensemble (NVT) was selected in the simulation, and the Nose–Hoover constant temperature method was used to maintain a constant temperature of 350 K.46 The time step for the evolution calculation of Newton's equation of motion was set to 1 fs. During the simulation, the position of the electrode remains fixed and the electrolyte molecules/ions can move freely. The spherical cut-off of intermolecular van der Waals and Coulomb interactions was set as 10 Å. The long range electrostatic action was calculated in K-space using the particle–particle particle–mesh (PPPM) algorithm.47 We used the fixed charge method (FCM)48 to complete the simulation. Due to the high viscosity of ionic liquid, 1 ns was set to achieve high temperature equilibrium at the start of the simulation process, followed by an equilibrium simulation of 30 ns, and a final data output simulation of 30 ns.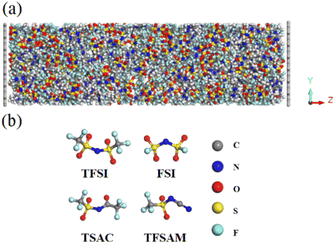 | ||
| Fig. 1 (a) The simulation model of double layer capacitor. (b) The structures of the four fluorinated sulfonyl anions. | ||
Results and discussion
In order to explore the performance of the four ILs, 256 pairs of ionic liquids were randomly placed into a cubic box. Four anions with different sizes and symmetries were selected, i.e. TFSI, FSI, TSAC, and TFSAM (Fig. 1b). FSI is the short homologue of TFSI, with the absence of two-end trifluoromethyl groups. TFSAM is an asymmetric distortion for TFSI, with the one-side substitution of cyanogroup for trifluoromethyl sulfonyl group. TSAC is another weak asymmetric distortion for TFSI, in which only one sulfonyl group is replaced by a carbonyl group. The high degree of fluorination leads to delocalisation of the negative charge, thus reducing coordination tendency of the anion. Smaller anions have more concentrated negative charge distribution. The half-fluorinated anions are more flexible.49,50 First, the system ran for 2 ns under the NPT ensemble (T = 350 K, P = 1 atm), and then continued to run for 10 ns under the NVT ensemble (T = 350 K) to achieve the equilibrium of the system. Finally, the data was collected in a 2 ns-simulation.To investigate the effect of the ILs geometry on the viscosity, we performed the mean squared displacement (MSD) calculations. According to the simulated trace, the curve of MSD as a function of the time can be obtained. The self-diffusion coefficient of ionic liquid is calculated based on the MSD curve by using the established formula:
 | (1) |
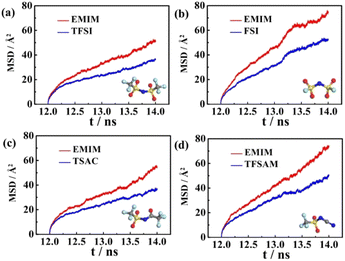
The corresponding beta factors51,52 are shown in Table S2.† Beta factors are used to assure that simulations are within the diffusive regime. The MSD curves of the four electrolytes increase approximately linearly with the simulation time (Fig. 2), indicating the fluid properties of ILs. A higher diffusion rate is related to a lower viscosity. It is noteworthy that the diffusion rates of EMIMFSI and EMIMTFSAM are effectively enhanced, which can be attributed to the small size of FSI anion and the asymmetrical characteristic of TFSAM anion. However, the diffusion rate of EMIMTSAC is not obviously increased compared with EMIMTFSI, owing to the weak asymmetry of TSAC anion. Therefore, the shorter size and the more asymmetry of the anions play a key role in increasing the diffusion rate.
We further simulated the electrical conductivities of the four ILs. According to Nernst–Einstein, the relationship between diffusion coefficient and electrical conductivity is as follows:
 | (2) |
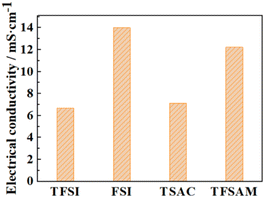
Owing to the high symmetry, EMIMTFSI has high viscosity, which causes a lower power density of supercapacitors. Reducing the viscosity to increase the conductivity of IL electrolyte is an effective method to give consideration to both power density and energy density.53,54 After modification, the electrical conductivities of EMIMFSI and EMIMTFSAM are remarkably higher than that of EMIMTFSI, while EMIMTSAC has a relatively small conductivity increment (Fig. 3). The structure of anions has been discussed previously. Increased flexibility leads to greater conductivity.49,50 Therefore, a shorter skeleton and a more asymmetric structure of fluorinated sulfonyl anions are more beneficial to improving the conductivity. It should be pointed out that the conductivity calculated by Nernst–Einstein is generally lower than the experimental value, which may be due to the fact that we use the non-polarized force field. When a molecule with a charge or dipole moment approaches another molecule, electron density may transfer between different atoms or between atoms and chemical bonds. However, fixed charged force fields cannot accurately describe this situation.55 The non-polarized force field overestimates the interacting forces between the anions and cations.56 However, the relative trend of the calculated conductivity for the different electrolytes is consistent with the experimental results, which allows us to compare the relative conductivity values of the four ILs through our simulations.57,58 To verify the accuracy of our results, we compared the self-diffusion coefficient with the conductivity using the OPLS-VSIL force field59,60(Fig. S1, Tables S3 and S4†). The simulation results of OPLS-VSIL force field are basically consistent with the trend of OPLS force field simulation results. It is worth noting that the self-diffusion coefficient of EMIMTFSAM simulated by OPLS-VSIL is significantly increased, but the density value of EMIMTFSAM simulated by OPLS-VSIL is low, resulting in a decrease in electrical conductivity.
In order to investigate the effect of electrode surface electric field on the distribution of different ILs, we constructed charged models. The charged graphene electrode is simulated by adding extra charge to the carbon atoms on the graphene electrode. Additional positive/negative charges were added to the graphene positive/negative electrode at z = 0 Å (100 Å). The number density distribution of the four ILs along the vertical direction of the electrode was calculated to describe the interface microstructure and properties of the electrical double layer in supercapacitors.61 The mathematical expression is as follows:
 | (3) |
Fig. 4 shows the number density distribution of the electrolyte ions near the electrodes. The fluctuation of the curves represents the stratification of the ions, which is mainly caused by van der Waals force, making ILs adsorb on the surface of the graphene electrode. With the distance between the ILs and the electrode surface increases, the van der Waals force decreases, resulting in a reduction of the number density. Obviously, the number density peak, corresponding to the ion distribution number, of EMIMFSI is much higher than the other three ILs, which is attributed to the smaller size of FSI anion. Moreover, the distributions of cations and anions on the graphene electrode surface are slightly different due to the difference of van der Waals forces. Compared with the fluorinated sulfonyl anions, EMIM cations are more likely to adsorb on the non-charged electrodes because of the strong π–π interaction between imidazolyl groups and the graphene surface.62
 | ||
| Fig. 4 Number density distribution of EMIMTFSI, EMIMFSI, EMIMTSAC, and EMIMTFSAM under uncharging conditions. | ||
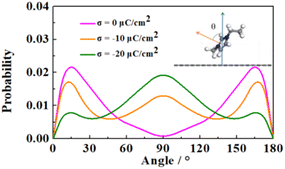
In order to further analyze the distribution properties of the cations on the negative electrode, we calculated the orientation distribution of the cationic imidazole rings (Fig. 5). θ is the angle between the normal vectors of the cationic imidazole ring and the negative electrode surface. The four IL electrolytes showed similar behavior. At low charge conditions, the orientation distribution of imidazole rings mainly concentrated around 0° and 180°, corresponding to the parallel orientations to the electrode surface, consistent with the experimental results.63 With the increase of the charge, the orientation of cationic imidazole ring gradually changes from 0° or 180° to 90° (i.e., from parallel to perpendicular). We attribute this transformation to the reduced overlap between the π orbital of the imidazole cation and the vacant orbital of the graphene electrode, resulting in more cation filling to compensate for the negative charge.64
Average charge density is a common method to characterize electrode potential and differential capacitance. Here, the mean charge density distribution (ρα) is defined as:
 | (4) |
We further calculate the electrode potential difference between two parallel graphene electrodes through integrating the mean charge density curve according to the Poisson's equation, which is expressed as follows:
| ▽2φ(z) = −σ(z)/ε0 | (5) |
 | (6) |
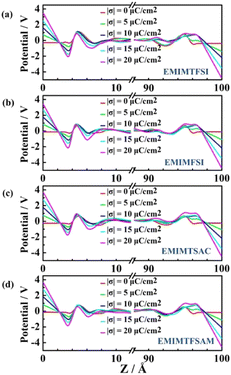
Under the uncharged condition, the electric double layer potential between the electrode surface and the ionic liquid also changes. As shown in Fig. 7, the charge distribution curve of the ionic liquid fluctuates obvious near the electrode surface, leading to a weak double electric layer potential difference, which is called the potential of zero charge (PZC). Notably, the PZC value becomes less negative in the electrolyte with shorter size or more asymmetric anions. When PZC is negative, the electrode will adsorb cations. The smaller the absolute value of PZC is, the weaker the anodic repulsive effect is and the stronger the adsorption performance is. As the charge density on the electrode surface increases, the double layer potential becomes larger. For the same electrode charge density, the absolute value of the double layer potential of the positive electrode is smaller than that of the negative electrode, which is mainly due to the higher filling efficiency of the anions than the cations on the electrode surface and the different polarization degrees of the atomic charges between the cations and the anions.
 | ||
| Fig. 6 The electrolyte charge distribution of EMIMTFSI, EMIMFSI, EMIMTSAC and EMIMTFSAM, respectively. | ||
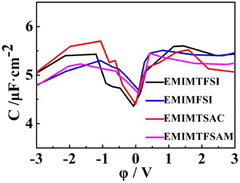
As shown in Fig. 8, the double-layer capacitance curves of the four fluorinated sulfonyl electrolytes show similar trends, which is asymmetrical in a camel shape, with the anode capacitance slightly higher than the cathode (except for EMIMTSAC), similar to the results in the experiment with the glass carbon electrode.65,66 The capacitance peak near PZC represents the adsorption and resolution of anions and cations.67 At low potential conditions, the three modified fluorinated sulfonyl electrolytes show higher filling ratios, leading to higher energy densities. The shielding efficiency of anions with small size, which have fewer sites for reaction and more localized charge distribution, makes anode capacitance become obviously higher than the cathode capacitance. When the potential increases, anions are gradually expelled from the double layer, and more cations replace them at high negative potential. Therefore, at higher negative voltage, the larger the anion size, the higher the double-layer capacitance value.
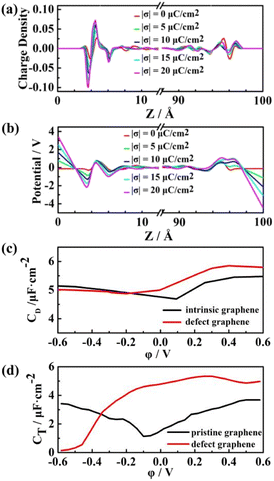
The total capacitance (CT) of EDLCs is affected by quantum capacitance (CQ) and double-layer capacitance (CD).68,69 Our previous study has shown that the quantum capacitance of graphene can be enhanced significantly by doping with three N atoms accompanied by vacancy.70 In this work, we further discuss the capacitance with this defect graphene electrodes. The pristine and defect graphene electrodes are shown in Fig. S2(a and b).† EMIMFSI electrolytes with excellent double-layer capacitance are randomly filled into two defect graphene electrodes to serve as the initial model for EDLC. Due to the difference of electronegativity and the valence electron number between C atoms and the substituted N atoms, the occurrence of charge redistribution results in the local polarization of electrodes. The Gasteiger method71 is used to obtain the charge distribution of N atom and its adjacent C atom. Local charge distribution of defective graphene electrode is shown in Fig. S2(c).† Compared with pristine graphene, the defect graphene electrode has a stronger attraction to the ILs, resulting in a shorter distance between the electrolyte and electrode and a larger peak value (Fig. 9). This phenomenon is more apparent on the positive electrodes than the negative ones.
As shown in Fig. 10a, the charge coverage on the surface of the defect graphene electrode is significantly higher than that of pristine graphene (Fig. 6). From the potential distribution of the two electrodes, the potential of the defect graphene electrode/ILs is slightly smaller than that of the pristine graphene, which is caused by the increased polarization of the defect graphene electrode surface. Both pristine and defect graphene electrodes show the asymmetric camel shape (Fig. 10c). The positive capacitance is greater than the negative capacitance under the same electrode potential. Moreover, the double-layer capacitance of the defect graphene is significantly improved at positive potential, indicating that the defect graphene electrode can not only enhance the quantum capacitance, but also significantly develop the double-layer capacitance. The total capacitance of the defect graphene electrode was fitted combined with the previously calculated quantum capacitance,63 which is more conducive to improving the performance of fluorosulfonyl ILs-based EDLCs compared with the pristine one (Fig. 10d).
Conclusions
In summary, we performed molecular dynamics simulation for four fluorinated sulfonyl ILs ([EMIM][TFSI], [EMIM][FSI], [EMIM][TFSAM] and [EMIM][TSAC]) to calculate their performance as electrolytes in supercapacitors. The electrical conductivity, interface structure and double-layer capacitance performance were simulated. We found that reducing size and introducing asymmetries could improve transport performance and conductivity, thus increasing the power density of supercapacitors. The change of anionic configuration of fluorosulfonyl ILs had a certain impact on the double-layer structure and capacitance performance. Size reduction and the introduction of asymmetry could improve the double-layer capacitance of EDLCs in low voltage range, thereby increasing energy density. Therefore, structural modification on anions can be used as an efficient method in supercapacitors to obtain better double-layer capacitance performance. The defect graphene electrode with 3N-doping and vacancy can further enhance the capacitance of fluorosulfonyl ILs-based EDLCs, awaiting for a future confirmation.Conflicts of interest
The authors declare no competing financial interest.Acknowledgements
This work was supported by the Natural Science Foundation of Jilin Province (Grant No. YDZJ202101ZYTS158).References
- Z. Zhang, T. Ding, Q. Zhou, Y. Sun and F. Chi, Renewable Sustainable Energy Rev., 2021, 148, 111263 CrossRef.
- S. Sanyal and D. J. Wuebbles, Earth's Future, 2022, 10, e2021EF002558 CrossRef CAS.
- J. Zhao and A. F. Burke, J. Energy Chem., 2020, 59, 276–291 CrossRef.
- H. M. Coromina, B. Adeniran, R. Mokaya and D. A. Walsh, J. Mater. Chem. A, 2016, 4, 14586–14594 RSC.
- J. Wang, J. Tang, Y. Xu, B. Ding, Z. Chang, Y. Wang, X. Hao, H. Dou, J. H. Kim and X. Zhang, Nano Energy, 2016, 28, 232–240 CrossRef CAS.
- K. Chen and D. Xue, J. Mater. Chem. A, 2016, 4, 7522–7537 RSC.
- S. Verma, B. Padha and P. Mahajan, ECS Trans., 2022, 107, 10821–10829 CrossRef.
- F. Wu, N. Zhu, Y. Bai, L. Liu and C. Wu, ACS Appl. Mater. Interfaces, 2016, 8, 21381–21386 CrossRef CAS PubMed.
- Y. Wen-Li, Y. Xiao, H. Ling, X. Ying, Q. Song and T. Guo-Hong, Front. Chem., 2018, 6, 59 CrossRef PubMed.
- L. Yin, S. Li, X. Liu and T. Yan, Sci. China Mater., 2019, 62, 1537–1555 CrossRef CAS.
- S. Selvam, Y. K. Park and J. H. Yim, Adv. Sci., 2022, 9, 2201890 CrossRef CAS PubMed.
- S. Fleischmann, M. Widmaier, A. Schreiber, H. Shim, F. M. Stiemke, T. J. Schubert and V. Presser, Energy Storage Mater., 2019, 16, 391–399 CrossRef.
- G. Li, Z. Su, M. Li, F. Yang, M. H. Aldamasy, J. Pascual, F. Yang, H. Liu, W. Zuo and D. Di Girolamo, Adv. Energy Mater., 2021, 11, 2101539 CrossRef CAS.
- H. Qi, Y. Ren, S. Guo, Y. Wang, S. Li, Y. Hu and F. Yan, ACS Appl. Mater. Interfaces, 2019, 12, 591–600 CrossRef PubMed.
- O. Sheng, C. Jin, J. Luo, H. Yuan, C. Fang, H. Huang, Y. Gan, J. Zhang, Y. Xia and C. Liang, J. Mater. Chem. A, 2017, 5, 12934–12942 RSC.
- B. Demir, K. Y. Chan and D. J. Searles, Macromolecules, 2020, 53, 7635–7649 CrossRef CAS.
- L. Dick, T. Stettner, Y. Liu, S. Liu, B. Kirchner and A. Balducci, Energy Storage Mater., 2022, 53, 744–753 CrossRef.
- E. Schmidt, S. Shi, P. P. Ruden and C. D. Frisbie, ACS Appl. Mater. Interfaces, 2016, 8, 14879–14884 CrossRef CAS PubMed.
- A. C. Forse, C. Merlet, J. M. Griffin and C. P. Grey, J. Am. Chem. Soc., 2016, 138, 5731–5744 CrossRef CAS PubMed.
- S. Jo, S.-W. Park, Y. Shim and Y. Jung, Electrochim. Acta, 2017, 247, 634–645 CrossRef CAS.
- Y. Wang, C. Qian, F. Huo, J. Qin and H. He, J. Mater. Chem. A, 2020, 8, 19908–19916 RSC.
- Q. Dou, C. Lian, S. Lei, J. Chen, H. Liu and X. Yan, Energy Storage Mater., 2019, 18, 253–259 CrossRef.
- H. Jeon and D. Kim, J. Membr. Sci., 2021, 624, 119029 CrossRef CAS.
- A. Wang, W. Yuan, J. Fan and L. Li, Energy Technol., 2018, 6, 2172–2178 CrossRef CAS.
- M. Deyab, Electrochim. Acta, 2017, 244, 178–183 CrossRef CAS.
- D. Du, H. Li, H. Xu, Y. Zhang, Y. Sun, D. Zeng and H. Cheng, J. Alloys Compd., 2021, 881, 160573 CrossRef CAS.
- M. Ravi, S. Kim, F. Ran, D. S. Kim, Y. M. Lee and M.-H. Ryou, J. Membr. Sci., 2021, 621, 119018 CrossRef CAS.
- V. Sundararajan, G. Selvaraj, H. Ng, S. Ramesh, K. Ramesh, C. Wilfred and S. Bashir, Electrochim. Acta, 2017, 240, 361–370 CrossRef CAS.
- L. Zhang, Z. Liu, G. Wang, J. Feng and Q. Ma, Nanoscale, 2021, 13, 17068–17076 RSC.
- H. Willner and F. Aubke, Angew. Chem., Int. Ed. Engl., 1997, 36, 2402–2425 CrossRef CAS.
- Z. B. Zhou, H. Matsumoto and K. Tatsumi, Chem. – Eur. J., 2004, 10, 6581–6591 CrossRef CAS PubMed.
- H. Zhang, X. Cheng, Q. Ma, W. Feng, L. Zheng, J. Nie, X. Huang, M. Armand and Z. Zhou, Electrochim. Acta, 2016, 207, 66–75 CrossRef CAS.
- H. Shobukawa, J. Shin, J. Alvarado, C. S. Rustomji and Y. S. Meng, J. Mater. Chem. A, 2016, 4, 15117–15125 RSC.
- J.-P. Hoffknecht, M. Drews, X. He and E. Paillard, Electrochim. Acta, 2017, 250, 25–34 CrossRef CAS.
- X. Wang, F. Chen, G. M. Girard, H. Zhu, D. R. MacFarlane, D. Mecerreyes, M. Armand, P. C. Howlett and M. Forsyth, Joule, 2019, 3, 2687–2702 CrossRef CAS.
- H. Matsumoto, H. Sakaebe and K. Tatsumi, J. Power Sources, 2005, 146, 45–50 CrossRef CAS.
- Y. V. Nelyubina, A. S. Shaplov, E. I. Lozinskaya, M. I. Buzin and Y. S. Vygodskii, J. Am. Chem. Soc., 2016, 138, 10076–10079 CrossRef CAS PubMed.
- A. S. Gouveia, C. E. Bernardes, L. C. Tomé, E. I. Lozinskaya, Y. S. Vygodskii, A. S. Shaplov, J. N. C. Lopes and I. M. Marrucho, Phys. Chem. Chem. Phys., 2017, 19, 29617–29624 RSC.
- C. E. Bernardes and J. N. Canongia Lopes, J. Chem. Theory Comput., 2017, 13, 6167–6176 CrossRef CAS PubMed.
- A. Wettstein, D. Diddens and A. Heuer, Phys. Chem. Chem. Phys., 2022, 24, 6072–6086 RSC.
- L. Hakim, Y. Ishii, K. Matsumoto, R. Hagiwara, K. Ohara, Y. Umebayashi and N. Matubayasi, J. Phys. Chem. B, 2020, 124, 7291–7305 CrossRef CAS PubMed.
- T. C Lourenço, M. Ebadi, M. J Panzer, D. Brandell and L. T Costa, J. Comput. Chem., 2021, 42, 1689–1703 CrossRef PubMed.
- J. M. Esperança, M. Tariq, A. B. Pereiro, J. M. Araújo, K. R. Seddon and L. P. N. Rebelo, Front. Chem., 2019, 7, 450 CrossRef PubMed.
- B. Hess, C. Kutzner, D. Van Der Spoel and E. Lindahl, J. Chem. Theory Comput., 2008, 4, 435–447 CrossRef CAS PubMed.
- S. Plimpton, J. Comput. Phys., 1995, 117, 1–19 CrossRef CAS.
- W. G. Hoover, Phys. Rev. A, 1985, 31, 1695 CrossRef PubMed.
- B. A. Luty, M. E. Davis, I. G. Tironi and W. F. Van Gunsteren, Mol. Simul., 1994, 14, 11–20 CrossRef CAS.
- C. Zhan, C. Lian, Y. Zhang, M. W. Thompson, Y. Xie, J. Wu, P. R. Kent, P. T. Cummings, D. e. Jiang and D. J. Wesolowski, Advanced Science, 2017, 4, 1700059 CrossRef PubMed.
- F. Philippi, D. Rauber, O. Palumbo, K. Goloviznina, J. McDaniel, D. Pugh, S. Suarez, C. C. Fraenza, A. Padua and C. W. Kay, Chem. Sci., 2022, 13, 9176–9190 RSC.
- Y. K. Bejaoui, F. Philippi, H.-G. Stammler, K. Radacki, L. Zapf, N. Schopper, K. Goloviznina, K. A. Maibom, R. Graf and J. A. Sprenger, Chem. Sci., 2023, 14, 2200–2214 RSC.
- C. A. Angell, N. Byrne and J.-P. Belieres, Acc. Chem. Res., 2007, 40, 1228–1236 CrossRef CAS PubMed.
- E. J. Maginn, R. A. Messerly, D. J. Carlson, D. R. Roe and J. R. Elliot, Living J. Comp. Mol. Sci., 2019, 1, 6324 Search PubMed.
- J. Feng, Y. Wang, Y. Xu, Y. Sun, Y. Tang and X. Yan, Energy Environ. Sci., 2021, 14, 2859–2882 RSC.
- M. P. Mousavi, B. E. Wilson, S. Kashefolgheta, E. L. Anderson, S. He, P. Bühlmann and A. Stein, ACS Appl. Mater. Interfaces, 2016, 8, 3396–3406 CrossRef CAS PubMed.
- G. Jeanmairet, B. Rotenberg and M. Salanne, Chem. Rev., 2022, 122, 10860–10898 CrossRef CAS PubMed.
- S. Tsuzuki, W. Shinoda, H. Saito, M. Mikami, H. Tokuda and M. Watanabe, J. Phys. Chem. B, 2009, 113, 10641–10649 CrossRef CAS PubMed.
- M. Kowsari, S. Alavi, M. Ashrafizaadeh and B. Najafi, J. Chem. Phys., 2008, 129, 224508 CrossRef CAS PubMed.
- J. Picálek and J. Kolafa, J. Mol. Liq., 2007, 134, 29–33 CrossRef.
- B. Doherty, X. Zhong and O. Acevedo, J. Phys. Chem. B, 2018, 122, 2962–2974 CrossRef CAS PubMed.
- B. Doherty, X. Zhong, S. Gathiaka, B. Li and O. Acevedo, J. Chem. Theory Comput., 2017, 13, 6131–6145 CrossRef CAS PubMed.
- L. Yang, B. H. Fishbine, A. Migliori and L. R. Pratt, J. Am. Chem. Soc., 2009, 131, 12373–12376 CrossRef CAS PubMed.
- M. Vijayakumar, B. Schwenzer, V. Shutthanandan, J. Hu, J. Liu and I. A. Aksay, Nano Energy, 2014, 3, 152–158 CrossRef CAS.
- M. Li, A. S. Westover, R. Carter, L. Oakes, N. Muralidharan, T. C. Boire, H.-J. Sung and C. L. Pint, ACS Appl. Mater. Interfaces, 2016, 8, 19558–19566 CrossRef CAS PubMed.
- V. Lockett, R. Sedev, J. Ralston, M. Horne and T. Rodopoulos, J. Phys. Chem. C, 2008, 112, 7486–7495 CrossRef CAS.
- J. M. Klein, E. Panichi and B. Gurkan, Phys. Chem. Chem. Phys., 2019, 21, 3712–3720 RSC.
- M. Jitvisate and J. R. Seddon, J. Phys. Chem. Lett., 2018, 9, 126–131 CrossRef CAS PubMed.
- M. Shi, S. Kou and X. Yan, ChemSusChem, 2014, 7, 3053–3062 CrossRef CAS PubMed.
- E. Paek, A. J. Pak, K. E. Kweon and G. S. Hwang, J. Phys. Chem. C, 2013, 117, 5610–5616 CrossRef CAS.
- A. J. Pak, E. Paek and G. S. Hwang, Phys. Chem. Chem. Phys., 2013, 15, 19741–19747 RSC.
- G. Yang, H. Zhang, X. Fan and W. Zheng, J. Phys. Chem. C, 2015, 119, 6464–6470 CrossRef CAS.
- J. Gasteiger and M. Marsili, Tetrahedron, 1980, 36, 3219–3228 CrossRef CAS.
Footnote |
| † Electronic supplementary information (ESI) available. See DOI: https://doi.org/10.1039/d3ra04798a |
| This journal is © The Royal Society of Chemistry 2023 |

