 Open Access Article
Phosphorus-substitution effect on the phase stabilization, electrical and spectroscopic properties of LAMOX-based electrolyte for solid oxide fuel cells
Noureddine Mhadhbiab,
Wiem Jabeura,
Ahlem Guesmic,
Ammar Houasd,
Naoufel Ben Hamadic and
Houcine Naïli *a
*a
aLaboratory Physico Chemistry of the Solid State, Department of Chemistry, Faculty of Sciences, University of Sfax, BP 1171, Sfax 3000, Tunisia. E-mail: houcine.naili@fss.rnu.tn
bUniversity of Monastir, Preparatory Institute for Engineering Studies of Monastir, Monastir 5019, Tunisia
cChemistry Department, College of Science, IMSIU (Imam Mohammad Ibn Saud Islamic University), P.O. Box 5701, Riyadh 11432, Saudi Arabia
dResearch Laboratory of Catalysis and Materials for Environment and Processes, University of Gabes, City Riadh Zerig, Gabes 6029, Tunisia
First published on 16th October 2023
Abstract
A series of P5+ – doped La2Mo2O9 phases with different concentrations of P5+ were prepared using conventional solid–state reactions. The formation of phase-pure P5+-doped La2Mo2O9 has been monitored by powder X-ray diffraction, thermal analysis, conductivity measurements, Raman, and FT-IR absorption techniques. The structure and lattice parameters of La2Mo2−yPyO9−y/2 are obtained from Rietveld refinement. The effect of substituting P for Mo reveals that the phase transition which occurs in La2Mo2O9 around 560 °C disappears when y > 0.02, as demonstrated by thermal analysis. Pure P5+-doped phases with monoclinic structure (α-form, the space group P21) were observed for the concentration of optically active ions up to y = 0.02. When the concentration of P5+ ions is higher, a cubic structure (β-form, the space group P213) starts to appear. However, up to the concentration of y = 0.03 of the P5+ ion a mixture of the monoclinic and cubic phases has been observed. From infrared and Raman analysis it is confirmed that different vibration modes arise from the vibration of molybdenum–oxygen bands. Mo–O bond lengths are also found to be independent of P-doping.
1. Introduction
There is currently considerable interest in finding competitive electrolytes to substitute the reference material yttria-stabilized zirconia (YSZ) in solid oxide fuel cell (SOFC). However, this electrolyte must be operated at 800–1000 °C to provide sufficient ionic conductivity. Such a high operating temperature limits the commercialization of SOFCs. Considerable effort has been exerted to develop alternative electrolytes possessing high ionic conductivities at intermediate temperatures (500–700 °C).1,2 La2Mo2O9 based materials (LAMOX) have been studied in last few years as potential solid electrolytes for intermediate temperature applications, such as oxygen sensor, dense membranes for oxygen separation and electrolyte for solid oxide fuel cells (SOFCs).3 The attention has moved to electrolytes based on the lone pair substitution (LPS) concept. A partial or complete substitution of the lone pair cation by a non-lone pair cation produces intrinsic oxygen vacancies. This concept was first discovered by P. Lacorre et al. in the year 2000.4,5 At around 580 °C, La2Mo2O9 goes through a structural phase transition from the low-temperature α-La2Mo2O9 monoclinic phase to the high-temperature β-La2Mo2O9 cubic phase accompanied by two orders of magnitude increase in conductivity.6–8 It has recently been reported that this phase transition is understood as a transformation from a static to a dynamic distribution of oxygen defects7,9,10 while keeping the monoclinic local structure.7 This phase transition is accompanied by a sudden increase of conductivity at higher temperatures that achieves about 6 × 10⁻² s cm−1 at 800 °C, limiting the potential applicability of La2Mo2O9 in SOFC. The current focus is on the stabilization of the intensely conducting β-phase. In this context, several series of compounds derived from La2Mo2O9, designated as LAMOX, have been investigated in the past several years, in which La3+, has been partially substituted by Ca2+, Gd3+, Y3+, K+, Sr2+, Ba2+, Bi3+, and Eu3+ and Mo6+ by Nb5+, Ta5+, Re6+, V5+, Cr6+, W6+ and S6+.11–18 In most cases, the β phase is stabilized to room temperature and the α/β phase transition is suppressed. Unfortunately, most of the substitutions decrease the conductivity at high temperatures in comparison with pure La2Mo2O9. Vastly researchers have reported different applications resulting from the use of the LAMOX family in various fields19–24 to achieve cell function success. This is due to several factors including the starting materials, the substituted element, and the type of atmospheric conditions used during the synthesis process.18 It is crucial to better understand how a substitution impacts the local patterns and the resulting material properties. LAMOX with molybdenum substituted by phosphorus is an example of a cationic substitution system in which saturation occurs at low concentrations as proved by Pahari et al., since 2012.25 The motivation for the present investigation was at first to determine the extent of the solid solution and then to obtain a better insight into the influence of phosphorus on the crystal structure, the thermal stability and the electrical properties. Also a correlation between the structural and ion conduction results has been established. From infrared and Raman analysis it is confirmed that different vibration modes arise from the vibration of molybdenum–oxygen bands. Mo–O bond lengths are also found to be independent of P-doping.2. Materials and methods
Two grams of polycrystalline samples of La2Mo2−yPyO9−y/2 (y = 0.01, 0.02, 0.03, 0.04, 0.05) were prepared by conventional solid–state reaction from elementary oxides molybdenum trioxide MoO3 (PURA-TREMs 99.999% from Strem Chemicals), diammonium hydrogenphosphate (NH4)2HPO4 (≥98% from Sigma Aldrich), and of lanthanum oxide La2O3 (reaction 99.9% from Alfa Aesar). The reaction between the reactants powders is written as follows:| La2O3 + (2 − y)MoO3 + y(NH4)2HPO4 → La2Mo2−yPyO9−y/2 + 2yNH3 + 1.5yH2O |
Before use, La2O3 was calcinated in the air for 12 h at 1000 °C to remove absorbed carbon dioxide. The stœchiometric mixture of La2O3, (NH4)2HPO4, and MoO3 was first heated at 500 °C for 12 h (heating and cooling rates of 5 °C min−1). Several annealing with regrinding in acetone is necessary to obtain a pure single phase. The final firing temperatures were 900, 950, 1000, 1100, 1150, and 1175 °C (heating and cooling rates of 5 °C min−1) for phosphorus content lower and higher than y = 0.03, respectively.
After completion, X-ray powder diffraction patterns were recorded at room temperature on a θ/θ Bragg–Brentano Philips X'pert MPD PRO diffractometer (CuKα1+2 radiations) equipped with the X'celerator detector. At room temperature, diffractograms were collected for 400 min in the [5–130°] scattering angle range, with a 0.084° step. Thermodiffractograms were collected on the same diffractometer equipped with an HTK 1200 Anton Paar chamber using an Al2O3 sample holder cup. Diffractograms were recorded under air flow from room temperature (RT) to 900 °C in the [9–130°] scattering angle range, with a 0.0084° step (heating rate of 10 °C min−1, temperature stabilization for 20 min with temperature correction after calibration). Crystal cell parameters were determined by full pattern matching refinement of the powder XRD patterns in space group P213 using the Fullprof program and the Diamond software was used to draw the crystal structure.26
Thermal analyses were performed on raw powders with a TGA/DTA Q600 SDT TA Instruments apparatus (Pt crucibles, Al2O3 as a reference) under airflow (100 mL min−1). For numerous compounds in powder form in La2Mo2−yPyO9−y/2 series, thermograms were collected on ∼100 mg samples in the RT-1400 °C range heating/cooling rate of 10 °C min−1.
Complex impedance measurements were performed on dense pellets, with thin platinum films (deposited by magnetron sputtering on both flat faces) as electrodes. The impedance spectra were recorded over the 32 MHz to 0.1 Hz frequency range (signal amplitude 50 mV) in dry airflow at high temperature using a Solartron SI 1260 frequency response analyzer combined with the Dielectric Interface (Solartron 1296). A 35 min thermalization time was applied before each measurement.
3. Results and discussion
3.1. XRD and thermal analysis
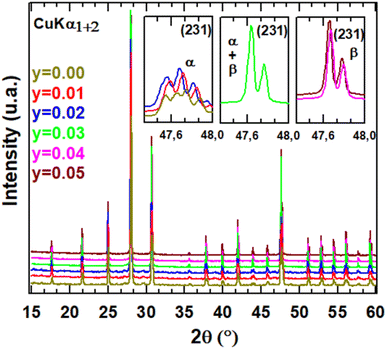
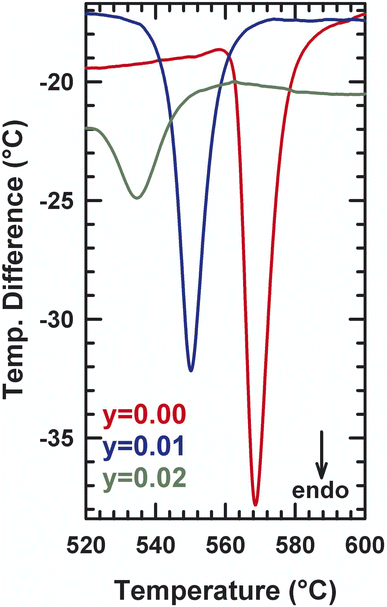
XRD patterns for different compositions of La2Mo2−yPyO9−y/2 at room temperature are shown in Fig. 1. The sharp and well-defined diffraction patterns indicate high range order of crystallinity. The unit cell parameters were obtained by the pattern-matching fit of diffractograms either in a single monoclinic subcell (space group P21 (no. 4)) for y = 0.02 or in a cubic cell (space group P213 (no. 298)) for y = 0.03. Along the series, the linear reduction of the unit cell volume with increasing the phosphorus content y reflect that the pentavalent phosphorus cation (ionic radii = 0.38 Å) is much smaller than molybdenum ion (ionic radii = 0.65 Å). The formation of a partial solid solution is then established in the composition range with all the studied samples being pure. The room temperature X-ray diffraction patterns of La2Mo1399P0.01O8.995 and La2Mo1.98P0.02O8.99 clearly exhibit the pic splitting characteristic of the slight monoclinic distortion and the 2 × 3 × 4 superstructure peaks at low 2θ scattering angles relative to the β-La2Mo2O9 form. This was confirmed by DT analysis in Fig. 2: an endothermic peak upon heating up associated with the reversible α → β structural phase transition was seen around 550–570 °C. With increasing phosphorus content, a slight shift of this transition toward higher temperatures is observed (Table 1). The reduction in the intensity of the thermal peak upon substitution is consistent with the slightly smaller monoclinic split-ting of the pseudocubic (231) diffraction line. The broadening of the peak (an increase of the difference between the temperature at the onset point and at the maximum peak in Table 1) reflects the increase of cationic disorder introduced by the phosphorus substitution.| α → β transition temperature (°C) | ||
|---|---|---|
| y | Onset | Peak max |
| 0.0 | 568 | 570 |
| 0.01 | 549 | 551 |
| 0.02 | 533 | 536 |
A DTA analysis has been performed on La2Mo1.98P0.02O8.99 in order to detect the influence of phosphorus substitution on the α/β phase transition. The main effect is a significant decrease of the phase transition of about 45 °C relative to La2Mo2O9: 580 °C for La2Mo2O9 and about 536 °C for La2Mo1.98P0.02O8.99.
This is consistent with the slightly smaller monoclinic splitting (see above) and the general trend of the β-phase stabilization upon substitution (see below). The thermal peaks upon heating and cooling are broader than those in La2Mo2O9, probably due to some heterogeneity in the substitution as already evoked in another phase transition of the system. Above a phosphorus content of y = 0.03, the stabilization of the cubic β-phase at room temperature occurs. Table 2 musters the results of these structural refinements: atomic positions, equivalent isotropic temperature factors, and anisotropic thermal stirring coefficient.
| x | 0.03 | 0.04 | 0.05 | |
|---|---|---|---|---|
| a Biso = 4/3a2(β11 + β22 + β33). | ||||
| a (Å) | 7.1525 (1) | 7.1514 (1) | 7.1494 (7) | |
| La (4a) (xxx) | x | 0.8546 (4) | 0.8542 (7) | 0.8551 (1) |
| Occupancy | 1 | 1 | 1 | |
| Biso (Å2)a | 4.7 (2) | 4.1 (9) | 4.6 (7) | |
| Mo/P (4a) | x | 0.1695 (7) | 0.1716 (8) | 0.1674 (4) |
| Occupancy | 0.985/0.015 | 0.980/0.02 | 0.975/0.025 | |
| Biso (Å2)a | 5.4 (4) | 5.4 (1) | 5.8 (5) | |
| O1 (4a) | x | 0.314 (8) | 0.317 (3) | 0.310 (9) |
| Occupancy | 1 | 1 | 1 | |
| Biso (Å2)a | 7 | 7 | 7 | |
| O2 (12b) (xyz) | x | 0.987 (2) | 0.960 (2) | 0.969 (3) |
| y | 0.148 (5) | 0.142 (9) | 0.200 (5) | |
| z | 0.360 (2) | 0.350 (1) | 0.347 (4) | |
| Occupancy | 0.65 (7) | 0.63 (7) | 0.64 (7) | |
| Biso (Å2)a | 7 | 7 | 7 | |
| O3 (12b) | x | 0.796 (5) | 0.780 (9) | 0.822 (3) |
| y | 0.534 (5) | 0.565 (5) | 0.563 (5) | |
| z | 0.599 (1) | 0.624 (4) | 0.576 (1) | |
| Occupancy | 0.50 (3) | 0.52 (3) | 0.51 (3) | |
| Biso (Å2)a | 7 | 7 | 7 | |
| Rwp (%) | 8.60 | 7.78 | 9.97 | |
| Rexp (%) | 4.52 | 5.33 | 6.05 | |
| RBragg (%) | 3.35 | 2.34 | 3.21 | |
3.2. Electrical properties
Observations on the electrical conductivity of specimens with varying phosphorous contents (Fig. 3) are helpful for describing polymorphism and studying the impact of the additive on the transport mechanism. To figure out the effect of the substituted amounts on the conduction mechanism, both Arrhenius and VTF (Vogel–Tammann–Fulcher) regimes are investigated. In the low-temperature zone, the electric field of the samples is linear and follows the well-known Arrhenius law (eqn (1)):| (σ × T) = σ0 exp(−ΔEa/kBT) | (1) |
 | (2) |
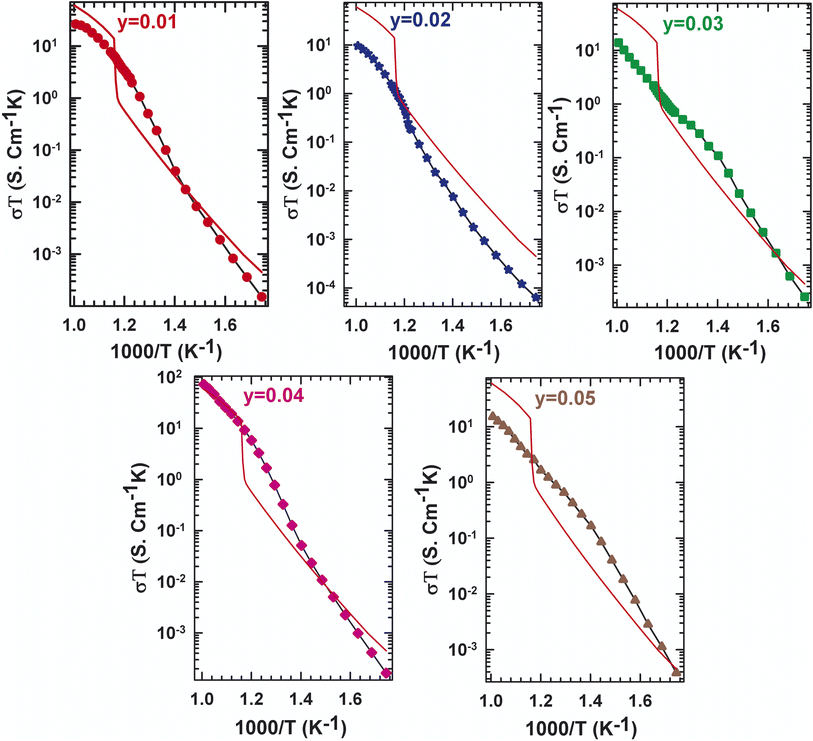 | ||
| Fig. 3 Evolution of the conductivity with temperature for La2Mo2−yPyO9−y/2 (y = 0, 0.01, 0.02, 0.03, 0.04, 0.05). | ||
The two stages' boundaries are thought to be marked by a phase transition in a specific temperature. In this case, some results from Fig. 3, in which the plot of the dependence of the electrical conductivity of La2Mo2−yPyO9−y/2 samples, and the curve of the undoped La2Mo2O9 was made for comparison, can be extracted. At 580 °C, the parent compound with y = 0 showed a phase transition, which can be seen by a sudden rise in conduction. Nevertheless, as the phosphorus level increases to y = 0.05, the phase transition that was previously described blurs and the conductivity jump disappears. The conductivity behavior of y = 0.01 and y = 0.02 does not exhibit an abrupt change at the transition temperature determined through DTA analysis and X-ray diffraction. This implies that pellets with y = 0.01 and y = 0.02 possess cubic symmetry throughout the thermal area examined. The stabilization of shape by pressure within a sintered pellet has already been underlined for numerous members of the LAMOX family: La1.8Eu0.2Mo2O9 (ref. 24) et La1.92Ca0.08Mo2O8.96.28 The experimentally observed decrease in the La2Mo2−yPyO9−y/2 series in oxide ion conductivity at a given temperature is very erratic depending on the y content. What's happened is most likely due to oxygen vacancy entrapment in such defect clusters.27,29
3.3. Spectroscopic properties
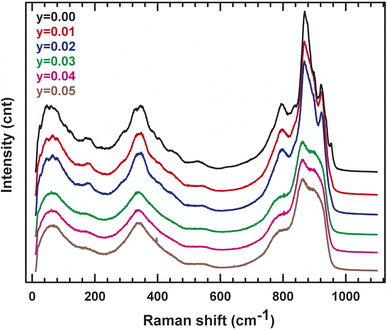
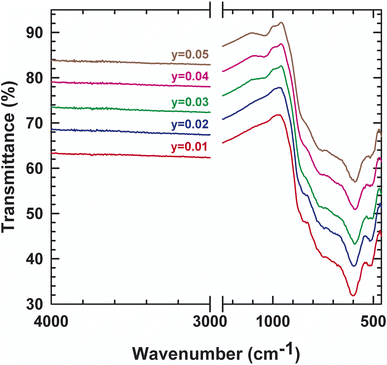
In order to track the dynamic properties of the system as a function of temperature and to better understand the transition mechanism, the Raman spectrometry study of LAMOX compounds was undertaken. Raman spectra of La2Mo2−yPyO9−y/2 (y = 0.01, 0.02, 0.03, 0.04, 0.05) were recorded in the frequency range 400–4000 cm−1, as observed in Fig. 4. The first eye-catching in the figure is the resulting change in the spectrum profile at 840 cm−1 when y ≥ 0.03 P-substituted. It's caused, therefore, by the transition from one phase α to another β, and confirms X-ray diffraction results. The characteristic vibration bands of PO43− are listed in Table 3: the asymmetric (ν3) and symmetric (ν1) elongation of the P–O bands are 1017 and 938 cm−1, respectively. Whereas, the asymmetric (ν4) and symmetric (ν2) deformation of the O–P–O bands are 567 and 420 cm−1, respectively. Peaks that are registered below 200 cm−1 tend to be lattice structure modes. The measurement results in Fig. 4 shows a weak shift to the lowest values of wavenumbers, this would match with the change that occurred in the whole structure (decrease in overall volume, phase changeover, etc.). Additionally, the internal vibrational modes of a tetrahedral MoO4 group of the specific original compound with y = 0 are explicated with details in literature18. Moreover, to supplement the XRD data, IR absorption was investigated. Some characteristic absorption bands are relative to PO4−3 can be found in the spectra presented in Fig. 5. The two bands detected at 542 and 615 cm−1 correspond to the asymmetric bending (ν4). While the asymmetric elongation is revealed by: the narrowband centered at 1015 cm−1 and the band observed at around 1050 cm−1. Those spectroscopic bands and peaks are important and didactic since a change in shape can disclose information about the structure and phase transition.| Wavenumber | Vibration mode | Vibration pattern |
|---|---|---|
| 1017 | ν3 | Asymmetric elongation of P–O |
| 938 | ν1 | Symmetric elongation of P–O |
| 567 | ν4 | Asymmetric deformation of O–P–O |
| 420 | ν2 | Symmetric deformation of O–P–O |
3.4. Thermal expansion
The thermal expansion behaviour of a solid electrolyte is also essential. The thermal expansion coefficient of La2Mo2O9 is 14.1–16.0 × 10⁻⁶ K−1 at low temperature (α-La2Mo2O9) and 16.4–22.5 × 10⁻⁶ K−1 at high temperature (β-La2Mo2O9).30,31 These values are much higher than those of YSZ and other oxide ion conductors (9–11 × 10−6 K−1).32 The relatively large thermal expansion is considered to be caused by the disordering of the oxygen lattice and minor oxygen loss during heating. It remains a hindrance for the compatibility of La2Mo2O9 with common electrodes. It has been observed that the substitution of La and Mo sites of La2Mo2O9 by various alkali and alkaline ions stabilizes the β phase at room temperature and increases the ionic conductivity and also reduces the thermal expansion coefficient.33–35 Fig. 6 depicts the thermal development of the various compositions over the temperature range of Tambiante – 900 °C. It ought to be noted to mention that the sample with y = 0.02 behaves with a jump in the temperature range between 540 °C in the thermal evolution of cell volume. This behavior is associated with a clear deviation from the Arrhenius behavior in the conductivity curve. This alteration may be the result of the cationic framework distortion/liberation without symmetry breaking (Arrhenius to Vogel–Tammann–Fulcher (VTF) processes) moving from static to the dynamic disordering of oxygen vacancies. For compositions y = 0.03, y = 0.04, and y = 0.05, the volume increases linearly with the temperature up to about 400 °C, a temperature Tonset above which a change of speed is observed. The thermal changes in volume presented in Fig. 6 represent the LAMOX family's compound forms. In addition, the suppression of phase transition was confirmed in these three compositions and it supports our earlier DTA results.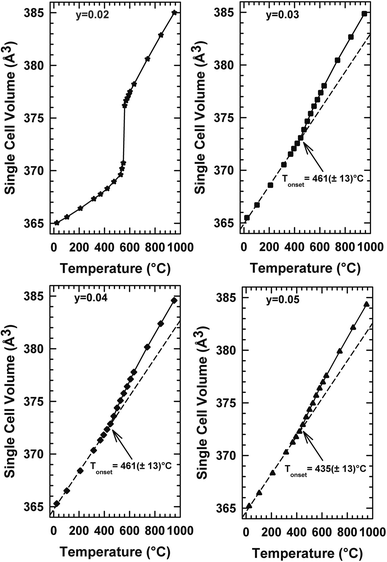 | ||
| Fig. 6 Temperature dependencies of the single cell volume of La2Mo2−yPyO9−y/2 raw powder samples determined from temperature-controlled X-ray diffraction data. | ||
4. Conclusion
A new examination of the solid solution La2Mo2−yPyO9−y/2 (0.01 ≤ y ≤ 0.05) was conducted to gain an improved grasp of the impact of pentavalent phosphorus on the crystal structure, thermal stability, electrical, and spectroscopic properties. Rietveld refinements of the XRD patterns demonstrate that the partial substitution of P at the Mo-site display the presence of three phases. The monoclinic system is adopted by the concentration less than or equal to 0.02. Whereas, a quasi-cubic phase has been observed at the content of 0.03. And, the cubic phase starts to appear from the y = 0.04 content of the phosphor. The stabilization of the cubic β-form is confirmed by the thermal expansion in which the sudden jump pronounced at y = 0.02, vanishes in the higher proportions. Thermal analysis reveals the disappearance of the phase transition, detected at 560 °C in La2Mo2O9, from y = 0.03 to y = 0.05. Moreover, electrical conductivity measurements prove that the P doping could suppress the order-disorder transition exhibited by pure La2Mo2O9, at room temperature from y > 0.02. An erratic decrease in conductivity as P content increases may be due to the fact of the oxygen vacancy. Infrared and Raman spectroscopies were commonly employed in the vibrational investigation. They point to the existence of the distinctive lines of molybdate ions and offer experimental proof of the function of phosphate ions.Author contributions
Noureddine Mhadhbi: formal analysis, writing – original draft, data curation; Wiem Jabeur: writing, investigation, validation; Ahlem Guesmi: review & editing, visualization; Ammar Houas: methodology, resources; Naoufel Ben Hamadi: project administration; Houcine Naïli: methodology, validation, supervision.Conflicts of interest
The authors declare no competing financial interest.Acknowledgements
This work was supported and funded by the Deanship of Scientific Research at Imam Mohammad Ibn Saud Islamic University (IMSIU) (grant number IMSIU-RP23011).References
- D. J. L. Brett, A. Atkinson, N. P. Brandon and S. J. Skinner, Intermediate temperature solid oxide fuel cells, Chem. Soc. Rev., 2008, 37, 1568–1578, 10.1039/B612060C.
- E. D. Wachsman and K. T. Lee, Lowering the temperature of solid oxide fuel cells, Science, 2011, 334, 935–939, DOI:10.1126/science.1204090.
- N. Q. Minh and T. Takahashi, Science and Technology of Ceramic Fuel Cells, Elsevier Science, Amsterdam, Netherlands, 1995, pp. 1–15 Search PubMed.
- P. Lacorre, F. Goutenoire, O. Bohnke, R. Retoux and Y. Lallgant, Designing fast oxide-ion conductors based on La2Mo2O9, Nature, 2000, 404, 856–858, DOI:10.1038/35009069.
- F. Goutenoire, O. Isnard, R. Retoux and P. Lacorre, Crystal structure of La2Mo2O9, a new fast oxide-ion conductor, Chem. Mater., 2000, 12, 2575–2580, DOI:10.1021/CM991199L/ASSET/IMAGES/LARGE/CM991199LF00008.JPEG.
- J. C. Lo, D. S. Tsai, Y. C. Chen, M. V. Le, W. H. Chung and F. J. Liu, La2Mo2O9-based electrolyte: ion conductivity and anode-supported cell under single chamber conditions, J. Am. Ceram. Soc., 2011, 94, 806–811, DOI:10.1111/J.1551-2916.2010.04168.X.
- L. Malavasi, H. J. Kim, S. J. L. Billinge, T. Proffen, C. Tealdi and G. Flor, Nature of the monoclinic to cubic phase transition in the fast oxygen ion conductor La2Mo2O9 (LAMOX), J. Am. Chem. Soc., 2007, 129, 6903–6907, DOI:10.1021/JA071281E/ASSET/IMAGES/LARGE/JA071281EF00004.JPEG.
- V. Voronkova, E. Kharitonova and A. Krasilnikova, Phase transitions and electrical conductivity of Bi-doped La2Mo2O9 oxide ion conductors, Phys. Status Solidi., 2009, 206, 2564–2568, DOI:10.1002/PSSA.200925184.
- I. R. Evans, J. A. K. Howard and J. S. O. Evans, The crystal structure of α-La2 Mo2O9 and the structural origin of the oxide ion migration pathway, Chem. Mater., 2005, 17(16), 4074–4077, DOI:10.1021/cm050049%2B.
- S. Georges, F. Goutenoire, O. Bohnke, M. C. Steil, S. J. Skinner, H.-D. Wiemhöfer and P. Lacorre, The LAMOX family of fast oxide-ion conductors: overview and recent results, J. New Mater. Electrochem. Syst., 2004, 7, 51–57 CAS , https://www.academia.edu/download/42653329/TheLAMOXFamilyofFastOxideIonConductors20160213-4521-11e6n6i.pdf.
- S. Georges, F. Goutenoire, F. Altorfer, D. Sheptyakov, F. Fauth, E. Suard and P. Lacorre, Thermal, structural and transport properties of the fast oxide-ion conductors La2−xRxMo2O9 (R = Nd, Gd, Y), Solid State Ionics, 2003, 161, 231–241, DOI:10.1016/S0167-2738(03)00279-0.
- Q. F. Fang, X. P. Wang, G. G. Zhang and Z. G. Yi, Damping mechanism in the novel La2Mo2O9 based oxide ion conductors, J. Alloys Compd., 2003, 355, 177–182, DOI:10.1016/S0925-8388(03)00278-0.
- G. Corbel, E. Chevereau, S. Kodjikian and P. Lacorre, Topological metastability and oxide ionic conduction in La2−xEuxMo2O9, Inorg. Chem., 2007, 46, 6395–6404, DOI:10.1021/IC700876D/SUPPL_FILE/IC700876D-FILE015.PDF.
- F. Goutenoire, O. Isnard, E. Suard, O. Bohnke, Y. Laligant, R. Retoux and P. Lacorre, Structural and transport characteristics of the LAMOX family of fast oxide-ion conductors, based on lanthanum molybdenum oxide La2Mo2O9Basis of a presentation given at materials discussion No. 3, 26–29 September, 2000, University of Cambridge, UK, J. Mater. Chem., 2001, 11, 119–124, 10.1039/B002962I.
- R. Subasri, D. Matusch, H. Näfe and F. Aldinger, Synthesis and characterization of (La1−xMx)2Mo2O9−δ; M=Ca2+, Sr2+ or Ba2+, J. Eur. Ceram. Soc., 2004, 24, 129–137, DOI:10.1016/S0955-2219(03)00123-7.
- I. Evans, J. Howard and J. Evans, The crystal structure of α-La2Mo2O9 and the structural origin of the oxide ion migration pathway, Chem. Mater., 2005, 17(16), 4074–4077, DOI:10.1021/cm050049%2B.
- D. Marrero-López, J. Canales-Vázquez, J. C. Ruiz-Morales, J. T. S. Irvine and P. Núñez, Electrical conductivity and redox stability of La2Mo2−xWxO9 materials, Electrochim. Acta, 2005, 50, 4385–4395, DOI:10.1016/J.ELECTACTA.2005.02.002.
- W. Jabeur, N. Mhadhbi, N. Ben Hamadi, A. Guesmi, T. Soltani and H. Naïli, Effect of humidified atmosphere on the physicochemical properties of S-doped La2Mo2O9 oxide-ion conductors, J. Mater. Sci. Mater. Electron., 2023, 34, 1–13, DOI:10.1007/S10854-022-09461-6/FIGURES/10.
- R. D. Bayliss, S. N. Cook, S. Kotsantonis, R. J. Chater and J. A. Kilner, Oxygen ion diffusion and surface exchange properties of the α- and δ-phases of Bi2O3, Adv. Energy Mater., 2014, 4, 1301575, DOI:10.1002/AENM.201301575.
- J. A. Kilner and M. Burriel, Materials for intermediate-temperature solid-oxide fuel cells, Annu. Rev. Mater. Res., 2014, 44, 365–393, DOI:10.1146/ANNUREV-MATSCI-070813-113426.
- L. Malavasi, C. A. J. Fisher and M. S. Islam, Oxide-ion and proton conducting electrolyte materials for clean energy applications: structural and mechanistic features, Chem. Soc. Rev., 2010, 39, 4370–4387, 10.1039/B915141A.
- A. Tarancón, Strategies for lowering solid oxide fuel cells operating temperature, Energies, 2009, 2, 1130–1150, DOI:10.3390/EN20401130.
- M. Guzik, M. Bieza, E. Tomaszewicz, Y. Guyot, E. Zych and G. Boulon, Nd3+ dopant influence on the structural and spectroscopic properties of microcrystalline La2Mo2O9 molybdate, Opt. Mater., 2015, 41, 21–31, DOI:10.1016/J.OPTMAT.2014.11.013.
- T. Matsumoto, K. Sunada, T. Nagai, T. Isobe, S. Matsushita, H. Ishiguro and A. Nakajima, Preparation of hydrophobic La2Mo2O9 ceramics with antibacterial and antiviral properties, J. Hazard. Mater., 2019, 378, 120610, DOI:10.1016/J.JHAZMAT.2019.05.003.
- B. Pahari, N. Mhadhbi, G. Corbel, P. Lacorre and J. Dittmer, Analysis of the local structure of phosphorus-substituted LAMOX oxide ion conductors, Dalton Trans., 2012, 41, 5696–5703, 10.1039/c2dt12389d.
- W. T. Pennington, IUCr, DIAMOND – visual crystal structure information system, J. Appl. Crystallogr., 1999, 32, 1028–1029, DOI:10.1107/S0021889899011486.
- G. Corbel, P. Durand and P. Lacorre, Comprehensive survey of Nd3+ substitution In La2Mo2O9 oxide-ion conductor, J. Solid State Chem., 2009, 182, 1009–1016, DOI:10.1016/J.JSSC.2009.01.016.
- A. Selmi, G. Corbel and P. Lacorre, Evidence of metastability and demixion/recombination process in fast oxide-ion conductor La1.92Ca0.08Mo2O8.96, Solid State Ionics, 2006, 177, 3051–3055, DOI:10.1016/J.SSI.2006.07.050.
- S. Basu, P. S. Devi and H. S. Maiti, Nb-Doped La2Mo2O9: a new material with high ionic conductivity, J. Electrochem. Soc., 2005, 152, A2143, DOI:10.1149/1.2047507.
- T. Xia, J. Y. Li, X. Luo, Q. Li, J. Meng and X. Q. Cao, Electrical properties and dilatometric measurements of La2Mo2O9 under low oxygen partial pressure, Chin. J. Chem., 2005, 23(6), 703–708, DOI:10.1002/cjoc.200590703.
- I. P. Marozau, A. L. Shaula, V. V. Kharton, N. P. Vyshatko, A. P. Viskup, J. R. Frade and F. M. B. Marques, Transport properties and thermal expansion of La2Mo2O9-based solid electrolytes, Mater. Res. Bull., 2005, 40, 361–371, DOI:10.1016/j.materresbull.2004.10.003.
- V. V. Kharton, F. M. B. Marques and A. Atkinson, Transport properties and thermal expansion of La2Mo2O9-based solid electrolytes, Solid State Ionics, 2004, 174, 135–149, DOI:10.1016/j.ssi.2004.06.015.
- D. M. Zhang, Z. Zhuang, Y. X. Gao, X. P. Wang and Q. F. Fang, Electrical properties and microstructure of nanocrystalline La2−xAxMo2O9−δ (A = Ca, Sr, Ba, K) films, Solid State Ionics, 2010, 181, 1510–1515, DOI:10.1016/j.ssi.2010.08.020.
- T. Paul and A. Ghosh, Conduction and relaxation mechanisms in bismuth doped La2Mo2O9 ionic conductors, J. Appl. Phys., 2013, 114, 164101, DOI:10.1063/1.4826077.
- P. Pinet, J. Fouletier and S. Georges, Conductivity of reduced La2Mo2O9 based oxides: the effect of tungsten substitution, J. Appl. Phys., 2007, 42, 935–942, DOI:10.1016/j.materresbull.2006.08.012.
| This journal is © The Royal Society of Chemistry 2023 |

