 Open Access Article
Creative Commons Attribution 3.0 Unported Licence
KOH-modified bamboo charcoal loaded with α-FeOOH for efficient adsorption of copper and fluoride ions from aqueous solution†
Wei Yang *a,
Lei Zhangb,
Meng Lic,
Ting Zhanga,
Yue Liua and
Juan Liua
aSchool of Environmental Science and Engineering, Hubei Polytechnic University, Huangshi 435003, Hubei, China. E-mail: yw198909@163.com
bMWR Standard & Quality Control Research Institute, Hangzhou 310024, Zhejiang, China
cSchool of Civil Engineering and Architecture, Wuhan University of Technology, Wuhan 430070, Hubei, China
First published on 16th October 2023
Abstract
In this work, bamboo charcoal (BC) is prepared by pyrolysis of bamboo. Then, KOH modification and surface deposition of Goethite (α-FeOOH) are performed to obtain a new KOH-modified BC loaded with α-FeOOH (FKBC) adsorbent for copper (Cu2+) and fluoride (F−) ion adsorption from aqueous solution. Surface morphology and physiochemical properties of the prepared adsorbent are characterized by scanning electron microscopy-energy dispersive spectrometer, X-ray diffraction, and N2 adsorption–desorption. The effect of pH, contact time, adsorbent dosage, and initial concentration on Cu2+ and F− adsorption is also investigated. In addition, adsorption kinetics and isotherms are fitted to pseudo-second-order kinetics and Langmuir model, respectively. Thermodynamic parameters suggest that the adsorption process is spontaneous and endothermic. The adsorption mechanism is further characterized by Fourier transform infrared spectroscopy and X-ray photoelectron spectroscopy. The Cu2+ absorption mainly occurs through ion exchange, coordination reactions, and surface precipitation, while the F− adsorption mainly occurs via ion exchange and hydrogen bonding. The selective adsorption experiments reveal that FKBC has good selectivity for Cu2+ and F−. The adsorption–desorption experimental results indicate that FKBC can be reused for Cu2+ and F− adsorption after regeneration. Results indicate that FKBC can be a promising adsorbent for Cu2+ and F− removal from aqueous solutions.
1. Introduction
With the development of the global electronic information industry, the demand for printed circuit boards (PCBs) and semiconductor chips has rapidly increased. A large amount of wastewater containing copper (Cu2+) and fluoride (F−) ions has been generated during pickling of copper-clad substrates on PCBs and the etching and cleaning process of semiconductor chip surfaces, respectively.1,2 Discharging Cu2+ and F− into water and soil seriously impacts the ecological environment system and human body health through bioaccumulation and the food chain.3,4 Therefore, finding an effective treatment method to remove Cu2+ and F− from wastewater is necessary.Currently, the main methods for Cu2+ removal include adsorption,5,6 ion exchange,7 coagulation,8 chemical precipitation,9 membrane capacitance deionization,10 and reverse osmosis.11 Similarly, adsorption,12,13 ion exchange, electrodialysis, and reverse osmosis14 have also been used for F−-removal from wastewater. Among these, adsorption is the most effective and popular method due to the advantages of low treatment cost, flexible treatment process, and recyclable characteristics, which are suitable for treating various wastewater concentrations.15 Compared with adsorption, other treatment methods have shortcomings, such as high treatment costs, generation of liquid sludge, and secondary pollution.16
Adsorption cost is an important consideration for using adsorption technology to remove harmful substances from wastewater, and the latest research trend mainly focuses on low-cost biochar adsorbents.17,18 Carbon-rich biochar adsorbents from different sources, including biological sludge,19 wood chips,20 plant residues,21 and agricultural waste,22,23 bamboo24–26 generally exhibit large porosity, specific surface area, and a variety of functional groups of biochar surface. Compared with other raw materials for preparing biochar, bamboo is a rich renewable biomass with fast growth, widespread planting, and low cost; thus, it is a perfect raw material for biochar production.27
Although biochar has a certain adsorption effect on harmful substances, further biochar modification is needed to compensate for the insufficient adsorption capacity.28 Some researchers have modified biochar through chemical methods to change its microporous structure, functional groups, specific surface area, and adsorption binding sites. Wang et al.29 synthesized alkali-modified biochar from bamboo impregnation with KOH via pyrolysis and used it for Cu2+ removal with higher adsorption capacity than the original bamboo charcoal. Thakur et al.30 used pine biomass mixed with KOH by high-temperature pyrolysis to synthesize alkali-modified pine biochar, achieving better adsorption for F−. Depositing metal compounds on biochar surfaces can increase the binding sites and enhance adsorption capacity.31 Liang et al.32 reported Cu2+ adsorption by loading Ca–Fe layered double hydroxide on corn straw biochar surface. The adsorption capacity for Cu2+ was increased twice compared to the original corn straw biochar. Pillai et al.33 prepared a rice husk biochar loaded with iron oxyhydroxide, demonstrating an excellent F-adsorption capacity.
In particular, metal hydroxide minerals have been extensively reported as good adsorbents.34 Goethite (α-FeOOH) is widely present in nature and can be easily synthesized in the laboratory. It has been increasingly used as an adsorption material due to its strong affinity, special structure, number of binding sites, environmental friendliness, and low cost.35,36 Literature has confirmed that α-FeOOH can effectively adsorb Cu2+ and has strong affinity and adsorption ability for F− due to its reactive functional groups.37,38 However, α-FeOOH is prone to aggregation, limiting its practical applications.39,40 Therefore, depositing α-FeOOH onto biochar to improve its dispersion benefits its widespread utilization in environmental applications.
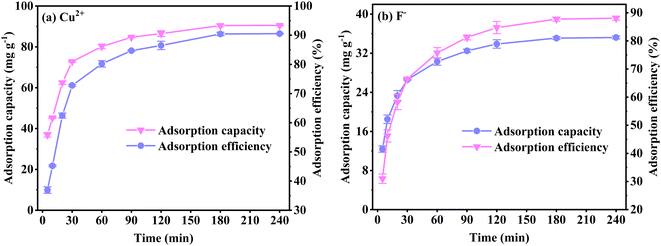
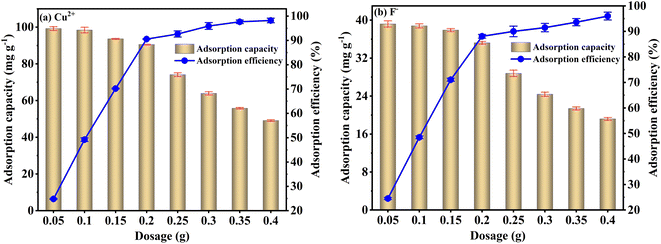
Based on this information, we anticipate alkali modification of bamboo charcoal (BC) and α-FeOOH surface deposition can produce a potential adsorption material for Cu2+ and F− removal. Therefore, this study prepares a novel KOH-modified BC loaded with α-FeOOH (FKBC). The physicochemical properties of FKBC have been investigated. The effect of pH, contact time, adsorbent dosage, initial concentration on Cu2+ and F− adsorption, adsorption kinetics, isotherms, thermodynamics, and adsorption mechanism are studied. Finally, the adsorption selectivity and reusability of FKBC for Cu2+ and F− are also evaluated. Nevertheless, no investigation has been previously reported on FKBC for simultaneous Cu2+ and F− removal.
2. Materials and methods
2.1 Materials and reagents
The bamboo used in the experiment was collected from Hubei Polytechnic University, Hubei Province, China. KOH, HNO3, Cu(NO3)2, KF, Fe(NO3)3, NaCl, K2SO4, KNO3, and NH4Cl were purchased from China National Pharmaceutical Group Chemical Reagents Co., Ltd. NiSO4 and CdSO4 were obtained from Aladdin Reagent Co., Ltd. All chemical reagents used in these experiments were of analytical grade and were used without further pretreatment. Cu2+ and F− working solutions were prepared by dissolving Cu(NO3)2 and KF in deionized water, respectively. pH of Cu2+ and F− working solutions was adjusted by KOH (1 mol L−1) and HNO3 (1 mol L−1).2.2 Adsorbent preparation
BC adsorbent was prepared according to previous work.29,41 First, 100 g fresh bamboo was cut into small pieces, washed three times with deionized water, and dried in an oven at 353 K for 6 h. The BC was prepared in a resistance tube by calcinating the bamboo pieces at 923 K for 1.5 h under an N2 atmosphere of 100 mL min−1 flow rate. The obtained BC was then ground and sieved at 100 microns.The preparation procedure of FKBC was referred to in the previous paper.31,40 20 g BC powder was added to a 200 mL KOH solution (2 mol L−1) and impregnated at 333 K for 12 h in a water bath shaker at 120 rpm. Then, 100 mL Fe(NO3)3 solution (1 mol L−1) was slowly added to the BC-KOH mixture to form a precipitate, aged in an oscillating water bath at 333 K for 48 h before natural precipitation. The precipitate was washed with deionized water until the pH was neutral. The product was dried at 333 K for 6 h, ground, and sieved at 100 microns.
2.3 Characterization of FKBC
The surface and elemental composition of FKBC were analyzed by scanning electron microscopy (SEM, SU8220, Japan) combined with an energy dispersive spectrometer (EDS, K-Alpha, UK), respectively. The mineral composition was determined by X-ray diffraction analysis (XRD, D/max-3B, Japan). The adsorbent's specific surface area and pore volume were obtained by the N2 adsorption–desorption method at 77 K (Micromeritics TriStar II 3020, USA). The surface potential of the adsorbent was measured by the pH drift method. Fourier transform infrared spectroscopy (FTIR) was used to characterize the surface functionalities of the adsorbent before and after adsorption (Nicolet 6700, USA). X-ray photoelectron spectroscopy (XPS) was used to study the surface chemical state of the adsorbent before and after adsorption (ESCALAB250Xi, USA).2.4 Batch adsorption experiments
Batch adsorption experiments were conducted in a 200 mL conical flask at a shaking speed of 120 rpm. At the end of each experiment, a 2 mL solution sample was filtered with a 0.22 μm membrane. The residual Cu2+ and F− concentrations in the filtrate were determined by atomic absorption spectroscopy (AAS) and ion chromatography (IC), respectively.Detailed experimental conditions for batch adsorption, such as pH, contact time, adsorbent dosage, Cu2+, F− initial concentration, kinetics, isotherms, and thermodynamics, are provided in ESI (Table S1†). Parameter details and coexisting ions are discussed in selective adsorption experiments (Table S2†). The adsorption efficiency (R%), adsorption capacity (Qt, mg g−1) at time t, and equilibrium adsorption capacity (Qe, mg g−1) of FKBC for Cu2+ or F− was calculated by the following equations:42
 | (1) |
 | (2) |
 | (3) |
2.5 Recycling experiments
Several adsorption–desorption cycle experiments were conducted under 120 rpm to examine the reusability of the adsorbent. Detailed experimental conditions are shown in Table S3.† After adsorption, the Cu2+ or F−-loaded FKBC was filtered with 0.22 μm membrane and regenerated with 100 mL HNO3 (1 mol L−1) and KOH (1 mol L−1) for 1 h, respectively. Then, the desorbed adsorbent was washed with deionized water several times and dried for the next adsorption experiments.2.6 Statistics analysis
In this study, all adsorption experiments are conducted in triplicate to ensure consistency. The experiment results are calculated as mean ± standard error. Data are analyzed by one-way analysis of variance (ANOVA) and Student–Newman–Keuls (SNK) post hoc test comparisons using the IBM SPSS Statistics 21.0 software. The statistical significance is set at a level of p < 0.05. The kinetic, isotherm, and thermodynamic data fitting are performed using the Origin 2021 software.3. Results and discussion
3.1 Characterization
Fig. 1(a) and (b) show the SEM-EDS images of BC and FKBC. The BC surface is relatively smooth without an obvious fold structure. In contrast, the FKBC surface is rough, attaching much sediment with micropores. EDS analysis reveals the absence of Fe in BC; however, the Fe content in FKBC is up to 9.8%, while the O content increases from 10.53% in BC to 19.66% in FKBC (Table 1). In addition, the EDS mapping results show that Fe and O elements are almost concentrated on the FKBC surface sediments (Fig. S1(a–c) and S2(a–c)†). These results preliminarily confirm the alkali modification on the biochar surface and α-FeOOH loading. SEM images in Fig. 1(c) and (d) depict that after reuse of FKBC for Cu2+ and F− adsorption, the surface is rough with a large amount of sediment, suggesting that the morphology of FKBC does not change after reuse. EDS element analysis also confirms the successful adsorption of Cu2+ and F−.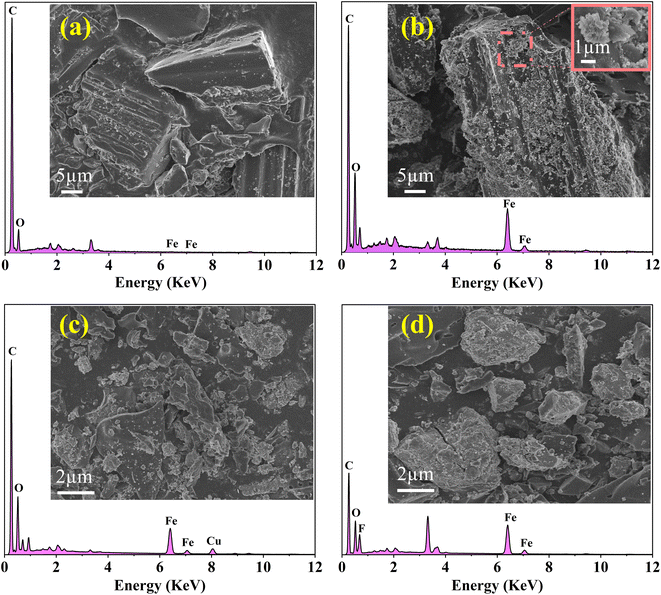 | ||
| Fig. 1 SEM-EDS images of the BC (a), FKBC before (b), and FKBC after (c) Cu2+ and (d) F− adsorption. | ||
| Samples | Surface atomic relative content (wt%) | SBET (m2 g−1) | Vtot (cc g−1) | Pore diameter (nm) | |||||
|---|---|---|---|---|---|---|---|---|---|
| C | O | Fe | Cu | F | Others | ||||
| a The others are Si, H, and K; SBET: specific surface area; Vtot: total pore volume. | |||||||||
| BC | 83.14 | 10.53 | — | — | — | 6.33 | 1.25 | 0.034 | 6.54 |
| FKBC | 67.53 | 19.66 | 9.80 | — | — | 3.01 | 19.79 | 0.126 | 3.54 |
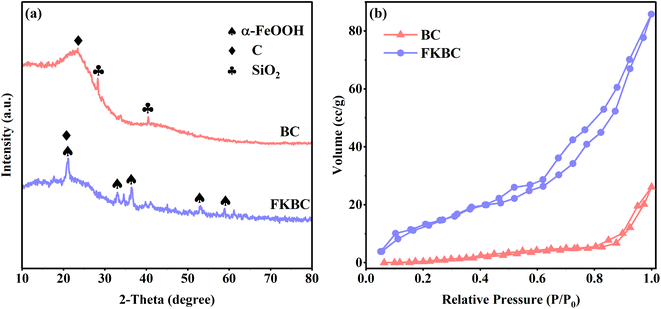
XRD patterns of BC (Fig. 2(a)) show that a broad and low-intensity peak appears at 2θ = 23°, attributed to aromatization and graphitization of carbonaceous organic matter.43 Peaks at 28.40° and 40.48° are assigned to (111) and (210) planes of SiO2 (PDF 76-0935). These SiO2 impurities are present in biochar pores and are unfavorable for active adsorption site exposure.44 The XRD spectrum of FKBC shows that the SiO2 characteristic peaks disappear, suggesting that the biochar surface impurities are eliminated after alkali modification, promoting the surface pores formation.45 The characteristic peaks at 21.24°, 33.24°, 36.66°, 53.24°, and 59.00° belong to (110), (130), (111), (221), and (151) of α-FeOOH (PDF81-0464), suggesting that α-FeOOH is successfully loaded on biochar surface.38
Fig. 2(b) shows the N2 adsorption–desorption isotherms of BC and FKBC. The N2 adsorption–desorption curve of FKBC indicates obvious hysteresis loops at high pressure and features of the type-IV model, demonstrating the formation of mesoporous structures.46 Table 1 shows that the FKBC BET surface area is 19.79 m2 g−1, and the total pore volume is 0.126 cc g−1, 14.8 times and 2.7 times higher than BC, respectively. The FKBC pore diameter is 3.54 nm, smaller than that of BC. Therefore, FKBC has a larger specific surface area, pore volume, and smaller pore size, offering more adsorption sites and playing a vital role in Cu2+ and F− adsorption from the aqueous phase.
3.2 Effect of the parameters on Cu2+ and F− adsorption
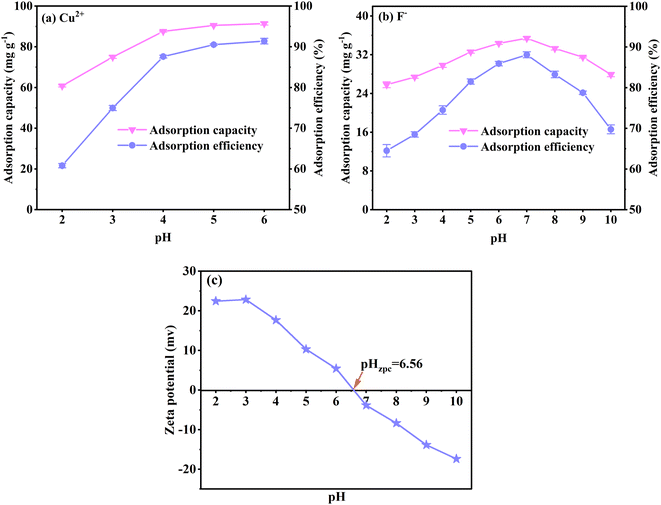
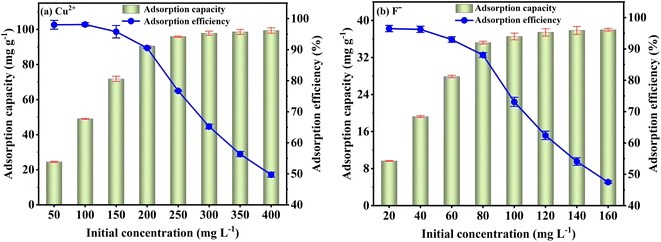
Fig. 3(a) shows that the Cu2+ adsorption capacity and efficiency rapidly increase between pH 2 to 5 and slightly increase from pH 5 to 6. For F− adsorption, the capacity and efficiency improve significantly between pH 2 to 7 and decrease from pH 7 to 10 (Fig. 3(b)). The results illustrate that the solution's excessive or low pH influences the Cu2+ and F− adsorption. To explain this phenomenon, the surface potential of FKBC is measured. Fig. 3(c) shows that the zero-point charge (pHzpc) of FKBC is 6.56. The FKBC surface is positively charged when the pH of the solution is less than pHzpc, resulting in electrostatic repulsion, hindering the Cu2+ diffusion to the adsorbent surface.49 In addition, H+ in the solution combines with F− to form HF, limiting F− adsorption by FKBC. The surface is negatively charged when the pH > pHzpc. With the OH− on the FKBC surface increasing, the competitive adsorption between F− and OH− strengthens. Also, the electrostatic repulsion for F− increases, which is not conducive to F-adsorption. However, the precipitated flocs appear in Cu2+ solution at pH > 5, indicating that the enhanced removal is mainly attributed to precipitation, distinguished from adsorption and avoided.6 Therefore, for subsequent adsorption experiments, the pH of the Cu2+ and F− working solution is set at 5 and 7, respectively.
3.3 Adsorption kinetics
The adsorption kinetics are analyzed to investigate the Cu2+ and F− adsorption rate and the mechanism by FKBC. This study simulated the experimental adsorption data related to Cu2+ and F− using pseudo-first-order, pseudo-second-order, and intraparticle-diffusion models.Pseudo-first-order (eqn (4)), pseudo-second-order (eqn (5)), and intraparticle-diffusion models (eqn (6)) are shown below.
| Qt = Qe(1 − e−k1t) | (4) |
 | (5) |
| Qt = kipt0.5 + C | (6) |
Fig. 7(a) and (c) show the pseudo-first-order and pseudo-second-order kinetic model curves of Cu2+ and F− adsorption at 288 K, 298 K, and 308 K, respectively. The adsorption rates for Cu2+ and F− increase at higher temperatures, suggesting that temperature reinforces Cu2+ and F− adsorption by FKBC. In addition, the statistical parameters of kinetic models are demonstrated in Table 2. Compared to the pseudo-first-order kinetics model, the pseudo-second-order kinetics model better fits Cu2+ (R2 = 0.989–0.997) and F− (R2 = 0.988–0.998) adsorption rate at each temperature. The Cu2+ and F− adsorption capacity calculated (Qe,cal) by pseudo-second-order kinetics is closer to the experimental data (Qe,exp), indicating that the adsorption behavior of Cu2+ and F− is more suitable to Pseudo-second-order kinetics and mainly controlled by chemisorption.4,38
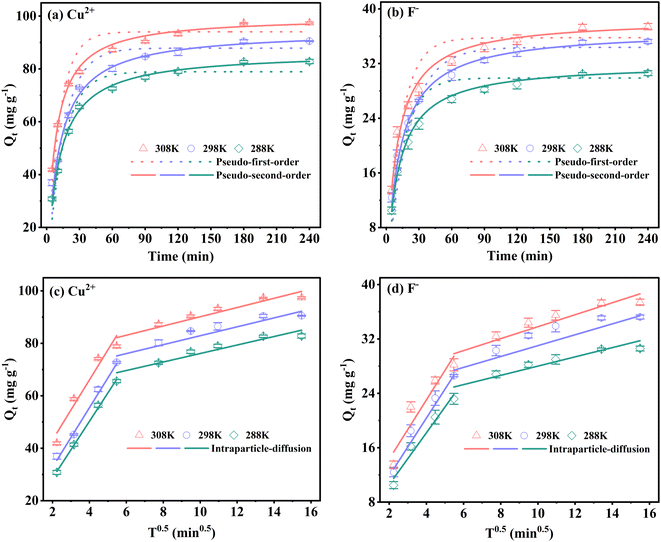 | ||
| Fig. 7 Pseudo-first-order and pseudo-second-order kinetics of Cu2+ (a) and F− (b); intraparticle-diffusion model of Cu2+ (c) and F− (d). | ||
| Parameters | Cu2+ | F− | ||||
|---|---|---|---|---|---|---|
| 288 K | 298 K | 308 K | 288 K | 298 K | 308 K | |
| Qe,exp (mg g−1) | 82.8 | 90.5 | 97.4 | 30.6 | 35.2 | 37.4 |
![[thin space (1/6-em)]](https://www.rsc.org/images/entities/char_2009.gif) |
||||||
| Pseudo-first-order | ||||||
| Qe,cal1 (mg g−1) | 78.1 | 85.7 | 91.3 | 28.7 | 32.8 | 34.7 |
| k1 (min−1) | 0.072 | 0.075 | 0.099 | 0.070 | 0.072 | 0.082 |
| R12 | 0.954 | 0.939 | 0.930 | 0.949 | 0.940 | 0.918 |
![[thin space (1/6-em)]](https://www.rsc.org/images/entities/char_2009.gif) |
||||||
| Pseudo-second-order | ||||||
| Qe,cal2 (mg g−1) | 85.5 | 93.4 | 98.5 | 31.5 | 35.9 | 37.8 |
| k2 × 103 (g mg−1 min−1) | 1.09 | 1.16 | 1.48 | 2.14 | 2.78 | 3.06 |
| R22 | 0.996 | 0.989 | 0.997 | 0.998 | 0.996 | 0.988 |
![[thin space (1/6-em)]](https://www.rsc.org/images/entities/char_2009.gif) |
||||||
| Intraparticle-diffusion | ||||||
| k3I (mg g−1 min−0.5) | 10.83 | 11.38 | 11.42 | 3.82 | 4.27 | 4.30 |
| C1 (mg g−1) | 7.00 | 10.69 | 19.63 | 2.95 | 3.81 | 5.92 |
| R3I2 | 0.998 | 0.993 | 0.949 | 0.967 | 0.975 | 0.900 |
| K3II (mg g−1 min−0.5) | 1.64 | 1.70 | 1.75 | 0.68 | 0.80 | 0.85 |
| C2 (mg g−1) | 59.16 | 66.24 | 72.21 | 20.84 | 23.62 | 25.17 |
| R3II2 | 0.910 | 0.904 | 0.912 | 0.879 | 0.898 | 0.882 |
Fig. 7(b) and (d) show the intraparticle-diffusion model for Cu2+ and F− adsorption on FKBC, respectively. Both curves display two linear portions at each temperature, indicating that the adsorption process is divided into two diffusion stages.51 The intraparticle-diffusion rate constant of the two stages is shown in Table 2. Cu2+ and F− may have first diffused on the FKBC surface at a high rate and then diffused into micropores at a lower rate.37 The linear curves do not traverse the origin, revealing that the adsorption rate is determined by intraparticle-dispersion and physical and chemical processes.52
3.4 Adsorption isotherms
To evaluate the adsorption capacity of Cu2+ and F− by FKBC, the experimental data are fitted using the Langmuir, Freundlich, and Temkin isotherm models. Langmuir isotherm model indicates that the adsorption process is monolayer chemisorption on a homogeneous surface.19,21 At the same time, the Freundlich isotherm model describes the multi-layer physisorption on heterogeneous surfaces.19 The Temkin isotherm model is appropriate for chemisorption and assumes that adsorption energy decreases linearly with the surface coverage.14Langmuir isotherm (eqn (7)), Freundlich isotherm (eqn (8)) and Temkin isotherm (eqn (9)) models are expressed as follows:
 | (7) |
| Qe = KFCe1/n | (8) |
Qe = B![[thin space (1/6-em)]](https://www.rsc.org/images/entities/char_2009.gif) ln ln![[thin space (1/6-em)]](https://www.rsc.org/images/entities/char_2009.gif) KT + B KT + B![[thin space (1/6-em)]](https://www.rsc.org/images/entities/char_2009.gif) ln ln![[thin space (1/6-em)]](https://www.rsc.org/images/entities/char_2009.gif) Ce Ce
| (9) |
Fig. 8(a) and (c) depict that the Langmuir isotherm model curves are better fitted than the Freundlich model at each temperature. Based on the isotherm parameters, the Langmuir isotherm model exhibits higher regression coefficients for Cu2+ and F− than those of the Freundlich model, respectively (Table 3). The above results describe that the Langmuir isotherm model describes the Cu2+ and F− adsorption behavior, illustrating that the monolayer adsorption of Cu2+ and F− mainly is on the homogeneous surface of FKBC, and adsorption is mostly chemisorption.53,54 At the same time, the separation factor RL (RL = 1/(1 + KL × C0)) demonstrates the applicability of the adsorption experiment.55 However, 0 < RL ≤ 1 and RL > 1 indicate that the adsorption is favorable and unfavorable, respectively.5 The RL values are all within the range of 0–1 at each temperature, indicating the favorable nature of the Cu2+ and F− adsorption using FKBC (Table 3).
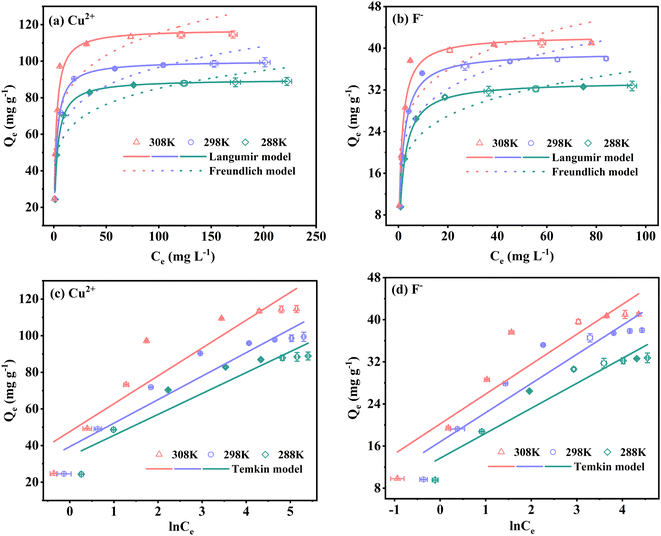 | ||
| Fig. 8 Langmuir and Freundlich isotherm models of Cu2+ (a) and F− (b); Temkin isotherm model of Cu2+ (c) and F− (d). | ||
| Parameters | Cu2+ | F− | ||||
|---|---|---|---|---|---|---|
| 288 K | 298 K | 308 K | 288 K | 298 K | 308 K | |
| Qe,exp (mg g−1) | 82.8 | 90.5 | 97.4 | 30.6 | 35.2 | 37.4 |
![[thin space (1/6-em)]](https://www.rsc.org/images/entities/char_2009.gif) |
||||||
| Langmuir isotherm | ||||||
| Qm,cal (mg g−1) | 90.1 | 100.2 | 117.4 | 33.6 | 39.2 | 42.4 |
| KL (L mg−1) | 0.37 | 0.43 | 0.50 | 0.49 | 0.59 | 0.80 |
| RL | 0.013 | 0.011 | 0.009 | 0.025 | 0.021 | 0.015 |
| R12 | 0.990 | 0.994 | 0.982 | 0.998 | 0.990 | 0.981 |
![[thin space (1/6-em)]](https://www.rsc.org/images/entities/char_2009.gif) |
||||||
| Freundlich isotherm | ||||||
| KF (mg g−1) (mg L−1)n | 41.27 | 46.15 | 54.50 | 15.89 | 18.89 | 21.68 |
| n (g mg−1 min−1) | 6.36 | 6.22 | 6.13 | 5.66 | 5.62 | 5.94 |
| R22 | 0.820 | 0.827 | 0.783 | 0.839 | 0.809 | 0.786 |
![[thin space (1/6-em)]](https://www.rsc.org/images/entities/char_2009.gif) |
||||||
| Temkin isotherm | ||||||
| B (J mol−1) | 11.43 | 12.87 | 15.23 | 4.75 | 5.55 | 5.71 |
| KT (g L−1) | 19.75 | 21.06 | 22.65 | 17.78 | 20.38 | 33.97 |
| R32 | 0.889 | 0.901 | 0.862 | 0.910 | 0.887 | 0.867 |
Fig. 8(b), (d), and Table 3 show the Temkin isotherm model fitting lines and related coefficients. The heat of the adsorption constant (B) of the Temkin model increases with increasing temperature, indicating the endothermic adsorption process.56 The investigated parameters also reveal that the maximum adsorption capacities (Qm) for Cu2+ and F− based on the Langmuir model increase by 30.4% and 26.2% when the temperature increases from 288 K to 308 K, respectively. These results suggest that increasing temperature is conducive to reaction progression in Cu2+ and F− adsorption by FKBC, consistent with the Temkin model's investigation.
Some previously reported adsorbents with Cu2+ and F− adsorption capabilities are compared with FKBC (Table 4). FKBC can effectively adsorb Cu2+ and F−, an advantage previously studied adsorbents do not possess.
| Adsorbent | ion | pH | T (K) | Qm (mg g−1) | Reference |
|---|---|---|---|---|---|
| Ferromanganese oxide–biochar | Cu2+ | 5 | 308 | 65.9 | 5 |
| BC-LDHs | Cu2+ | 5 | 298 | 85.47 | 53 |
| Salt-based biochar | Cu2+ | 5–6 | 308 | 187.76 | 57 |
| Modified bamboo charcoal | Cu2+ | 5 | 318 | 40.65 | 29 |
| FeOOH/TOCN powder | F− | 7 | 313 | 19 | 37 |
| Granular ferric hydroxide | F− | 6–7 | 298 | 7.0 | 3 |
| Ca-doped ferrihydrite | F− | 5.75 | 298 ± 2 | 53.21 | 33 |
| Ternary metal oxide | F− | 7 | 298 | 63.05 | 58 |
| FKBC | Cu2+ | 5 | 308 | 117.4 | This work |
| F− | 7 | 308 | 42.4 |
3.5 Adsorption thermodynamics
Thermodynamic parameters of the adsorption process involving changes in Gibbs free energy (ΔG0), enthalpy (ΔH0), and entropy (ΔS0) are calculated to examine the spontaneity and feasibility of Cu2+ and F− adsorption using the following equations:59
ΔG0 = −RT![[thin space (1/6-em)]](https://www.rsc.org/images/entities/char_2009.gif) ln ln![[thin space (1/6-em)]](https://www.rsc.org/images/entities/char_2009.gif) KC KC
| (10) |
 | (11) |
| KC = M × 55.5 × 1000 × KL | (12) |
The ΔH0 and ΔS0 values are calculated from the slope and intercept of straight lines (Fig. S3†), while ΔG0 values are obtained from eqn (10). The ΔG0, ΔH0, and ΔS0 values are listed in Table 5.
| Ion | Temperature (K) | Thermodynamic parameters | ||
|---|---|---|---|---|
| ΔG0 (kJ mol−1) | ΔS0 (J mol−1 K−1) | ΔH0 (kJ mol−1) | ||
| Cu2+ | 288 | −33.69 | 156.39 | 11.35 |
| 298 | −35.26 | |||
| 308 | −36.82 | |||
| F− | 288 | −31.44 | 172.52 | 18.24 |
| 298 | −33.17 | |||
| 308 | −34.89 | |||
ΔG0 values are negative at each temperature, suggesting that the Cu2+ and F− adsorption by FKBC are all spontaneous and follow the chemisorption process.4,37 In addition, the ΔG0 values are more negative with increasing temperature, demonstrating that a higher temperature is thermodynamically favorable to Cu2+ and F− adsorption.32,35
ΔS0 values are greater than zero, suggesting increased randomness at the solid/liquid interface for Cu2+ and F− adsorption.14,49 ΔH0 values also are positive, corroborating that the adsorption is endothermic, agreeing well with the adsorption above isotherm analysis.3,32
3.6 Adsorption mechanism
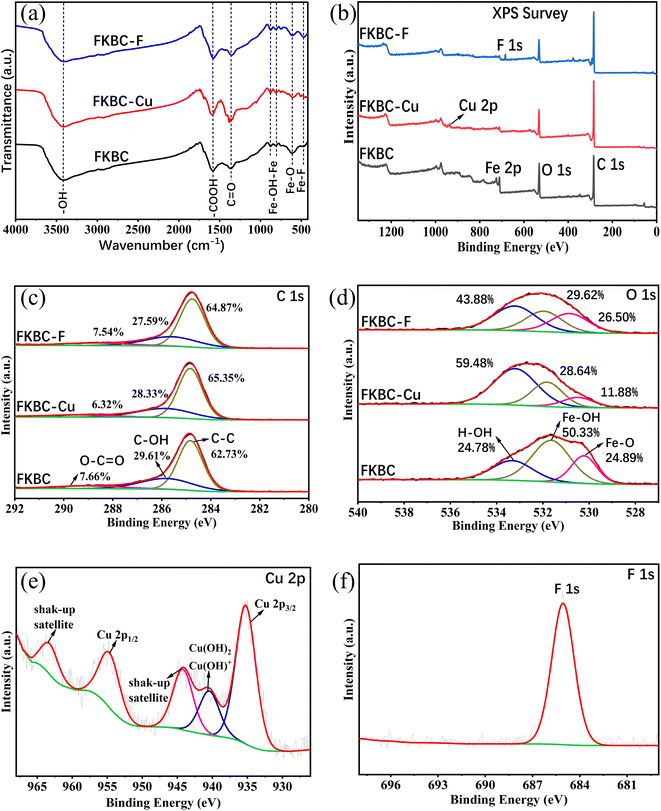
Functional group changes in FKBC before and after Cu2+ and F− adsorption are shown in the FTIR spectrum (Fig. 9(a)). The peak at 3414 cm−1 is the bending and stretching of –OH groups on FKBC.5 The peaks at 1580 cm−1 and 1364 cm−1 are respectively related to the tension of –COOH and symmetric stretching of the carboxyl group, and peaks at 877 cm−1 and 815 cm−1 are attributed to the extension and in-plane bending of surface hydroxyl groups on α-FeOOH.52 After Cu2+ and F− adsorption, these peaks underwent corresponding changes. During Cu2+ adsorption, the oxygen atoms in –OH and –COOH groups share their non-bonding electron pairs with Cu2+, thereby reacting to form surface complexes (such as COO–Cu, Fe–O–Cu, C–O–Cu) and substituting H in these groups.5,50 During F− adsorption, the –OH is replaced by F−, or hydrogen bonding occurs between F−.60 In addition, the peak at 613 cm−1 is attributed to Fe–O bending vibrations.52 After Cu2+ adsorption, the peak weakens, preliminarily indicating that Cu may replace some Fe in α-FeOOH. Moreover, after the F− adsorption, the peak at 613 cm−1 changes slightly, and a new absorption peak appears at 467 cm−1, possibly due to Fe–F formation. Overall, preliminary FTIR analysis shows that the oxygen-containing functional groups on the FKBC surface are mainly consumed during Cu2+ and F− adsorption, leading to the movement of characteristic O–H bands.5To further explore the adsorption mechanism of Cu2+ and F−, the high-resolution XPS spectra obtained are shown in Fig. 9(b)–(e). XPS full spectrum showed that after FKBC adsorption, Cu and F element signals are detected near 935.1 and 684.5 eV, respectively, confirming the successful Cu2+ and F− adsorption (Fig. 9(b)). This is consistent with the EDS element analysis results in Fig. 1(c) and (d).
Fig. 9(c) shows the core energy level spectrum of C1s, divided into three peaks at 288.9, 286.1, and 284.8 eV, generated by the O–C![[double bond, length as m-dash]](https://www.rsc.org/images/entities/char_e001.gif) O bond, C–OH bond, and C–C bond, respectively.57 After Cu2+ and F− adsorption, the C–OH bonds and O–C
O bond, C–OH bond, and C–C bond, respectively.57 After Cu2+ and F− adsorption, the C–OH bonds and O–C![[double bond, length as m-dash]](https://www.rsc.org/images/entities/char_e001.gif) O bonds relative content decreased; however, the reduction is insignificant. This indicates that the oxygen-containing functional groups connected to the C are not the main Cu2+ and F− adsorption participants.
O bonds relative content decreased; however, the reduction is insignificant. This indicates that the oxygen-containing functional groups connected to the C are not the main Cu2+ and F− adsorption participants.
The O1s spectrum in Fig. 9(d) is also divided into three peaks at 533.4 eV, 531.5 eV, and 530.3 eV, corresponding to OH2O (adsorbed water molecules), Oad (chemically adsorbed oxygen), and Olatt (lattice oxygen), generated by H–O–H, Fe–OH and Fe–O bonds, respectively.31,35 Before adsorption, the relative Fe–OH content is 50.33%, significantly higher than Fe–O (24.89%), confirming that FKBC contains abundant hydroxyl radicals due to the existence of α-FeOOH.38 After Cu2+ adsorption, the relative contents of Fe–OH and Fe–O decreased significantly, confirming that Cu2+ replaces the hydrogen in hydroxyl groups to form a complex structure with oxygen and exchanges some Fe in α-FeOOH and then forms the O–Cu bond. This conclusion is consistent with FTIR analysis and is confirmed by Cu2p spectroscopy. After F− adsorption, there is a significant decrease in Fe–OH, and the relative content of Fe–O remained unchanged, indicating that the hydroxyl groups in α-FeOOH are exchanged by F−, while Fe is not involved in the adsorption process.
The Cu2p spectrum shows that the binding energy exhibits typical Cu2p3/2 and Cu2p1/2 characteristic peaks at 935 and 955 eV and shake-up satellite peaks at 963.4 and 943.8 eV, suggesting that Cu2+ is adsorbed in a bivalent state and O–Cu bonds are formed (Fig. 9(e)).57 In addition, a peak near 940 eV may be related to Cu(OH)2 or Cu(OH)+, implying the existence of micro-precipitation on the adsorbent surface,61 confirming the influence of pH on Cu2+ adsorption. After the F− adsorption, the spectrum shows a typical F1s characteristic peak, and the binding energy is between 684–685 eV, indicating that the adsorbed F− mainly existed as inorganic fluoride (Fig. 9(f)). EDS mapping results after adsorption reveal that the Cu and F elements almost overlap with the sediment area located on FKBC, suggesting that the α-FeOOH on the FKBC surface mainly contributes to Cu2+ and F− adsorption (Fig. S1(d–g), S2(d–g)†).
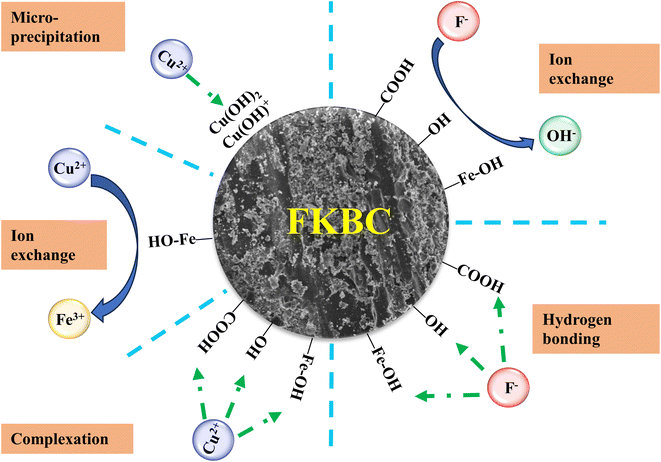
In summary, the Cu2+ adsorption mechanism mainly relies on ion exchange, complexation, and micro-precipitation, while F− mainly relies on ion exchange and hydrogen bonding (Fig. 10). However, other mechanisms cannot be ruled out, and further research is needed.
3.7 Selective adsorption
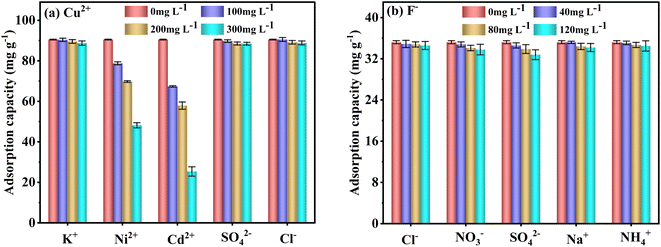
To evaluate the FKBC selective adsorption performance, the effect of coexisting ions at different concentrations on Cu2+ and F− adsorption capacity and efficiency is examined. The order of coexisting ions affecting Cu2+ adsorption is Cd2+ > Ni2+ > K+ ≈ SO42− ≈ Cl− (Fig. 11(a)). Additionally, the coexisting K+, SO42−, and Cl− ions have little effect on Cu2+ adsorption since the active adsorption sites on the FKBC surface form a stable complex with Cu2+; thus, selective adsorption is high for Cu2+. Also, Cd2+ has a greater impact on the Cu2+ selective adsorption than Ni2+, possibly due to its larger ionic radius (Cd2+ (0.095 nm) > Cu2+ (0.073 nm) > Ni2+ (0.069 nm)),62 exhibiting a competitive effect on Cu2+ adsorption process. However, comparing the adsorption capacities and efficiencies of Ni2+ and Cd2+ with that of Cu2+ (Table S4†), FKBC shows higher selectivity for Cu2+ at low Ni2+ and Cd2+ concentrations, attributed to the hydration. Since the hydration ion radius of Cu2+ (0.404 nm) is smaller than that of Cd2+ (0.426 nm) and Ni2+ (0.419 nm),62 thus, their contact is easy with the FKBC surface and enters the internal pores.Fig. 11(b) indicates that the coexisting Cl−, NO3−, SO42−, Na+, and NH4+ have little effect on F− adsorption. The adsorption capacities and efficiencies of coexisting ions are far below that of F− by FKBC (Table S5†), illustrating that the FKBC surface sites have selective F−-adsorption due to hydrogen bonds with F−.
3.8 Reusability assessment
Adsorption–desorption cycle experiment results are presented in Fig. 12. The adsorption capacities of F− slowly decrease with increasing cycle number and remain at 29.5 and 30.3 mg g−1 after five cycles with HNO3 and KOH desorption, respectively. In addition, there is no significant difference in F− adsorption capacities of FKBC regenerated by HNO3 and KOH in the same cycle number, suggesting the feasibility of using acid or alkali to desorb F−. However, the adsorption capacities of Cu2+ after desorption with HNO3 (90.2–78.5 mg g−1) are substantially higher after desorption with KOH (43.5–20.2 mg g−1). Based on the effect of pH, some adsorption sites on the adsorbent surface are inevitably occupied by precipitated flocs when using KOH to desorb Cu2+. Overall, the FKBC is a potentially promising adsorbent for Cu2+ and F− due to its high reusability, while using alkali for Cu2+ desorption should be avoided.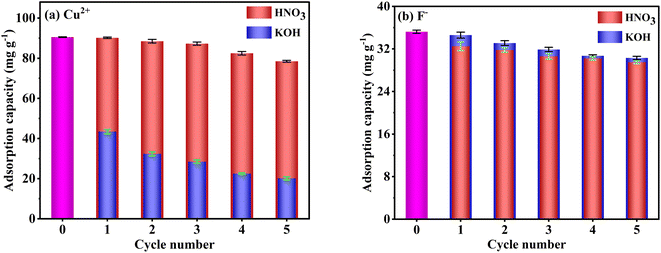 | ||
| Fig. 12 Reusability of FKBC for Cu2+ (a) and F− (b) after desorption-regeneration using HNO3 and KOH, respectively. | ||
4. Conclusion
A novel adsorbent, FKBC, is successfully prepared for Cu2+ and F− adsorption. The characterization results indicate that FKBC has a mesoporous structure after KOH modification, and the surface loading α-FeOOH has also been successful. Compared with raw BC, FKBC exhibits a larger specific surface area, pore volume, and smaller pore size, providing more adsorption sites and favorable conditions for Cu2+ and F− adsorption. Its adsorption effect for Cu2+ and F− heavily depends on the solution pH, contact time, dosage, Cu2+, and F− initial concentration. The FKBC adsorption kinetics shows that the pseudo-second-order kinetics model better fits the adsorption rate at each temperature. Based on the well-fitted Langmuir isotherm model, the maximum monolayer adsorption capacity of FKBC for Cu2+ and F− at 308 K is estimated at 117.4 mg g−1 and 42.4 mg g−1, respectively. Thermodynamic equations prove that increasing temperature can promote Cu2+ and F− adsorption by FKBC. The adsorption mechanism suggests that the process mainly involves chemical adsorption, and the α-FeOOH on the FKBC surface mainly contributes to Cu2+ and F− adsorption. In addition, the selective adsorption results indicate that FKBC is a selective adsorbent for Cu2+ and F−. The adsorption–desorption results also prove that FKBC has high recycling value. Overall, FKBC can potentially adsorb both Cu2+ and F− effectively.Data availability
The data used and analyzed during the current study are available from the corresponding author upon reasonable request.Author contributions
Conceptualization, investigation, writing-original draft, funding acquisition, Wei Yang; investigation, Lei Zhang; conceptualization, methodology, Meng Li; data curation, Ting Zhang; project administration, Yue Liu; resources, Juan Liu.Conflicts of interest
The authors declare no competing interests.Acknowledgements
The authors would like to acknowledge the support of Hubei Polytechnic University Youth Project (18xjz01Q).References
- S. Aoudj, A. Khelifa, N. Drouiche and M. Hecini, Desalin. Water Treat., 2015, 57, 18398–18405 CrossRef.
- X. Min, X. Luo, F. Deng, P. Shao, X. Wu and D. D. Dionysiou, Chem. Eng. J., 2018, 354, 228–236 CrossRef CAS.
- E. Kumar, A. Bhatnagar, M. Ji, W. Jung, S. H. Lee, S. J. Kim, G. Lee, H. Song, J. Y. Choi, J. S. Yang and B. H. Jeon, Water Res., 2009, 43, 490–498 CrossRef CAS PubMed.
- H. Sun, Z. Ji, Y. He, L. Wang, J. Zhan, L. Chen and Y. Zhao, Environ. Res., 2022, 204, 111943 CrossRef CAS PubMed.
- Q. Zhou, B. Liao, L. Lin, W. Qiu and Z. Song, Sci. Total Environ., 2018, 615, 115–122 CrossRef CAS PubMed.
- Y. Jin, M. Zhang, Z. Jin, G. Wang, R. Li, X. Zhang, X. Liu, J. Qu and H. Wang, Environ. Res., 2021, 196, 110323 CrossRef CAS PubMed.
- V. J. Inglezakis and M. D. L. J., Desalination, 2007, 211, 238–248 CrossRef CAS.
- R. R. Navarro, S. Wada and K. J. S. S. Tatsumi, Sep. Sci. Technol., 2003, 38, 2327–2345 CrossRef CAS.
- M. D. Machado, M. S. F. Santos, C. Gouveia, H. M. V. M. Soares and E. V. J. B. T. Soares, Bioresour. Technol., 2008, 99, 2107–2115 CrossRef CAS PubMed.
- W. Tang, D. He, C. Zhang, P. Kovalsky and T. D. Waite, Water Res., 2017, 120, 229–237 CrossRef CAS PubMed.
- E. Dialynas and E. J. D., Diamadopoulos, 2009, 238, 302–311 CAS.
- L. Lv, J. He, M. Wei, D. G. Evans and Z. Zhou, Water Res., 2007, 41, 1534–1542 CrossRef CAS PubMed.
- M. Umehara, Y. Kumamoto, K. Mukai and A. Isogai, Cellulose, 2022, 29, 9283–9295 CrossRef CAS.
- R. Yang, J. Chen, Z. Zhang and D. Wu, Chemosphere, 2022, 307, 136063 CrossRef CAS PubMed.
- B. Ekka, G. Dhar, S. Sahu, M. Mishra, P. Dash and R. K. Patel, Ceram. Int., 2021, 47, 19079–19089 CrossRef CAS.
- B. Barik, A. Kumar, P. S. Nayak, L. S. K. Achary, L. Rout and P. Dash, Mater. Chem. Phys., 2020, 239, 122028 CrossRef CAS.
- L. Huang, Z. Luo, X. Huang, Y. Wang, J. Yan, W. Liu, Y. Guo, S. R. Babu Arulmani, M. Shao and H. Zhang, Chemosphere, 2022, 301, 134679 CrossRef CAS PubMed.
- S. Rajendran, A. K. Priya, P. Senthil Kumar, T. K. A. Hoang, K. Sekar, K. Y. Chong, K. S. Khoo, H. S. Ng and P. L. Show, Chemosphere, 2022, 303, 135146 CrossRef CAS PubMed.
- Y. Ma, T. Lu, J. Tang, P. Li, O. Mašek, L. Yang, L. Wu, L. He, Y. Ding, F. Gao, X. Qi and Z. Zhang, Sep. Purif. Technol., 2022, 297, 121426 CrossRef CAS.
- X. Zhang, Y. Li, M. Wu, Y. Pang, Z. Hao, M. Hu, R. Qiu and Z. Chen, Bioresour. Technol., 2021, 320, 124264 CrossRef CAS PubMed.
- T. B. Nguyen, T. K. Nguyen, W. H. Chen, C. W. Chen, X. T. Bui, A. K. Patel and C. D. Dong, Bioresour. Technol., 2023, 373, 128711 CrossRef CAS PubMed.
- Y. Jiao, T. Wang, M. He, X. Liu, C. Lin and W. Ouyang, Sci. Total Environ., 2022, 830, 154831 CrossRef CAS PubMed.
- L. Zhang, M. Feng, D. Zhao, M. Li, S. Qiu, M. Yuan, C. Guo, W. Han, K. Zhang and F. Wang, Sep. Purif. Technol., 2023, 304, 122248 CrossRef CAS.
- S. Y. Li, H. J. Teng, J. Z. Guo, Y. X. Wang and B. Li, Bioresour. Technol., 2021, 342, 126028 CrossRef CAS PubMed.
- J. Qu, X. Lin, Z. Liu, Y. Liu, Z. Wang, S. Liu, Q. Meng, Y. Tao, Q. Hu and Y. Zhang, Bioresour. Technol., 2022, 343, 126046 CrossRef CAS PubMed.
- E. Yang, C. Yao, Y. Liu, C. Zhang, L. Jia, D. Li, Z. Fu, D. Sun, S. Robert Kirk and D. Yin, Fuel, 2018, 211, 121–129 CrossRef CAS.
- K. Chaturvedi, A. Singhwane, M. Dhangar, M. Mili, N. Gorhae, A. Naik, N. Prashant, A. K. Srivastava and S. Verma, Biomass Convers. Biorefin., 2023, 1–27, DOI:10.1007/s13399-022-03715-3.
- S. Cheng, S. Zhao, H. Guo, B. Xing, Y. Liu, C. Zhang and M. Ma, Bioresour. Technol., 2022, 343, 126081 CrossRef CAS PubMed.
- Y. Wang, H. Li and S. Lin, Toxics, 2022, 10, 787 CrossRef CAS PubMed.
- R. S. Thakur, S. S. Katoch and A. Modi, SN Appl. Sci., 2020, 2, 1407 CrossRef CAS.
- L. Lai, X. Liu, W. Ren, Z. Zhou, X. Zhao, X. Zeng, C. Lin, M. He and W. Ouyang, Chemosphere, 2023, 311, 137057 CrossRef CAS PubMed.
- X. Liang, Y. Su, X. Wang, C. Liang, C. Tang, J. Wei, K. Liu, J. Ma, F. Yu and Y. Li, Chemosphere, 2023, 313, 137467 CrossRef CAS PubMed.
- P. Pillai, Y. Lakhtaria, S. Dharaskar and M. Khalid, Environ. Sci. Pollut. Res. Int., 2020, 27, 20606–20620 CrossRef CAS PubMed.
- H. Zhang, P. Li, Z. Wang, X. Zhang, S. Zheng and Y. Zhang, ACS Sustain. Chem. Eng., 2017, 5, 6674–6681 CrossRef CAS.
- N. Guo, X. Lv, Q. Li, T. Ren, H. Song and Q. Yang, Microporous Mesoporous Mater., 2020, 299, 110101 CrossRef CAS.
- N. Xu, C. Christodoulatos and W. Braida, Chemosphere, 2006, 62, 1726–1735 CrossRef CAS PubMed.
- M. Umehara, Y. Kumamoto, K. Mukai and A. Isogai, Environ. Sci. Pollut. Res. Int., 2023, 30, 48201–48210 CrossRef CAS PubMed.
- L. Xu, Z. Shu, J. Song, T. Li and J. Zhou, Sci. Total Environ., 2023, 863, 160951 CrossRef CAS PubMed.
- J. Jonsson, S. Sjoberg and L. Lovgren, Water Res., 2006, 40, 969–974 CrossRef PubMed.
- X. Zhang, D. D. Gang, P. Sun, Q. Lian and H. Yao, Chemosphere, 2021, 262, 127861 CrossRef CAS PubMed.
- Q. Liu, W. Y. Deng, L. Y. Zhang, C. X. Liu, W. W. Jie, R. X. Su, B. Zhou, L. M. Lu, S. W. Liu and X. G. Huang, Materials, 2023, 16, 1528 CrossRef CAS PubMed.
- M. S. Netto, J. Georgin, D. S. P. Franco, E. S. Mallmann, E. L. Foletto, M. Godinho, D. Pinto and G. L. Dotto, Environ. Sci. Pollut. Res. Int., 2022, 29, 3672–3685 CrossRef CAS PubMed.
- H. Zhao, Z. Wang, Y. Liang, T. Wu, Y. Chen, J. Yan, Y. Zhu and D. Ding, Environ. Res., 2023, 226, 115676 CrossRef CAS PubMed.
- S. Wang, L. Dong, D. Feng, Y. Zhang, Z. Zhang, D. Guo, W. Zhang, K. Wu, Y. Zhao and S. Sun, Fuel Process. Technol., 2022, 238, 107511 CrossRef CAS.
- J. Luo, X. Li, C. Ge, K. Muller, H. Yu, P. Huang, J. Li, D. C. W. Tsang, N. S. Bolan, J. Rinklebe and H. Wang, Bioresour. Technol., 2018, 263, 385–392 CrossRef CAS PubMed.
- Q. Li, X. Ma, C. Qi, R. Li, W. Zhang, J. Li, J. Shen and X. Sun, Sci. Total Environ., 2022, 821, 153529 CrossRef CAS PubMed.
- K. Kayalvizhi, N. M. I. Alhaji, D. Saravanakkumar, S. B. Mohamed, K. Kaviyarasu, A. Ayeshamariam, A. M. Al-Mohaimeed, M. R. AbdelGawwad and M. S. Elshikh, Environ. Res., 2022, 203, 111814 CrossRef CAS PubMed.
- N. G. Corral-Capulin, A. R. Vilchis-Nestor, E. Gutiérrez-Segura and M. Solache-Ríos, Appl. Clay Sci., 2019, 173, 19–28 CrossRef CAS.
- F. Wang, J. Gao, L. Jia, S. Wang and P. Ning, Environ. Sci. Pollut. Res. Int., 2022, 29, 989–998 CrossRef CAS PubMed.
- S. Pirsalami, S. Bagherpour, M. Ebrahim Bahrololoom and M. Riazi, Sep. Purif. Technol., 2021, 275, 119215 CrossRef CAS.
- M. J. Ahmed, Environ. Toxicol. Pharmacol., 2017, 50, 1–10 CrossRef CAS PubMed.
- J. Liu, Y. Liu, Y. Shen, X. Wei, W. Yuan, J. Qi, J. Cao, P. Deng, H. Hu, L. Wang and J. Wang, Sep. Purif. Technol., 2023, 306, 122532 CrossRef CAS.
- S. Khandaker, M. T. Hossain, P. K. Saha, U. Rayhan, A. Islam, T. R. Choudhury and M. R. Awual, J. Environ. Manage., 2021, 300, 113782 CrossRef CAS PubMed.
- N. Ayawei, A. N. Ebelegi and D. Wankasi, J. Chem., 2017, 2017, 1–11 CrossRef.
- F. Reguyal, A. K. Sarmah and W. Gao, J. Hazard. Mater., 2017, 321, 868–878 CrossRef CAS PubMed.
- M. A. Al-Ghouti and D. A. Da'ana, J. Hazard. Mater., 2020, 393, 122383 CrossRef CAS PubMed.
- J. Liu, W. Cheng, X. Yang and Y. Bao, Sci. Total Environ., 2020, 704, 135252 CrossRef CAS PubMed.
- M. Gao, W. Wang, M. Cao, H. Yang and Y. Li, Environ. Res., 2020, 188, 109735 CrossRef CAS PubMed.
- X. Zhou and X. Zhou, Chem. Eng. Commun., 2014, 201, 1459–1467 CrossRef CAS.
- K. K. Yadav, N. Gupta, V. Kumar, S. A. Khan and A. Kumar, Environ. Int., 2018, 111, 80–108 CrossRef CAS PubMed.
- C. Dai, H. L. Qian and X. P. Yan, J. Hazard. Mater., 2021, 416, 125860 CrossRef CAS PubMed.
- H. Yang, K. Huang, K. Zhang, Q. Weng, H. Zhang and F. Wang, Environ. Sci. Technol., 2021, 55, 14316–14328 CrossRef CAS PubMed.
Footnote |
| † Electronic supplementary information (ESI) available. See DOI: https://doi.org/10.1039/d3ra05315f |
| This journal is © The Royal Society of Chemistry 2023 |

