 Open Access Article
Mol-Zero-GAN: zero-shot adaptation of molecular generative adversarial network for specific protein targets†
Ravipas Aphikulvanich a,
Natapol Pornputtapongb and
Duangdao Wichadakul
 *ac
*ac
aDepartment of Computer Engineering, Faculty of Engineering, Chulalongkorn University, Bangkok, 10330, Thailand. E-mail: ravipas.apk@gmail.com
bDepartment of Biochemistry and Microbiology, Faculty of Pharmaceutical Sciences, Chulalongkorn University, Bangkok, 10330, Thailand. E-mail: natapol.p@chula.ac.th
cCenter of Excellence in Systems Biology, Faculty of Medicine, Chulalongkorn University, Bangkok, 10330, Thailand. E-mail: duangdao.w@chula.ac.th
First published on 12th December 2023
Abstract
Drug discovery is a process that finds new potential drug candidates for curing diseases and is also vital to improving the wellness of people. Enhancing deep learning approaches, e.g., molecular generation models, increases the drug discovery process's efficiency. However, there is a problem in this field in creating drug candidates with desired properties such as the quantitative estimate of druglikeness (QED), synthetic accessibility (SA), and binding affinity (BA), and there is a challenge for training a generative model for specific protein targets that has less pharmaceutical data. In this research, we present Mol-Zero-GAN, a framework that aims to solve the problem based on Bayesian optimization (BO) to find the model optimal weights' singular values, factorized by singular value decomposition, and generate drug candidates with desired properties with no additional data. The proposed framework can produce drugs with the desired properties on protein targets of interest by optimizing the model's weights. Our framework outperforms the state-of-the-art methods sharing the same objectives. Mol-Zero-GAN is publicly available at https://github.com/cucpbioinfo/Mol-Zero-GAN.
1 Introduction
The COVID-19 pandemic has shown how vital drug discovery is by discovering novel or repurposing existing drugs for treating diseases and illnesses. Drug discovery not only has the potential to handle emerging diseases but also provides the possibility of finding better replacements for existing ones in terms of efficacy and non-toxicity. It offers humankind many benefits by improving people's health.With recent research results, machine learning approaches have shown effectiveness in drug discovery. By taking the discovery as a computational problem, drug molecules can be represented as SMILES strings, molecular graphs, or molecular fingerprints. Several studies applied machine learning techniques to learn and produce various molecular representations computationally. For example, recurrent neural network (RNN), an architecture for understanding sequential data patterns, was applied to build text generation models that generate SMILES strings.1,2 A variational autoencoder (VAE) is another model that learns the probability distribution of training data for sampling new instances and has been successfully applied to various molecular representations.3–8 Others3,9–11 demonstrated the power of a generative adversarial network (GAN), an architecture composed of two neural networks, a generator, and a discriminator, that are trained by competing with each other for generating new samples which are similar to training data but never seen before. Hence, deep learning has proven vital in moving drug discovery forward. Despite the efficiency of the deep learning models, generating drugs with desired properties, such as QED, SA, and BA for a protein target of interest, is still a challenge in this field, and finding new drug candidates for a protein target with fewer drug data is also a big problem. There are three practical approaches to resolving the issues. First, latent space optimization uses trained models that create continuous space representation, then utilizes it with effective querying methods to obtain generated molecules with specific properties such as Bayesian optimization,7,12–15 swarm optimization.16 Additionally, some work applied methods of searching for a promising molecule set to train during the training process for optimizing drug generative model such as Blanchard et al.,17 OptiMol,18 which proposed a fascinating workflow that generates novel molecules with desired properties well. OptiMol applied Conditioning by Adaptive Sampling (CbAS) to shift the based learned distribution to maximize an objective function: the docking score of the protein target. DrugGEN Ünlü et al.19 can generate molecules with specific properties by feeding protein features into its graph transformer decoder module. The provided protein features allow DrugGEN to design target-specific molecules by incorporating the desired protein target information. In addition to this approach, Brookes et al.20 proposed a model-based adaptive sampling method to optimize the generation of molecules with desired properties.20 Second, reinforcement learning (RL) is a powerful approach for decision-making in a molecular generation, where the current molecular structure serves as the state, the decision on which structure to add is the action, and the molecular property serves as the reward.21,22 Third, fine-tuning the Generative Pretrained Transformer (GPT), a versatile model capable of various tasks, has garnered significant attention recently.23–25 While its primary applications have been in natural language processing, there's growing interest in adapting GPT for other domains through fine-tuning.26,27 One such promising adaptation is PETrans, a method that fine-tunes GPT for de novo drug design.28 PETrans leverages transfer learning and protein-specific encoding to generate target-specific ligands, offering a fresh perspective on the challenge of producing drug-like molecules optimized for binding to target proteins.
However, optimizing a single objective may be inefficient as other features may conflict after the optimization. For example, some studies indicated a result of single-objective optimization on binding affinity compared to multi-objective optimization. Goel et al. proposed MoleGuLAR, a framework that applied RL to optimize an RNN model to generate desired drug candidates. MoleGuLAR presented alternating rewards, satisfying multi-objective optimization by swapping an objective during optimization. Its results showed that the single objective optimization improved the focused feature but did not perform well on other features such as druglikeness and octanol–water partition coefficient (LogP). On the other hand, multi-objective optimization approaches covered more of different properties. Therefore, proper optimization is essential for enhancing the models to generate drugs with desired properties.
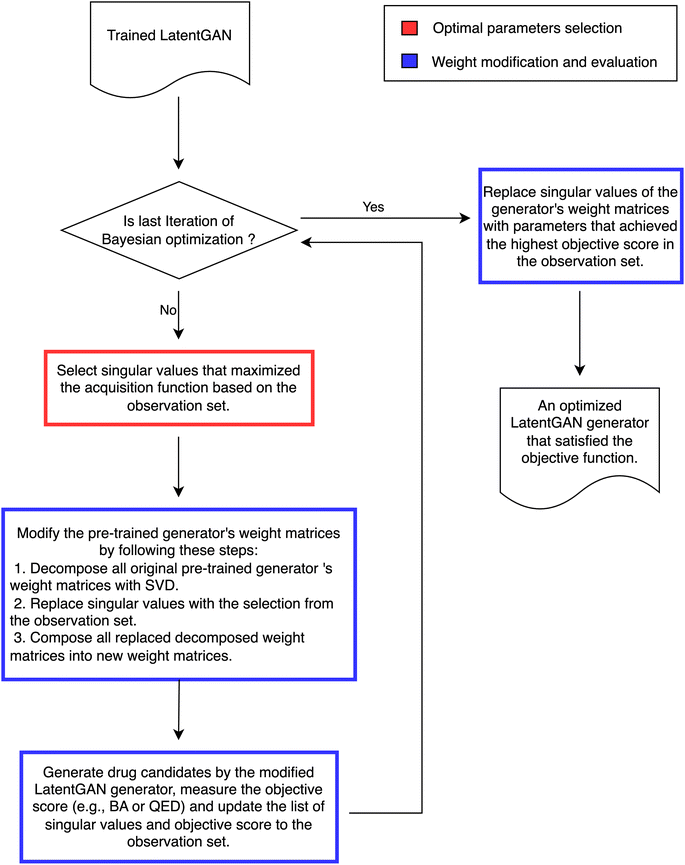
Instead of adjusting the latent space directly or generating additional compounds to refine the training process or using an RL, in this paper, we present a framework, Mol-Zero-GAN (Fig. 1), inspired by FSGAN,29 which learned from a few images to adapt the singular values of the pre-trained weights in StyleGAN2 (ref. 30) for synthesizing images in the targeted domain while keeping the natural style of the base model. Mol-Zero-GAN aims to optimize a drug-generative model's weights to enhance the model's ability to generate new drug candidates with desired properties without additional data while preserving the quality of other properties. We combined the modifying idea with Bayesian optimization to find optimal singular weight values in LatentGAN31 to obtain a drug generative model specially optimized for required properties. We have mentioned our significant contributions as follows:
• We propose a new method for optimizing the pre-trained drug generative model, which has improved compared to the base pre-trained model in terms of molecular properties.
• The proposed method outperformed or achieved on-par performance compared with the related works.
• The proposed method requires no additional data for generating new drugs targeting a specific protein of interest while preserving the druglikeness and synthetic accessibility of the base pre-trained model.
2 Methodology
2.1 Base molecular generator
We used the pre-trained generator of LatentGAN as a molecular generator in our proposed framework. LatentGAN is a drug generation model that integrates GAN and an autoencoder by utilizing the pre-trained autoencoder as a molecular representation and training GAN to learn to generate latent vectors, which are then decoded by the pre-trained decoder of the autoencoder. In this work, we trained the pre-trained LatentGAN by following the MOSES benchmark instructions,32 which consists of a dataset and a set of hyperparameters, and then we optimized LatentGAN's generator in our proposed framework to satisfy our objectives.2.2 Mol-Zero-GAN
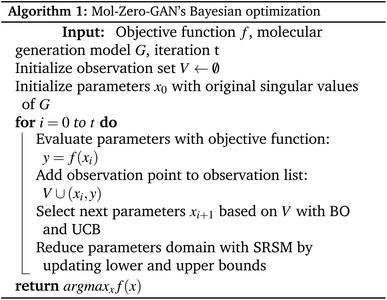
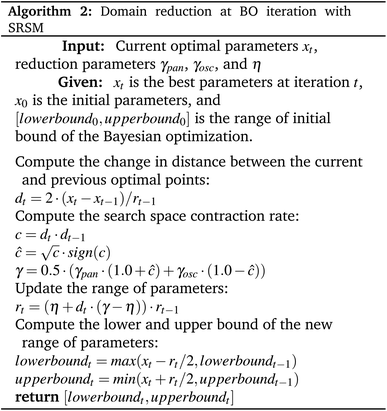
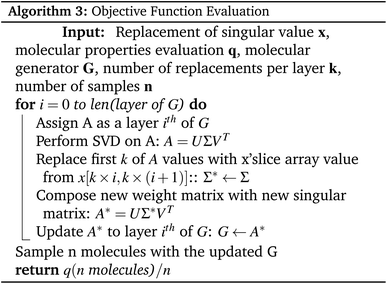
We propose Mol-Zero-GAN (Fig. 2), a framework for optimizing a pre-trained drug generative model to generate drug candidates for specific protein targets. We applied singular value decomposition (SVD) on weights of the pre-trained generator's five layers to extract the singular values, which we will use as parameters for Bayesian optimization (BO) to find the best replacement of these values of the model's layers to satisfy the defined objective function, formulated as eqn (1):| x* = argmaxx∈Xf(x) | (1) |
| X = {M·b|b ∈ h} | (2) |
| UCB(x) = μV(x) + κσV(x) | (3) |
In this work, we experimented with three objective functions, e.g., QED, BA, and weighted sum, on each selected protein target. We defined the objective function as the respective single properties for QED and BA scores. For weighted sum, we aggregated QED and BA into a new objective function by calculating the weighted sum of each property's score formulated as eqn (4):
 | (4) |
 and
and  are the average BA and QED scores of the generated compounds, m is the average BA score from the BA optimization experiment, and b is the average BA score of the base model, α, β are constants that we determined by balancing the difference in ranges between the expected range of
  and
and  . The expected range for weighted sum optimization of
  is typically 0 to 1 because we expected the lowest value of
  to be equal to the base model and the highest value of
  to be equal to the current BA of the optimized model. Additionally, based on the mean and standard deviation of the base model, we expected the range for
  to be between 0.60 and 1. However, since we aimed to maintain the QED value of generated compounds, we narrowed the expected range to 0.60 to 0.80. To balance the weight of both BA and QED, we chose alpha = 0.2 and beta = 1, from the difference in the range of expected values of
  and
and  , which is 1 (range of 0 to 1) and 0.2 (range of 0.60 to 0.80), respectively.
2.3 Molecular metrics
This work considers four molecular properties for the evaluation: BA, QED, SA, and diversity. The BA value can refer to the strength of interaction between a drug candidate and a protein target; a more negative value indicates a stronger interaction. A QED value in a range of 0 to 1 represents druglikeness. The QED closer to 1, the more drug-like. SA is a value ranging from 1 to 10, the higher value the more difficulty synthesizing the drug. Finally, diversity is a metric that reflects how compounds are diverse within the generated set.2.4 Data preparation and experimental setup
As our objectives were to generate new drugs having lower BA for seven protein targets to compare with the previous works, i.e., OptiMol, MoleGuLAR, PETrans, and DrugGEN, while preserving other properties, we obtained the 3D structures of the target proteins DRD3 (PDB: 3PBL) from the Directory of Useful Decoys, Enhanced (DUD-E),35 TTBK1 (PDB: 4BTK), SARS-CoV-2 Mpro (PDB: 6LU7), EGFR (PDB: 2RGP), HTR1A (PDB: 7E2X), S1PR1 (PDB: 7VIH) from the Protein Data Bank Center36 and AKT1 (PDB: 4GV1) from a web server for structure-based kinase profiling called ProfKin.37 We created a grid parameter for AKT1 by manually drawing a grid box around the center point, corresponding to the binding site's center of mass. Additionally, we adopted the drug molecule's docking grid of other proteins, as shown in Table 1 from OptiMol, MoleGuLAR, and PETrans. Based on the prepared protein structures, for each iteration of the model's singular values optimization and evaluation, we converted SMILES strings generated from the optimized model to 3D structures using the RDKit library38 and prepare_ligand4.py from ref. 39. We then used AutoDock Vina40 to determine the binding affinity (BA) with the most stable configuration of molecular poses for proteins DRD3, SARS-CoV-2 Mpro, TTBK1, and AKT1, and used QuickVina-W41 for proteins EGFR, HTR1A, and S1PR1. For QED and SA, we applied RDKit and MOSES to measure the scores of validly generated compounds. Finally, we measured the diversity by calculating the average pairwise Tanimoto distance among the generated compounds' fingerprints.| Protein PDB ID | Grid size | Grid box center (x, y, z) |
|---|---|---|
| DRD3 | 36.975 Å × 39.940 Å × 38.529 Å | (10.192, 22.963, 23.884) |
| SARS-CoV-2 Mpro | 40 Å × 40 Å × 40 Å | (−10.063, 16.667, 67.294) |
| TTBK1 | 40 Å × 40 Å × 40 Å | (61.955, 18.155, 24.305) |
| EGFR | 44 Å × 49 Å × 57 Å | (19.496, 35.001, 89.270) |
| S1PR1 | 75 Å × 75 Å × 75 Å | (120.713, 118.886, 131.755) |
| HTR1A | 75 Å × 75 Å × 75 Å | (93.496, 92.635, 76.821) |
| AKT1 | 18 Å × 18 Å × 18 Å | (−22.454, 3.192, 9.571) |
In this study, we evaluated our results by measuring the molecular properties: BA, QED, SA, and diversity of validly generated samples, 100![[thin space (1/6-em)]](https://www.rsc.org/images/entities/char_2009.gif) 000 compounds for DRD3, 10
000 compounds for DRD3, 10![[thin space (1/6-em)]](https://www.rsc.org/images/entities/char_2009.gif) 000 compounds each for TTBK1, SARS-CoV-2 Mpro, EGFR, HTR1A, S1PR1 and AKT1 to compare with previous works. We used Pytorch42 as the development tool for training and manipulating the generator's weights, and bayes_opt,43 a Python library for performing Bayesian optimization.
000 compounds each for TTBK1, SARS-CoV-2 Mpro, EGFR, HTR1A, S1PR1 and AKT1 to compare with previous works. We used Pytorch42 as the development tool for training and manipulating the generator's weights, and bayes_opt,43 a Python library for performing Bayesian optimization.
3 Results
In this section, we present the results of our experiments on QED, BA, and weighted sum optimization for protein targets: DRD3, TTBK1, SARS-CoV-2 Mpro, EGFR, HTR1A, S1PR1, and AKT1. After that, we discuss and compare our results with the base model before optimization and previous works.3.1 Hyperparameters for model optimization
Based on our computational resources, we selected the number of singular values per layer (k) by pivoting to perform our method with n = 3072 and QED as the objective function. First, we tested values of k from 1 to 10 (Table 2) and selected the value, k = 5, that gave us the best average QED score. Next, we chose the number of generated drug molecules (n) to fit our available computational resources to ensure we could run the process until completion and used the default SRSM's hyperparameters of bayes_opt. Finally, we decided the multiplier range (h) to be [0, 2] with the lower bound as zero since singular values are nonnegative and the upper bound as two because it is a symmetric scaling factor. Table 3 shows the hyperparameters we used in our Bayesian optimization process.| Number of singular values | Average QED score |
|---|---|
| 1 | 0.82 |
| 2 | 0.87 |
| 3 | 0.86 |
| 4 | 0.87 |
| 5 | 0.88 |
| 6 | 0.87 |
| 7 | 0.86 |
| 8 | 0.84 |
| 9 | 0.87 |
| 10 | 0.83 |
| Hyperparameter | Value |
|---|---|
| Number of singular values per layer for replacement (k) | 5 |
| Number of generated drug molecules for calculating the objective score (n) | 3072 |
| Number of iterations in the BO | 50 |
| UCB exploration parameter (κ) | 2.576 |
| SRSM oscillation parameter (γosc) | 0.7 |
| SRSM panning parameter (γpan) | 1.0 |
| SRSM scaling parameter (η) | 0.9 |
| Range of multipliers (h) | [0, 2] |
3.2 Optimized model with QED objective
By defining the average QED of generated compounds as an objective function, we obtained an optimized model that can produce drug candidates with higher druglikeness than the base model. Fig. 3a presents the improvement of average QED through iterations of Bayesian optimization, and Fig. 3b shows the distribution of the QED and SA of valid compounds generated by the optimized model compared to the base model. The results show that the QED optimization has successfully improved both the QED and SA of generated drug candidates from the optimized model compared to the base model.3.3 Optimized model with BA objective
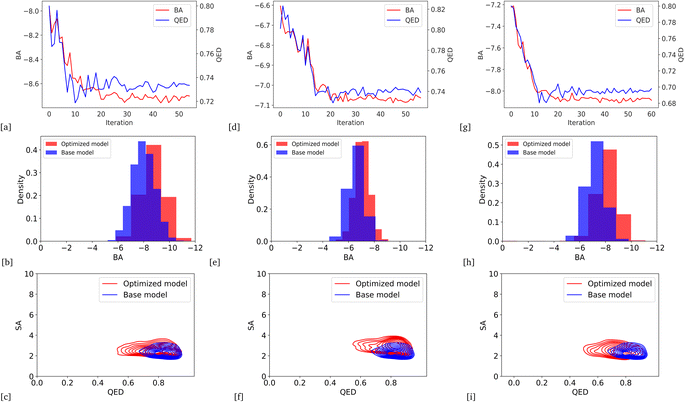
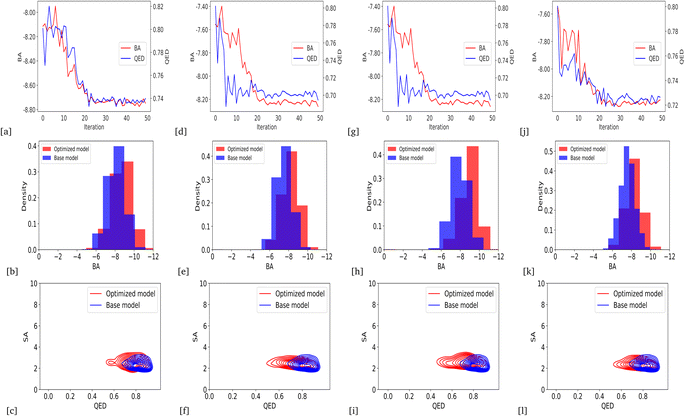
We optimized the base model to generate drug candidates with lower binding affinities for all protein targets: DRD3, SARS-CoV-2 Mpro, TTBK1, EGFR, HTR1A, S1PR1, and AKT1 by defining the average BA score of the generated compounds as an objective function. Fig. 4 and 5 show the changes in BA and QED scores between consecutive BO iterations, BA distribution, and QED and SA distribution of valid compounds generated by the base model compared to the DRD3-optimized model (Fig. 4a–c), the SARS-CoV-2 Mpro-optimized model (Fig. 4d–f), the TTBK1-optimized model (Fig. 4g–i), the EGFR-optimized model (Fig. 5a–c), the HTR1A-optimized model (Fig. 5d–f), the S1PR1-optimized model (Fig. 5g–i), and the AKT1-optimized model (Fig. 5j–l). From the results, BA optimization has shown improvement in the BA scores of generated drug candidates from optimized models of the protein targets compared to the base model. However, there is a noticeable variance in other properties of the generated drugs, especially QED. This observation suggests that our model behaves in a way that indicates a trade-off when optimizing for BA.3.4 Optimized model with weighted sum of BA and QED
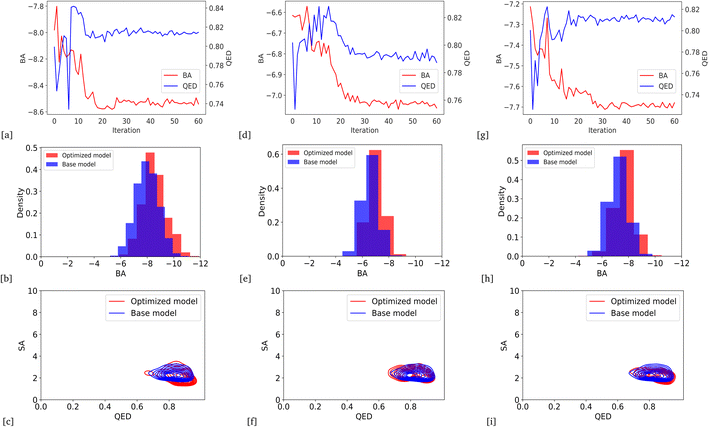
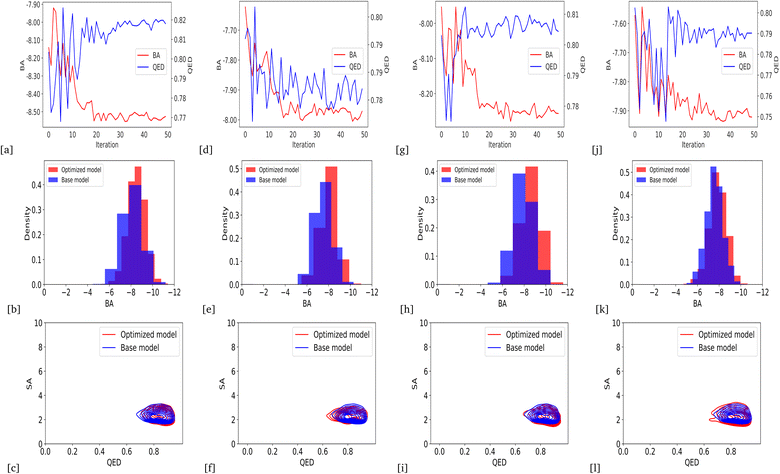
Due to the higher variance of QED scores in our models based on BA optimization, we integrated average QED and BA scores into a weighted sum objective function (eqn (4)) with α = 0.2 and β = 1. As a result, we could generate the lower average BA score by optimizing the models for all protein targets: DRD3, TTBK1, SARS-CoV-2 Mpro, EGFR, HTR1A, S1PR1, and AKT1, with an average QED score comparable to the base model. Fig. 6 and 7 show the changes in BA and QED scores between consecutive BO iterations, BA distribution, and QED and SA distribution of valid compounds generated by the base model compared to the DRD3-optimized model (6a–c), the SARS-CoV-2 Mpro-optimized model (Fig. 6d–f), the TTBK1-optimized model (Fig. 6g–i), the EGFR-optimized model (Fig. 7a–c), the HTR1A-optimized model (Fig. 7d–f), the S1PR1-optimized model (Fig. 7g–i), and the AKT1-optimized model (Fig. 7j–l). The results show successful improvement of BA score for Mol-Zero-GAN-generated compounds while preserving the base model's QED scores for all seven protein targets compared to BA optimization. However, by employing self-feedback mechanisms to fine-tune GANs for generating drugs with enhanced binding affinities, there is a potential for an increased variance in the QED. This increase can be attributed to the fact that the model is adjusted based on the data it generates rather than solely relying on the initial training dataset. This iterative and dynamic adjustment can lead to broader exploration in the generated molecular space.3.5 Benchmark results with previous works
Tables 4–10 show the molecular properties' statistical summary of our work compared to the base model and previous works. Both BA and weight sum optimization outperformed the previous works regarding QED and SA. Additionally, the BA optimization surpassed PETrans (S1PR1) and OptiMol (DRD3) in terms of BA performance. ESI Fig. S1–S7† show examples of generated molecules of BA-optimized models for DRD3, SARS-CoV-2 Mpro, TTBK1, EGFR, HTR1A, S1PR1, AKT1 and ESI Fig. S8–S14† show examples of generated molecules of weighted sum optimization models of DRD3, SARS-CoV-2 Mpro, TTBK1, EGFR, HTR1A, S1PR1, and AKT1 respectively.![[thin space (1/6-em)]](https://www.rsc.org/images/entities/char_2009.gif) 000 valid drug candidates generated by Mol-Zero-GAN's optimized model for DRD3 protein target compared to OptiMol
000 valid drug candidates generated by Mol-Zero-GAN's optimized model for DRD3 protein target compared to OptiMol
| Model | BA(std) | QED(std) | SA(std) | Diversity |
|---|---|---|---|---|
| a This information was obtained directly from OptiMol's results. | ||||
| Base model (LatentGAN) | −7.96(0.97) | 0.80(0.10) | 2.52(0.55) | 0.86 |
| OptiMol (multiobjective)a | −8.58 | 0.69 | 2.84 | 0.86 |
| Mol-Zero-GAN (BA optimization) | −8.72(0.89) | 0.73(0.13) | 2.77(0.64) | 0.83 |
| Mol-Zero-GAN (weighted sum optimization) | −8.53(0.89) | 0.81(0.12) | 2.36(0.67) | 0.82 |
![[thin space (1/6-em)]](https://www.rsc.org/images/entities/char_2009.gif) 000 valid drug candidates generated by Mol-Zero-GAN's optimized model for SARS-CoV-2 Mpro protein target compared to MoleGuLAR
000 valid drug candidates generated by Mol-Zero-GAN's optimized model for SARS-CoV-2 Mpro protein target compared to MoleGuLAR
| Model | BA(std) | QED(std) | SA(std) | Diversity |
|---|---|---|---|---|
| a We reproduced the results of MoleGuLAR by cloning the source code from its official repository at GitHub. Then, we applied a multi-objective optimization approach with alternating rewards. We ran the optimization process for 175 iterations by modifying the original approach and setting BA and QED with a target of 1 as the combined objectives instead of BA and LogP with a target of 2.5. We swapped every 35 iterations, starting with BA. Like the original work, we used AutoDock-GPU44 docking score for BA evaluation during the reinforcement learning process and used AutoDock Vina to evaluate the generated compounds. | ||||
| Base model (LatentGAN) | −6.61(0.60) | 0.80(0.10) | 2.51(0.54) | 0.86 |
| MoleGuLARa | −7.80(0.94) | 0.11(0.13) | 4.25(0.98) | 0.81 |
| Mol-Zero-GAN (BA optimization) | −7.07(0.58) | 0.74(0.14) | 2.99(0.58) | 0.84 |
| Mol-Zero-GAN (weighted sum optimization) | −7.04(0.57) | 0.79(0.10) | 2.54(0.63) | 0.84 |
![[thin space (1/6-em)]](https://www.rsc.org/images/entities/char_2009.gif) 000 valid drug candidates generated by Mol-Zero-GAN's optimized model for TTBK1 protein target compared to MoleGuLAR
000 valid drug candidates generated by Mol-Zero-GAN's optimized model for TTBK1 protein target compared to MoleGuLAR
| Model | BA(std) | QED(std) | SA(std) | Diversity |
|---|---|---|---|---|
| a We reproduced the results of MoleGuLAR by cloning the source code from its official repository at GitHub. Then, we applied a multi-objective optimization approach with alternating rewards. We ran the optimization process for 175 iterations by modifying the original approach and setting BA and QED with a target of 1 as the combined objectives instead of BA and LogP with a target of 2.5. We swapped every 35 iterations, starting with BA. Like the original work, we used AutoDock-GPU44 docking score for BA evaluation during the reinforcement learning process and used AutoDock Vina to evaluate the generated compounds. | ||||
| Base model (LatentGAN) | −7.20(0.72) | 0.80(0.10) | 2.51(0.54) | 0.86 |
| MoleGuLARa | −9.37(1.08) | 0.13(0.10) | 3.33(0.78) | 0.80 |
| Mol-Zero-GAN (BA optimization) | −8.07(0.88) | 0.70(0.14) | 2.76(0.98) | 0.83 |
| Mol-Zero-GAN (weighted sum optimization) | −7.69(0.69) | 0.81(0.10) | 2.44(0.60) | 0.83 |
![[thin space (1/6-em)]](https://www.rsc.org/images/entities/char_2009.gif) 000 valid drug candidates generated by Mol-Zero-GAN's optimized model for EGFR protein target compared to PETrans
000 valid drug candidates generated by Mol-Zero-GAN's optimized model for EGFR protein target compared to PETrans
| Model | BA(std) | QED(std) | SA(std) | Diversity |
|---|---|---|---|---|
| Base model (LatentGAN) | −8.07(0.92) | 0.80(0.10) | 2.51(0.54) | 0.86 |
| PETransa | −7.97 | 0.45 | 2.74 | N/A |
| Mol-Zero-GAN (BA optimization) | −8.70(1.05) | 0.74(0.12) | 2.71(0.69) | 0.84 |
| Mol-Zero-GAN (weighted sum optimization) | −8.52(0.79) | 0.82(0.10) | 2.47(0.53) | 0.83 |
![[thin space (1/6-em)]](https://www.rsc.org/images/entities/char_2009.gif) 000 valid drug candidates generated by Mol-Zero-GAN's optimized model for HTR1A protein target compared to PETrans
000 valid drug candidates generated by Mol-Zero-GAN's optimized model for HTR1A protein target compared to PETrans
| Model | BA(std) | QED(std) | SA(std) | Diversity |
|---|---|---|---|---|
| a This information was obtained directly from PETrans results. | ||||
| Base model (LatentGAN) | −7.50(0.83) | 0.80(0.10) | 2.51(0.54) | 0.86 |
| PETransa | −8.59 | 0.53 | 2.97 | N/A |
| Mol-Zero-GAN (BA optimization) | −8.16(0.91) | 0.70(0.14) | 2.60(0.50) | 0.84 |
| Mol-Zero-GAN (weighted sum optimization) | −7.99(0.83) | 0.78(0.11) | 2.45(0.51) | 0.84 |
![[thin space (1/6-em)]](https://www.rsc.org/images/entities/char_2009.gif) 000 valid drug candidates generated by Mol-Zero-GAN's optimized model for S1PR1 protein target compared to PETrans
000 valid drug candidates generated by Mol-Zero-GAN's optimized model for S1PR1 protein target compared to PETrans
| Model | BA(std) | QED(std) | SA(std) | Diversity |
|---|---|---|---|---|
| a This information was obtained directly from PETrans results. | ||||
| Base model (LatentGAN) | −7.90(0.92) | 0.80(0.10) | 2.51(0.54) | 0.86 |
| PETransa | −9.58 | 0.46 | 2.56 | N/A |
| Mol-Zero-GAN (BA optimization) | −8.94(1.03) | 0.68(0.14) | 2.83(1.02) | 0.82 |
| Mol-Zero-GAN (weighted sum optimization) | −8.20(0.85) | 0.81(0.11) | 2.41(0.58) | 0.84 |
![[thin space (1/6-em)]](https://www.rsc.org/images/entities/char_2009.gif) 000 valid drug candidates generated by Mol-Zero-GAN's optimized model for AKT1 protein target compared to DrugGEN
000 valid drug candidates generated by Mol-Zero-GAN's optimized model for AKT1 protein target compared to DrugGEN
| Model | BA(std) | QED(std) | SA(std) | Diversity |
|---|---|---|---|---|
| a The DrugGEN models and data were sourced from the DrugGEN's GitHub repository (https://github.com/HUBioDataLab/DrugGEN). DrugGEN employs two primary Generative Adversarial Networks (GANs) of multilayer perceptron (MLP) and graph transformers: GAN1 is responsible for crafting new molecular structures, and GAN2 refines these molecules to target specific properties. The framework is diversified into five distinct models: DrugGEN-Prot merges GAN1's molecule generation with GAN2's protein design capabilities; DrugGEN-CrossLoss solely utilizes GAN1 to align generated molecules with real inhibitors; DrugGEN-Ligand, a variant of DrugGEN-Prot, integrates AKT1 inhibitor features into GAN2; DrugGEN-RL, an advanced version of DrugGEN-Ligand, promotes molecular diversity through reinforcement learning; and finally, DrugGEN-NoTarget employs GAN1 to replicate molecules from the ChEMBL database without any specific targeting. | ||||
| Base model (LatentGAN) | −7.57(0.79) | 0.80(0.10) | 2.51(0.54) | 0.86 |
| DrugGEN-Prota | −8.54(1.23) | 0.53(0.19) | 3.67(0.89) | 0.88 |
| DrugGEN-CrossLossa | −8.24(1.15) | 0.54(0.20) | 3.28(0.93) | 0.88 |
| DrugGEN-Liganda | −8.32(1.28) | 0.51(0.18) | 3.28(0.97) | 0.88 |
| DrugGEN-RLa | −8.45(1.20) | 0.53(0.20) | 3.10(1.03) | 0.87 |
| DrugGen-NoTrageta | −8.10(1.17) | 0.57(0.21) | 3.30(1.04) | 0.88 |
| Mol-Zero-GAN (BA optimization) | −8.25(0.81) | 0.72(0.12) | 2.57(0.56) | 0.84 |
| Mol-Zero-GAN (weighted sum optimization) | −7.91(0.80) | 0.79(0.11) | 2.50(0.63) | 0.83 |
4 Discussions
Bayesian optimization (BO) is an optimization process that performs well in low-dimensional search space problems. For our work, BO is suitable for searching the optimal singular values, including 25 parameters (five layers with five singular values per layer). The singular value modification process modifies the singular values of the diagonal matrices of the generator's weights while keeping the left and right matrices the same, preserving the main characteristics of each layer's linear transformation. Hence, Mol-Zero-GAN can potentially optimize target properties while maintaining others.From the QED optimization result, Mol-Zero-GAN has successfully leveraged the average QED value compared to the base model. By setting QED as an objective function, the optimization process motivated the optimized model to generate drug candidates with a better average QED score. Higher QED indicates better drug-like properties that boost the optimized model to create drug candidates with properties similar to real-world existing drugs. Furthermore, since the properties of existing drugs refer to the potential for large-scale production, the optimized model is also implicitly motivated to improve the average SA score indicating the more straightforward synthesis of the drug candidates.
Mol-Zero-GAN also successfully optimized the BA score in the BA optimization process. As a result, the optimized model could generate drug candidates with an average BA score lower than the base model. However, the average QED score of the optimized model was not as good as the base model's and fluctuated more, reflecting the optimization trade-off between BA and QED.
The introduced weighted sum optimization can generate drug candidates with an average lower BA score than the base model but not as good as the BA optimization. However, the average QED is similar to the base model, reflecting the optimization trade-off between BA and QED and the effectiveness of modeling the objective function to motivate the optimized model to preserve QED. The introduced weighted sum optimization also maintained SA from the base model, as shown in the generated drug properties, which have similar values to the base model. The α and β are balancing factors determining the trade-off between BA optimization and QED preservation, which are adjustable to specific proposes.
Our work has outperformed previous works in terms of drug-likeness and synthesis-accessible properties. By comparing our work to the multi-objective model from OptiMol, our optimized model from BA optimization generated drug candidates with better properties in terms of average BA, QED, and SA. Although the generated drugs from Mol-Zero-GAN's optimized models did not get average BA scores as low as the MoleGuLAR, our optimized models generated drugs with more practical QED and SA properties. OptiMol and MoleGuLAR rely on retraining a generative model and reinforcement learning. Retraining a generative model by selecting generated molecules with lower BA and higher QED to retrain the model in OptiMol would modify the model weight without trying to preserve the original model's characteristics that learned various properties from the actual drug dataset during the initial training. On the other hand, reinforcement learning in MoleGuLAR tries to learn a policy gradient that takes the generator into a model space, which generates new molecules that maximize the reward scores. This optimized generator, however, may fall into the model space with an outstanding property but violating other properties. Even though MoleGuLAR's alternative rewards try to switch back and forth between properties' rewards, updating the model space for the first property's rewarding may constrain modifying the model space of the second property's rewards.
Compared to DrugGEN, the model is specifically designed to focus on small molecules and incorporates protein features like AKT1. However, including such protein features might alter certain characteristics inherent to the DrugGEN's base model during drug design. In comparison, Mol-Zero-GAN keeps its base model's features stable and consistent, offering an advantage over DrugGEN regarding drug-likeness. While PETrans modifies large models like GPT with a small dataset for drug design, Mol-Zero-GAN stands out because it doesn't need extra data for fine-tuning. Instead, it naturally preserves the base model's features, ensuring consistent drug-likeness without relying on additional datasets.
The comparison results of Mol-Zero-GAN with OptiMol, MoleGuLAR, DrugGEN, and PETrans reflect Mol-Zero-GAN's ability to preserve the base model characteristics, making it generate drug candidates with comparable or better BA and better QED and SA compared to the previous works.
5 Conclusion
This research presents Mol-Zero-GAN, a framework for optimizing a drug generation model to generate drugs with desired properties based on Bayesian optimization of model weight matrices' singular values. We demonstrate its ability to minimize the binding affinity while preserving other objectives of the base model without additional training data. Compared to the recent research results with similar purposes, all Mol-Zero-GAN's optimized models, based on a single or weighted sum objective, produced comparable or outperformed previous results. For future work, we plan to elaborate on the objective functions and reduce the time for BA evaluation.Conflicts of interest
There are no conflicts to declare.Acknowledgements
This work was fully supported by the Program Management Unit of Competitiveness (PMUC), Office of National Higher Education Science Research and Innovation Policy Council, Thailand, under contract number C10F640366. We want to thank Chulalongkorn University Technology Center (UTC) and Mahidol AI Center for facilitating the GPU infrastructure for our model development and testing.References
- M. H. Segler, T. Kogej, C. Tyrchan and M. P. Waller, ACS Cent. Sci., 2018, 4, 120–131 CrossRef CAS PubMed.
- R. van Deursen, P. Ertl, I. V. Tetko and G. Godin, J. Cheminf., 2020, 12, 1–14 Search PubMed.
- M. Skalic, D. Sabbadin, B. Sattarov, S. Sciabola and G. De Fabritiis, Mol. Pharmaceutics, 2019, 16, 4282–4291 CrossRef CAS PubMed.
- B. Samanta, A. De, G. Jana, V. Gómez, P. K. Chattaraj, N. Ganguly and M. Gomez-Rodriguez, Journal of Machine Learning Research, 2020, 21, 4556–4588 Search PubMed.
- J. Lim, S. Ryu, J. W. Kim and W. Y. Kim, J. Cheminf., 2018, 10, 1–9 Search PubMed.
- Q. Liu, M. Allamanis, M. Brockschmidt and A. Gaunt, Advances in neural information processing systems, 2018, vol. 31 Search PubMed.
- M. J. Kusner, B. Paige and J. M. Hernández-Lobato, International conference on machine learning, 2017, pp. 1945–1954 Search PubMed.
- R. Gómez-Bombarelli, J. N. Wei, D. Duvenaud, J. M. Hernández-Lobato, B. Sánchez-Lengeling, D. Sheberla, J. Aguilera-Iparraguirre, T. D. Hirzel, R. P. Adams and A. Aspuru-Guzik, ACS Cent. Sci., 2018, 4, 268–276 CrossRef PubMed.
- A. Kadurin, S. Nikolenko, K. Khrabrov, A. Aliper and A. Zhavoronkov, Mol. Pharmaceutics, 2017, 14, 3098–3104 CrossRef CAS.
- G. L. Guimaraes, B. Sanchez-Lengeling, C. Outeiral, P. L. C. Farias and A. Aspuru-Guzik, arXiv, 2017, preprint arXiv:1705.10843, DOI:10.48550/arXiv.1705.10843.
- B. Sanchez-Lengeling, C. Outeiral, G. Guimaraes and A. Aspuru-Guzik, ChemRxiv, 2017, preprint, DOI:10.26434/chemrxiv.5309668.v3.
- G.-B. R. W. J. Duvenaud and D. H.-L. J. Sánchez-Lengeling, Automatic chemical design using a data-driven continuous representation of molecules, ACS Cent. Sci., 2018, 4, 268 CrossRef.
- W. Jin, R. Barzilay and T. Jaakkola, International conference on machine learning, 2018, pp. 2323–2332 Search PubMed.
- H. Dai, Y. Tian, B. Dai, S. Skiena and L. Song, arXiv, 2018, preprint, arXiv:1802.08786, DOI:10.48550/arXiv.1802.08786.
- K. Korovina, S. Xu, K. Kandasamy, W. Neiswanger, B. Poczos, J. Schneider and E. Xing, International Conference on Artificial Intelligence and Statistics, 2020, pp. 3393–3403 Search PubMed.
- R. Winter, F. Montanari, A. Steffen, H. Briem, F. Noé and D.-A. Clevert, Chem. Sci., 2019, 10, 8016–8024 RSC.
- A. E. Blanchard, C. Stanley and D. Bhowmik, J. Cheminf., 2021, 13, 1–8 Search PubMed.
- J. Boitreaud, V. Mallet, C. Oliver and J. Waldispuhl, J. Chem. Inf. Model., 2020, 60, 5658–5666 CrossRef CAS PubMed.
- A. Ünlü, E. Çevrim, A. Sarıgün, H. Çelikbilek, H. A. Güvenilir, A. Koyaş, D. C. Kahraman, A. Rifaioğlu and A. Olğaç, arXiv, 2023, preprint, arXiv:2302.07868, DOI:10.48550/arXiv.2302.07868.
- D. Brookes, H. Park and J. Listgarten, International conference on machine learning, 2019, pp. 773–782 Search PubMed.
- T. Blaschke, J. Arús-Pous, H. Chen, C. Margreitter, C. Tyrchan, O. Engkvist, K. Papadopoulos and A. Patronov, J. Chem. Inf. Model., 2020, 60, 5918–5922 CrossRef CAS.
- M. Goel, S. Raghunathan, S. Laghuvarapu and U. D. Priyakumar, J. Chem. Inf. Model., 2021, 61, 5815–5826 CrossRef CAS PubMed.
- B. Banar and S. Colton, International Conference on Computational Intelligence in Music, Sound, Art and Design (Part of EvoStar), 2022, pp. 19–35 Search PubMed.
- OpenAI, GPT-4 Technical Report, 2023 Search PubMed.
- S. Wu, O. Irsoy, S. Lu, V. Dabravolski, M. Dredze, S. Gehrmann, P. Kambadur, D. Rosenberg and G. Mann, BloombergGPT: A Large Language Model for Finance, 2023 Search PubMed.
- J.-S. Lee and J. Hsiang, World Pat. Inf., 2020, 62, 101983 CrossRef.
- N. Alexandr, O. Irina, K. Tatyana, K. Inessa and P. Arina, Data Science and Intelligent Systems: Proceedings of 5th Computational Methods in Systems and Software 2021, 2021, vol. 2, pp. 748–757 Search PubMed.
- X. Wang, C. Gao, P. Han, X. Li, W. Chen, A. Rodríguez Patón, S. Wang and P. Zheng, Int. J. Mol. Sci., 2023, 24, 1146 CrossRef CAS PubMed.
- E. Robb, W.-S. Chu, A. Kumar and J.-B. Huang, arXiv, 2020, preprint, arXiv:2010.11943, DOI:10.48550/arXiv.2010.11943.
- T. Karras, S. Laine, M. Aittala, J. Hellsten, J. Lehtinen and T. Aila, Proceedings of the IEEE/CVF conference on computer vision and pattern recognition, 2020, pp. 8110–8119 Search PubMed.
- O. Prykhodko, S. V. Johansson, P.-C. Kotsias, J. Arús-Pous, E. J. Bjerrum, O. Engkvist and H. Chen, J. Cheminf., 2019, 11, 1–13 Search PubMed.
- D. Polykovskiy, A. Zhebrak, B. Sanchez-Lengeling, S. Golovanov, O. Tatanov, S. Belyaev, R. Kurbanov, A. Artamonov, V. Aladinskiy and M. Veselov, et al., Front. Pharmacol., 2020, 11, 565644 CrossRef CAS PubMed.
- N. Stander and K. Craig, Engineering Computations, 2002, 19, 431–450 CrossRef.
- T. L. Lai and H. Robbins, et al., Adv. Appl. Math., 1985, 6, 4–22 CrossRef.
- M. M. Mysinger, M. Carchia, J. J. Irwin and B. K. Shoichet, J. Med. Chem., 2012, 55, 6582–6594 CrossRef CAS.
- H. M. Berman, J. Westbrook, Z. Feng, G. Gilliland, T. N. Bhat, H. Weissig, I. N. Shindyalov and P. E. Bourne, Nucleic Acids Res., 2000, 28, 235–242 CrossRef CAS PubMed.
- Z. Shen, Y.-H. Yan, S. Yang, S. Zhu, Y. Yuan, Z. Qiu, H. Jia, R. Wang, G.-B. Li and H. Li, Eur. J. Med. Chem., 2021, 225, 113772 CrossRef CAS PubMed.
- G. Landrum, et al., RDKit: a software suite for cheminformatics, computational chemistry, and predictive modeling, 2013 Search PubMed.
- G. M. Morris, R. Huey, W. Lindstrom, M. F. Sanner, R. K. Belew, D. S. Goodsell and A. J. Olson, J. Comput. Chem., 2009, 30, 2785–2791 CrossRef CAS.
- O. Trott and A. J. Olson, J. Comput. Chem., 2010, 31, 455–461 CrossRef CAS PubMed.
- N. M. Hassan, A. A. Alhossary, Y. Mu and C.-K. Kwoh, Sci. Rep., 2017, 7, 15451 CrossRef PubMed.
- A. Paszke, S. Gross, F. Massa, A. Lerer, J. Bradbury, G. Chanan, T. Killeen, Z. Lin, N. Gimelshein, L. Antiga, A. Desmaison, A. Kopf, E. Yang, Z. DeVito, M. Raison, A. Tejani, S. Chilamkurthy, B. Steiner, L. Fang, J. Bai and S. Chintala, Advances in Neural Information Processing Systems 32, Curran Associates, Inc., 2019, pp. 8024–8035 Search PubMed.
- F. Nogueira, et al., Bayesian Optimization: open source constrained global optimization tool for Python, 2014, accessed: 5 Nov 2023 Search PubMed.
- D. Santos-Martins, L. Solis-Vasquez, A. F. Tillack, M. F. Sanner, A. Koch and S. Forli, J. Chem. Theory Comput., 2021, 17, 1060–1073 CrossRef CAS PubMed.
Footnote |
| † Electronic supplementary information (ESI) available. See DOI: https://doi.org/10.1039/d3ra03954d |
| This journal is © The Royal Society of Chemistry 2023 |


