 Open Access Article
Uniform titania-supported Ce(III) carbonate cluster catalysts for degradation of reactive oxygen species†
Ram Kumar a,
V. Venardia,
Y. Helala,
Chengyu Songb and
Alexander Katz
 *a
*a
aDepartment of Chemical and Biomolecular Engineering, University of California, Berkeley, California 94720-1462, USA. E-mail: askatz@berkeley.edu
bNational Center for Electron Microscopy, Molecular Foundry, Lawrence Berkeley National Laboratory, Berkeley, California 94720, USA
First published on 31st July 2023
Abstract
We report the synthesis of uniform 2.5 ± 0.4 nm diameter Ce(III) carbonate clusters deposited on the surface of TiO2 nanoparticles and characterize them using HAADF-STEM and EELS, as well as UV-Vis and FTIR spectroscopies. This material is a highly proficient catalytic antioxidant for the degradation of photocatalytically generated reactive oxygen species (ROS). We observed an unusual U-shaped pH-dependence in its photoprotection catalytic activity, with an optimum function in the near-neutral pH range of 7.7 ± 0.7. This sharp pH dependence is not observed in previously reported bulk Ce(III) carbonate materials, and it is also not a consequence of Ce(III) carbonate cluster decomposition. However, it is consistent with a tandem reaction sequence consisting of a biomimetic superoxide dismutase and catalase function, which is dependent on a balance of protons and hydroxide anions for function. Our dissolution–deposition approach for synthesizing nanoscale Ce(III) carbonate clusters on TiO2 should be generalizable to other carbonates and metal-oxide supports.
Introduction
Although TiO2 is extensively utilized as the primary white pigment of choice in paints and coatings and as an approved mineral sun protection factor (SPF) active in cosmetics and suncare products, its high degree of photoactivity catalyzes the generation of reactive oxygen species (ROS).1–3 These ROS such as hydroxyl radicals (HO˙), superoxide anions (O2˙−) and hydrogen peroxide (H2O2) are synthesized when TiO2 is exposed to light in the presence of H2O and O2, and degrade organic molecules as a result of their highly oxidizing nature.1,4 This degradation is highly undesired because it has been associated with several human pathologies.5 It is also detrimental to natural ecosystems and degrades the performance of protective materials due to oxidation.6–9 As a result of its high photoactivity, TiO2 is typically surface passivated with high bandgap metal oxides such as aluminosilicates.10 However, significant leakage still occurs, and there is thus an ongoing need for antioxidants that remain uncolored and degrade ROS in all areas that use TiO2, including paints and coatings as well as personal-care products.10 Although organic antioxidants such as vitamins E and C and green-tea leaf extract are readily available, these function stoichiometrically rather than catalytically, giving them generally lower effectiveness against ROS.11,12 In biological systems, tandem catalysts relying on enzyme cascades of superoxide dismutase (SOD) and catalase decompose ROS to hydrogen peroxide (SOD) and subsequently to H2O and O2 (catalase). However, these enzymes are impractical due to their fragility (e.g., temperature and non-natural organic-additive constraints) and cost.13Recently, we demonstrated highly active tandem photoprotection catalysts based on a combination of Ce(III) carbonate and TiO2.14 In our approach, Ce(III) carbonate takes on the role of a SOD mimic, whereas TiO2 functions as a catalase mimic. The SOD activity of Ce(III) carbonate is related to the function of small cerium-oxide nanoparticles in the literature, which are surface-enriched in Ce(III) rather than Ce(IV).15–17 Based on XPS and catalysis evidence, we demonstrated this pair as a robust tandem catalytic antioxidant, which consumes ROS before they oxidatively degrade organic molecules, such as methylene blue in aqueous solution, at a higher rate and turnover number compared to other antioxidant systems, including hindered-amine light stabilizers, and commercially-available cerium-oxide nanoparticles.
Previously, when using Ce(III) carbonate and TiO2 as tandem catalytic antioxidants, both of these insoluble solids were dispersed in aqueous suspension as separate particles.14 In that configuration, the ROS generation and catalase-mimetic functions of TiO2 are spatially segregated from the SOD mimetic function of the Ce(III) carbonate. We posited that if instead the Ce(III) carbonate and TiO2 could be synthesized with close spatial proximity, the resulting tandem catalysts could potentially function with higher efficiency. This could in principle be due to the proximity of the ROS photosynthesis source (i.e. TiO2) and ROS degradation catalyst (i.e. Ce(III) carbonate) overcoming any mass transport limitations, as well as the possibility of favorable support interactions that enhance Ce(III) carbonate ROS degradation catalysis. To address this, here, in this manuscript, we describe a materials synthesis strategy that localizes Ce(III) carbonate clusters on a TiO2 surface. Although small cerium oxide clusters have been deposited on the surface of oxide colloids previously and mixed potassium carbonate/metal oxide phases are known,18–27 to the best of our knowledge, our work represents the first time uniform Ce(III) carbonate clusters with a uniform ≈2.5 nm size have been deposited on TiO2 rather than cerium oxide or hydroxide. Such materials may prove useful in areas where high Ce(III) concentrations on oxide supports are desired, as when atomically dispersing noble metals on such supports.18
We used a Mg–Ce mixed carbonate as a precursor material for synthesis of Ce(III) carbonate dispersed on the surface of TiO2. Our approach leverages on the water solubility of Mg carbonate to partially dissolve the magnesium carbonate component of the mixed carbonate selectively, in the presence of a TiO2 oxide support material. Our results demonstrate that during this partial dissolution process, there is a reassembly and deposition of Ce(III) carbonate from the mixed carbonate material onto the TiO2 oxide surface, as shown schematically in Fig. 1. We characterize the resulting Ce(III) carbonate deposited on TiO2 phase using HAADF (high-angle annular dark field)-STEM (scanning transmission electron microscopy) and EELS (electron energy loss spectroscopy), which characterizes the Ce(III) valence state of the deposited material on TiO2, and also perform FTIR spectroscopy to support the incorporation of carbonate ligands. We demonstrate that our Ce(III) carbonate clusters supported on TiO2 are a highly proficient catalytic antioxidant, exceeding the activity of our previously reported tandem catalyst, when the cerium carbonate and TiO2 phases were dispersed as separate particles. In addition, we perform a pH study of photoprotection catalysis with this class of materials, which demonstrates a high degree of pH sensitivity, and exhibits an optimum pH of 7.7 ± 0.7 for photoprotection catalysis function. The presence of such a pH optimum further reinforces the dual SOD and catalase biomimetic functions performed in the degradation of the photogenerated ROS.
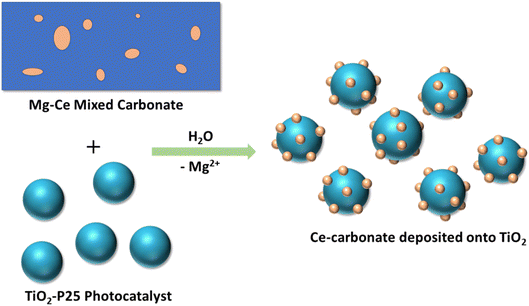 | ||
| Fig. 1 Schematic representation of the synthesis of Ce-carbonate deposited onto TiO2 (P25) nanoparticles via the dissolution of Mg–Ce mixed carbonate precursor and deposition on TiO2 surface. | ||
Results and discussion
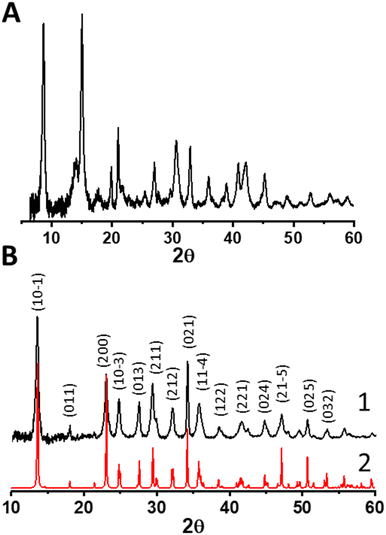
Our approach begins with the synthesis of a relevant control material for understanding the synthesis of the magnesium–cerium mixed carbonate – a pure magnesium-carbonate – based on our previously reported synthesis of a pure-phase Ce2(CO3)3·8H2O. We thus added (NH4)2CO3 to an aqueous solution of MgNO3·6H2O, and observed ongoing precipitation during the course of the first hour, at a pH of around 9. After stirring this mixture for a total of 25 h, we recovered the solids by repeated (three times) centrifugation, vortex mixing, sonication, and washing with deionized water. The magnesium carbonate isolated in this fashion exhibited the powder X-ray diffraction (PXRD) pattern shown in Fig. 2a. This pattern was matched to a complex mixture of phases according to the ICDD database, which primarily consists of magnesite MgCO3, hydromagnesite Mg5(CO3)4(OH)2·4H2O and nesquehonite (see Fig. S1, ESI†).When substituting pure MgNO3·6H2O in the synthesis described above with a mixture of 27 MgNO3·6H2O![[thin space (1/6-em)]](https://www.rsc.org/images/entities/char_2009.gif) :
:![[thin space (1/6-em)]](https://www.rsc.org/images/entities/char_2009.gif) 1 CeNO3·6H2O (molar) (i.e., concentration of Mg in the magnesium-carbonate synthesis was identical to the combined molar concentration of Mg and Ce in the mixed carbonate synthesis), we obtained a solid precipitate exhibiting the PXRD pattern shown in Fig. 2b. This pattern was matched to a known pure phase of nesquehonite crystallizing in a monoclinic (P21/n) structure (ICSD-2758), with lattice parameters a = 7.7, b = 5.36 and c = 12.12 Å, respectively (corresponding to a molecular formula of MgCO3·3H2O for a pure magnesium carbonate). We conclude that even this relatively small amount of Ce(III) in the synthesis (i.e. 3.7 mol% Ce(III) relative to Mg(II) in the binary mixture) results in a much simpler, single-phase material compared to a pure Mg(II) carbonate synthesis, for which a complex mixture of phases was observed above. Based on the propensity for Ce(III) to form carbonates,28 and previously described mixed metal carbonates involving divalent and trivalent cations,29 we posit that the minor Ce component substitutes into the Mg carbonate resulting in a Mg–Ce mixed carbonate material. ICP-AES data (of the material dried at 60 °C) confirm the incorporation of cerium in this material, with a final Mg to Ce molar ratio of 12 (see Table S1, ESI†), which demonstrates Ce enrichment in the final material relative to the synthesis-mixture composition.
1 CeNO3·6H2O (molar) (i.e., concentration of Mg in the magnesium-carbonate synthesis was identical to the combined molar concentration of Mg and Ce in the mixed carbonate synthesis), we obtained a solid precipitate exhibiting the PXRD pattern shown in Fig. 2b. This pattern was matched to a known pure phase of nesquehonite crystallizing in a monoclinic (P21/n) structure (ICSD-2758), with lattice parameters a = 7.7, b = 5.36 and c = 12.12 Å, respectively (corresponding to a molecular formula of MgCO3·3H2O for a pure magnesium carbonate). We conclude that even this relatively small amount of Ce(III) in the synthesis (i.e. 3.7 mol% Ce(III) relative to Mg(II) in the binary mixture) results in a much simpler, single-phase material compared to a pure Mg(II) carbonate synthesis, for which a complex mixture of phases was observed above. Based on the propensity for Ce(III) to form carbonates,28 and previously described mixed metal carbonates involving divalent and trivalent cations,29 we posit that the minor Ce component substitutes into the Mg carbonate resulting in a Mg–Ce mixed carbonate material. ICP-AES data (of the material dried at 60 °C) confirm the incorporation of cerium in this material, with a final Mg to Ce molar ratio of 12 (see Table S1, ESI†), which demonstrates Ce enrichment in the final material relative to the synthesis-mixture composition.
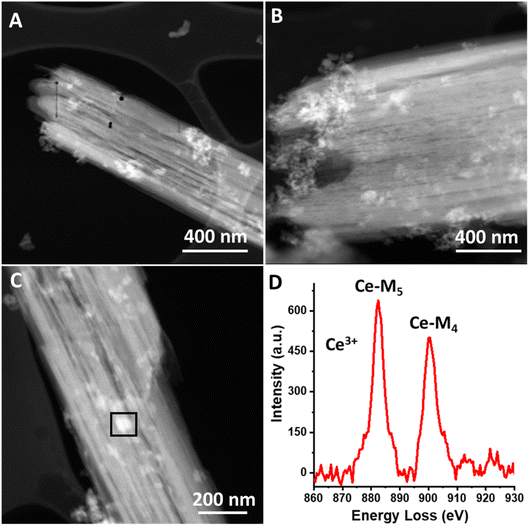
We further characterize the magnesium–cerium mixed carbonate material using HAADF-STEM imaging, and these data are shown in Fig. 3a–c. The images demonstrate high contrast portions, which we attribute to Ce-rich domains, since contrast scales as a positive order of the atomic number (approximately proportional to atomic number squared).30,31
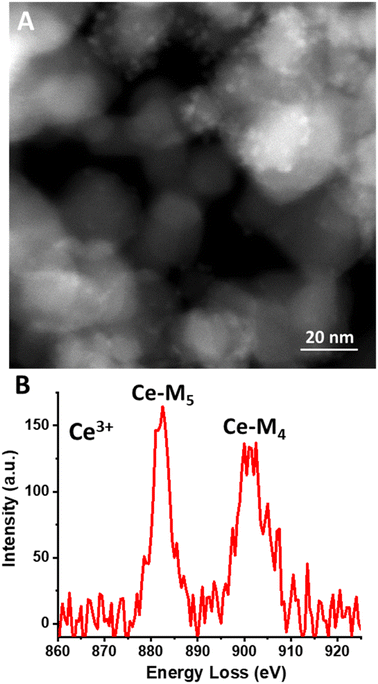
The observed heterogeneity in the size of the Ce-rich domains is testament to the lack of long-range order in the mixed carbonate material. These domains appear to be heterogeneous in terms of their size, ranging from 5 nm to 75 nm (see Fig. S2, ESI†). We infer that this lack of long-range order is facilitated by the different diameters of the Mg and Ce cations.29 Based on the similarity of our synthesis conditions to those that we have previously used to synthesize Ce(III) carbonate as well as the known stabilization of the Ce(III) valence state by carbonate ligands, these Ce-rich domains are hypothesized to consist of Ce(III) carbonate, which is highly insoluble in water.14,32 We characterized the mixed carbonate material using ATR-FTIR spectroscopy. We observe a broad band centered around 1400 cm−1, with full width at half max of more than 75 cm−1, which reflects the heterogeneity in the mixed carbonate material (see Fig. S3, ESI†). This frequency range coincides with previously reported bands in carbonate materials.14,33 In addition, we characterized the cerium-rich domains of the material using electron energy loss spectroscopy (EELS). EELS data in Fig. 3d demonstrate a Ce M4/M5 ratio of ≈0.78. Such a M4/M5 ratio supports a Ce(III) oxidation state, as expected for a carbonate.34–36 Due to beam damage, the value of this ratio increased upon dwelling, presumably due to the known beam fragility of carbonates and formation of Ce(IV) oxide species as a result of damage under the beam.13 Given the prevalence of a carbonate matrix in the material imaged in Fig. 3 (see also Fig. S2, ESI†), we conclude that the Ce-rich domains in Fig. 3 represent Ce(III) carbonate.
Next, we used the magnesium–cerium mixed carbonate as a precursor to deposit cerium carbonate onto the oxide surface of TiO2. This was accomplished by a dissolution–deposition approach schematically shown in Fig. 1, which leverages the water solubility of magnesium carbonate. When the magnesium–cerium mixed carbonate was suspended in an excess of water (1 mg of Mg–Ce mixed carbonate in 100 mL of water containing 2 mg of dispersed TiO2), the magnesium-carbonate domains in the mixed carbonate material dissolved, leaving the insoluble Ce(III) carbonate nanoscale domains shown in Fig. 3 behind. These domains reassembled and deposited as Ce(III) carbonate clusters on the TiO2 surface. The resulting material consisting of these Ce(III) carbonate clusters on TiO2 was a brilliant-white coloration (see Fig. S4, ESI†). This makes the formation of cerium oxide during the reassembly and deposition process unlikely, since, had this occurred, it would have resulted in a material with the characteristic yellowish tint of Ce(IV) oxide.
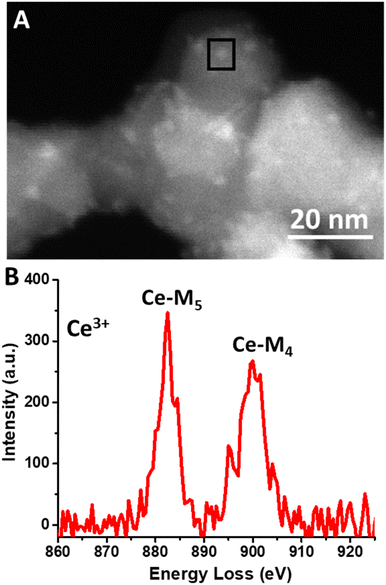
HAADF-STEM images of the Ce(III) carbonate clusters on the surface of TiO2 are shown in Fig. 4 (see also Fig. S5, ESI†), which result from the dissolution–deposition approach described in Fig. 1. We observe these clusters to have a size of 2.5 ± 0.4 nm (Fig. 4d). We also characterized these TiO2-supported clusters (and compared with the TiO2 support alone) using ATR-FTIR spectroscopy (see Fig. S6 and S7, ESI†). This material contains coordinated carbonate bands at 1373 cm−1, 1437 cm−1, and 1480 cm−1, with the latter representing monodentate carbonate, which is absent in the spectrum of the TiO2 support alone.14,33 EELS data shown in Fig. 5b demonstrate a Ce M4/M5 ratio of 0.77 for the Ce carbonate clusters deposited on TiO2, which are representative across eight independent sample regions investigated. Based on these EELS data, we confirm the Ce(III) valence state when immobilized on the TiO2 surface.34–36 We note in passing that our EELS data in Fig. 5 cannot be a result of beam damage, because prolonged exposure of the sample in Fig. 5 to the electron beam during EELS acquisition results in enrichment of the Ce(IV) oxidation state (vide supra; see Fig. S8, ESI†). Altogether, our data above lead us to conclude that we deposited Ce(III) carbonate clusters on the TiO2 surface, from the precursor material shown in Fig. 2 and 3.14,33–36
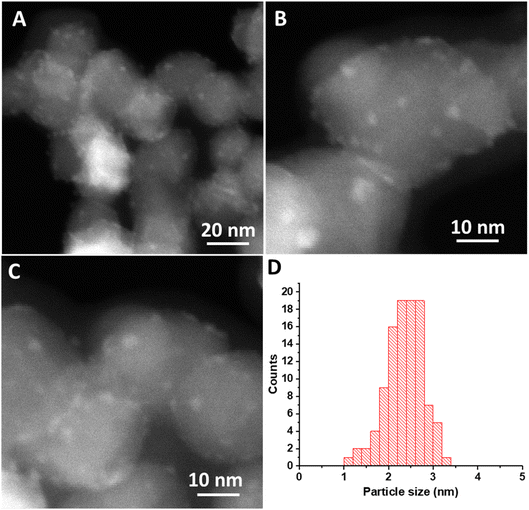 | ||
| Fig. 4 (A–C) HAADF-STEM images of Ce-carbonate deposited onto TiO2. (D) Particle size distribution of Ce-carbonate deposited onto TiO2. | ||
Given the unit-cell dimensions for cerium carbonate,37 we surmise that the deposited clusters are about two unit-cell layers thick. Under this scenario, one of these is interacting with the support, whereas the other is an overlayer on top. When performing electron microscopy, we observed no freestanding Ce-containing clusters anywhere across the TEM grid. That is to say, all of the Ce(III) carbonate clusters that we imaged were deposited on the TiO2 surface. The uniformity of the size distribution of the deposited Ce-containing clusters was quite unexpected, given the strong heterogeneity of Ce(III) carbonate domains observed in the magnesium–cerium mixed carbonate precursor material, shown in Fig. 3, which, as mentioned above, range up to 75 nm in size (vide supra). This uniformity suggests that a reassembly of Ce(III) domains in the mixed-carbonate precursor must have occurred during the deposition process, which was conducted at a pH of 7.8, as buffered by the dissolved ionic magnesium carbonate species in solution. At this pH, both the TiO2 and Ce(III) carbonate are expected to have a negative surface charge,38 and so it is not immediately apparent how the deposition occurred in a manner that would be driven by electrostatics. This can be at least partially reconciled based on anionic exchange sites in between layers, in previously reported hydrotalcite materials related to our mixed Mg–Ce carbonate (in terms of having divalent and trivalent metal-carbonate components). We thus posit an electrostatic attraction and proximity between the negatively charged TiO2 (P25) nanoparticles and our precursor material during the dissolution–precipitation process of Fig. 1, which ultimately results in synthesis of uniform Ce(III) carbonate clusters on the TiO2 surface.39 We further posit that lattice mismatch between the Ce(III) carbonate and underlying TiO2 support may control the size of the observed 2.5 nm islands based on previously described materials in which heteroepitaxial growth has been invoked to result in the deposition of nanoscale islands on oxide surfaces.40
Based on the established catalytic role of Ce(III) carbonate and TiO2 as tandem catalysts for decomposition of photogenerated reactive oxygen species,14 we were motivated to investigate the TiO2-deposited Ce(III) carbonate nanoparticles as photoprotection catalysts, in order to understand the effect of intimacy between the two components of the tandem catalyst. Previously, our photoprotection catalysis experimental approach involved dispersing 1 mg of Ce(III) carbonate and 2 mg TiO2 (as separate particles) in 100 mL of aqueous methylene-blue (MB) dye solution (10−5 M concentration).14 We leverage the same procedure here, except before adding dye at the end (as a 1 mL aliquot), we first added 1 mg of mixed Mg–Ce carbonate to 99 mL of deionized water containing suspended 2 mg of TiO2, as per Fig. 1, to synthesize Ce(III) carbonate nanodomains on the TiO2 surface, which occurs at a pH of 7.8 (vide supra). The first-order rate constant for MB dye photodegradation was measured at this pH to be 3.8 × 10⁻³ min−1.
This can be compared with an experiment using our previously published Ce(III) carbonate (predried at 60 °C just like the magnesium–cerium mixed carbonate prior to use); however, in those experiments, the amount of cerium content in the MB photocatalysis experiments was 6.6-fold higher compared with what we used above for the magnesium–cerium mixed carbonate (owing to the fact that 1 mg of the pure Ce(III) carbonate was used previously). To equalize the Ce content, we performed a dilute photocatalysis experiment employing 0.15 mg of cerium carbonate and 2 mg of TiO2. We measured the rate constant for dye degradation under these conditions to be 11 × 10−3 min−1 (see Fig. S15, ESI†). This rate constant for MB dye photodegradation is approximately 7-fold higher compared to our previously reported rate constant, when using a full 1 mg of Ce(III) carbonate in the photoreactor. We conclude that the rate constant for dye photodegradation is inversely proportional to the amount of Ce(III) carbonate in the photoreactor, in this range of catalyst amounts. Comparing the rate constants for the dilute Ce(III) carbonate and our current TiO2-deposited Ce(III)-carbonate photocatalysis experiments (which are matched to now have the same amount of Ce), we observe a 2.9-fold lower rate constant for the one measured with TiO2-deposited Ce(III) carbonate. We ascribe the slightly higher efficiency of Ce utilization in the TiO2-deposited Ce(III) carbonate compared to our previously reported, unsupported cerium carbonate to be the result of either favorable support interactions or mass-transport limitations in the reaction of ROS with Ce. In the case of the latter, we surmise that proximity between the ROS generator (TiO2) and SOD-mimetic ROS-degradation catalyst (Ce(III) carbonate) increases ROS degradation rates by virtue of the shorter characteristic distance for ROS to diffuse, when Ce(III) carbonate is deposited on the same TiO2 surface as where ROS generation is occurring.
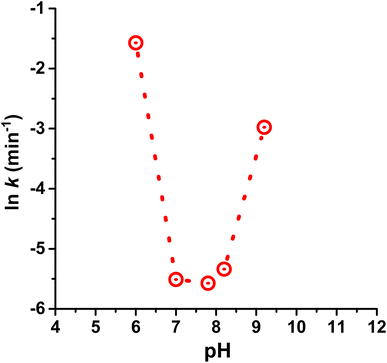
Before adding dye, we carefully removed the soluble Mg-carbonate-containing water solution (pH 7.8; vide supra) from the TiO2-deposited Ce(III) carbonate, using centrifugation. We replaced this water with solutions of controlled pH, which were either made alkaline by using dilute sodium carbonate or sodium hydroxide solutions (achieved the same results with both), or made acidic by using atmospheric CO2-equilibrated water at pH of 6.0. This allowed us to investigate the effect of pH on photoprotection catalysis, when using our TiO2-deposited Ce(III) carbonate. Our results are summarized in Table 1, and are graphically represented in Fig. 6. We observe a sharp U-shaped dependence of the rate constant for dye photodegradation on pH, with a minimum (i.e., best performance) that encompasses the pH window of 7.0 to 8.2. At or below a pH of 6.0 on the acidic side, and at or above a pH of 9.0 on the alkaline side, the catalytic photoprotection ability decreases sharply. As a control, when using the same dye in the presence of TiO2 photocatalyst (i.e. in the absence of Ce(III) carbonate), a slight monotonic increase in the rate constant (less than a factor of 2) is observed in the 6–10 pH range, which is ascribed to increased cationic dye adsorption on the negatively charged TiO2 surface and the surface-catalyzed nature of the photodegradation.41–43 These mild monotonic increases cannot explain our U-shaped pH dependence, which spans more than an order of magnitude in rate constant. Based on these data, we conclude that the TiO2-deposited Ce(III) carbonate is much more sensitive to acidic conditions compared with the larger bulk Ce carbonates reported previously, which function just as well at pH of 6.0.14
| No. | pH | Rate constant k, (min−1) |
|---|---|---|
| 1 | 6 | 20.8 × 10⁻² ± 1.3 × 10⁻² |
| 2 | 7 | 4.04 × 10⁻³ ± 4.2 × 10⁻⁴ |
| 3 | 7.8 | 3.8 × 10⁻³ ± 2.5 × 10⁻⁴ |
| 4 | 8.2 | 4.8 × 10⁻³ ± 5.4 × 10⁻⁴ |
| 5 | 9.2 | 5.1 × 10⁻² ± 1 × 10⁻³ |
Because Ce(III) carbonate (as do carbonates in general) decomposes under highly acidic conditions to yield soluble Ce(III) ions, we investigated whether the decrease in photoprotection ability at pH 6.0 is due to dissolution of the Ce(III) carbonate catalyst, versus being intrinsically linked to the kinetics of the reaction. Data in Fig. 7 represent HAADF-STEM images of Ce(III) carbonate deposited onto TiO2 after extensive washing, vortex mixing, and sonication with a pH 6.0 solution. We observe the same amount of Ce(III) carbonate clusters in this sample (uncertainty of ±15%) as in the samples recovered at pH 7.8, shown in Fig. 4. These data are inconsistent with dissolution of cerium carbonate clusters at pH 6.0, and are further supported by previously measured solubility data of cerium carbonate as a function of pH, which show that dissolution occurs under more acidic conditions.32 We conclude that the sharp U-shaped profile in Fig. 6 is kinetics controlled, rather than due to any Ce(III) carbonate dissolution phenomenon. In rationalizing these data, we refer back to the SOD and catalase mimetic mechanisms by which Ce carbonate degrades reactive oxygen species, which are dependent on the availability of protons and hydroxide in solution.14,44 Thus, the U-shaped pH dependence of the observed rate constant in Fig. 6 is consistent with the previously invoked tandem SOD-catalase catalytic mechanism for the Ce(III) carbonate deposited onto TiO2.14 According to our data, there is an optimum pH range of 7.7 ± 0.7, which represents a compromise where the SOD and catalase functions working together are most effective in the catalytic cycle of ROS degradation and photoprotection, when using Ce(III) carbonate deposited on TiO2 as a catalytic antioxidant.
Conclusions
In conclusion, we demonstrate a synthetic approach for depositing uniform 2.5 nm Ce(III) carbonate clusters onto the surface of TiO2, which, to the best of our knowledge, are the first materials described that consist of nanoscale Ce(III) carbonate clusters on an oxide support. We believe our dissolution–deposition approach to be generalizable to other supports and carbonates. Our TiO2-deposited Ce(III) carbonate exhibits a sharp pH dependence in catalytic antioxidant activity, with an optimum function in the near-neutral pH range of 7.7 ± 0.7. The existence of this sharp optimum is consistent with the previously reported SOD-catalase bifunctional nature of antioxidant ROS degradation catalysis, which are dependent on both protons and hydroxide in solution. The catalytic antioxidant function of these nanoparticles provides an effective approach for mitigating the deleterious consequences of ROS production on the TiO2 surface.Conflicts of interest
Authors declare no conflict of interest.Acknowledgements
All experiments in this manuscript and RK's postdoctoral fellowship were supported by Office of Science, Office of Basic Energy Sciences, of the U.S. Department of Energy (DOE) under contract no. DE-FG02-05ER15696. Advanced electron microscopy at the Molecular Foundry was supported by Office of Basic Energy Sciences of the DOE under contract no. DE-AC02-05CH11231. RK gratefully acknowledges a Ramanujan Faculty Fellowship-RJF/2022/000007 from Science and Engineering Research Board-Govt. of India, which was used to write, review and complete the manuscript in 2023.References
- Y. Nosaka and A. Y. Nosaka, Chem. Rev., 2017, 117, 11302–11336 CrossRef CAS PubMed
.
- J. Liu, G. Dong, J. Jing, S. Zhang, Y. Huang and W. Ho, Environ. Sci.: Nano, 2021, 8, 3846–3854 RSC
.
- F. P. Gasparro, M. Mitchnick and J. F. Nash, Photochem. Photobiol., 1998, 68, 243–256 CrossRef CAS PubMed
.
- Q. Lin, R. H. J. Xu Xu, N. Yang, A. A. Karim, X. J. Loh and K. Zhang, ACS Appl. Nano Mater., 2019, 2, 7604–7616 CrossRef CAS
.
- L. R. Arslanbaeva and M. M. Santoro, Redox Biol., 2020, 37, 101753 CrossRef CAS PubMed
.
- R. K. Shukla, V. Sharma, A. K. Pandey, S. Singh, S. Sultana and A. Dhawan, Toxicol. in Vitro, 2011, 25, 231–241 CrossRef CAS
.
- Y. H. Leung, X. Xu, A. P. Y. Ma, F. Liu, A. M. C. Ng, Z. Shen, L. A. Gethings, M. Y. Guo, A. B. Djurišić, P. K. H. Lee, H. K. Lee, W. K. Chan and F. C. C. Leung, Sci. Rep., 2016, 6, 35243 CrossRef CAS PubMed
.
- J. Shang, M. Chai and Y. Zhu, Environ. Sci. Technol., 2003, 37, 4494–4499 CrossRef CAS
.
- T. Schmitt, F. Rosi, E. Mosconi, K. Shull, S. Fantacci, C. Miliani and K. Gray, Heritage Sci., 2022, 10, 99 CrossRef CAS
.
- B. A. van Driel, P. J. Kooyman, K. J. van den Berg, A. Schmidt-Ott and J. Dik, Microchem. J., 2016, 126, 162–171 CrossRef CAS
.
- S. K. Katiyar and H. Mukhtar, J. Leukocyte Biol., 2001, 69, 719–726 CrossRef CAS
.
- I. R. Record, I. E. Dreosti, M. Konstantinopoulos and R. A. Buckley, Nutr. Cancer, 1991, 16, 219–225 CrossRef CAS
.
- W. C. Orr and R. S. Sohal, Science, 1994, 263, 1128–1130 CrossRef CAS PubMed
.
- M. K. Mishra, J. F. Callejas, M. L. Pacholski, J. Ciston, A. Okrut, R. Kumar, A. Van Dyk, D. G. Barton, J. C. Bohling and A. Katz, ACS Appl. Nano Mater., 2021, 4, 11590–11600 CrossRef CAS
.
- V. Baldim, F. Bedioui, N. Mignet, I. Margaill and J.-F. Berret, Nanoscale, 2018, 10, 6971–6980 RSC
.
- D. Mitra, X. Luo, A. Morgan, J. Wang, M. P. Hoang, J. Lo, C. R. Guerrero, J. K. Lennerz, M. C. Mihm, J. A. Wargo, K. C. Robinson, S. P. Devi, J. C. Vanover, J. A. D'Orazio, M. McMahon, M. W. Bosenberg, K. M. Haigis, D. A. Haber, Y. Wang and D. E. Fisher, Nature, 2012, 491, 449–453 CrossRef CAS PubMed
.
- J. D'Orazio, S. Jarrett, A. Amaro-Ortiz and T. Scott, Int. J. Mol. Sci., 2013, 14, 12222–12248 CrossRef
.
- X. Li, X. I. Pereira-Hernández, Y. Chen, J. Xu, J. Zhao, C.-W. Pao, C.-Y. Fang, J. Zeng, Y. Wang, B. C. Gates and J. Liu, Nature, 2022, 611, 284–288 CrossRef CAS PubMed
.
- A. C. Johnston-Peck, S. D. Senanayake, J. J. Plata, S. Kundu, W. Xu, L. Barrio, J. Graciani, J. F. Sanz, R. M. Navarro, J. L. G. Fierro, E. A. Stach and J. A. Rodriguez, J. Phys. Chem. C, 2013, 117, 14463–14471 CrossRef CAS
.
- R. Si, J. Tao, J. Evans, J. B. Park, L. Barrio, J. C. Hanson, Y. Zhu, J. Hrbek and J. A. Rodriguez, J. Phys. Chem. C, 2012, 116, 23547–23555 CrossRef CAS
.
- A. Bruix, J. A. Rodriguez, P. J. Ramírez, S. D. Senanayake, J. Evans, J. B. Park, D. Stacchiola, P. Liu, J. Hrbek and F. Illas, J. Am. Chem. Soc., 2012, 134, 8968–8974 CrossRef CAS PubMed
.
- X.-M. Lai, Q. Xiao, C. Ma, W.-W. Wang and C.-J. Jia, ACS Appl. Mater. Interfaces, 2022, 14, 8575–8586 CrossRef CAS PubMed
.
- J. Graciani, K. Mudiyanselage, F. Xu, A. E. Baber, J. Evans, S. D. Senanayake, D. J. Stacchiola, P. Liu, J. Hrbek, J. F. Sanz and J. A. Rodriguez, Science, 2014, 345, 546–550 CrossRef CAS PubMed
.
- J. A. Rodriguez, R. Si, J. Evans, W. Xu, J. C. Hanson, J. Tao and Y. Zhu, Catal. Today, 2015, 240, 229–235 CrossRef CAS
.
- X. Wang, Y. Jin and X. Liang, Nanotechnology, 2017, 28, 505709 CrossRef
.
- G. Dong, J. Wang, Y. Gao and S. Chen, Catal. Lett., 1999, 58, 37–41 CrossRef CAS
.
- Y.-K. Kim, L. Hao, J.-I. Park, J. Miyawaki, I. Mochida and S.-H. Yoon, Fuel, 2012, 94, 516–522 CrossRef CAS
.
- A. M. Szucs, M. Maddin, D. Brien, R. Rateau and J. D. Rodriguez-Blanco, RSC Adv., 2023, 13, 6919–6935 RSC
.
- M. Bellotto, B. Rebours, O. Clause, J. Lynch, D. Bazin and E. Elkaïm, J. Phys. Chem., 1996, 100, 8527–8534 CrossRef CAS
.
- P. D. Nellist and S. J. Pennycook, Adv. Imaging Electron Phys., 2000, 113, 147–203 Search PubMed
.
- T. Walther, Y. Qiu and A. G. Cullis, J. Phys.: Conf. Ser., 2010, 241, 012068 CrossRef
.
- I. Al-Nafai and K. Osseo-Asare, Miner. Process. Extr. Metall., 2022, 131, 34–43 CAS
.
- J. R. Bargar, J. D. Kubicki, R. Reitmeyer and J. A. Davis, Geochim. Cosmochim. Acta, 2005, 69, 1527–1542 CrossRef CAS
.
- J. A. Fortner and E. C. Buck, Appl. Phys. Lett., 1996, 68, 3817–3819 CrossRef CAS
.
- L. A. J. Garvie and P. R. Buseck, J. Phys. Chem. Solids, 1999, 60, 1943–1947 CrossRef CAS
.
- K. Song, H. Schmid, V. Srot, E. Gilardi, G. Gregori, K. Du, J. Maier and P. A. van Aken, APL Mater., 2014, 2, 032104 CrossRef
.
- C. Daiguebonne, O. Guillou, C. Baux, F. Le Dret and K. Boubekeur, J. Alloys Compd., 2001, 323–324, 193–198 CrossRef CAS
.
- M. Bischoff, D. Biriukov, M. Předota, S. Roke and A. Marchioro, J. Phys. Chem. C, 2020, 124, 10961–10974 CrossRef CAS
.
- T. Li, H. Miras and Y.-F. Song, Catalysts, 2017, 7, 260 CrossRef
.
- M. S. Frei, C. Mondelli, A. Cesarini, F. Krumeich, R. Hauert, J. A. Stewart, D. Curulla Ferré and J. Pérez-Ramírez, ACS Catal., 2020, 10, 1133–1145 CrossRef CAS
.
- Q. Xiao, J. Zhang, C. Xiao, Z. Si and X. Tan, Sol. Energy, 2008, 82, 706–713 CrossRef CAS
.
- S. Lakshmi, R. Renganathan and S. Fujita, J. Photochem. Photobiol., A, 1995, 88, 163–167 CrossRef CAS
.
- R. S. Dariani, A. Esmaeili, A. Mortezaali and S. Dehghanpour, Optik, 2016, 127, 7143–7154 CrossRef CAS
.
- Y. Xue, Q. Luan, D. Yang, X. Yao and K. Zhou, J. Phys. Chem. C, 2011, 115, 4433–4438 CrossRef CAS
.
Footnote |
| † Electronic supplementary information (ESI) available. See DOI: https://doi.org/10.1039/d3ra03801g |
| This journal is © The Royal Society of Chemistry 2023 |

