DOI:
10.1039/D3RA03764A
(Paper)
RSC Adv., 2023,
13, 26023-26030
Development of tissue paper-based chemosensor and demonstration for the selective detection of Cu2+ and Hg2+ ions†
Received
5th June 2023
, Accepted 16th August 2023
First published on 1st September 2023
Abstract
Heavy metals emanate from natural and man-made sources, such as agricultural chemicals including fertilisers and pesticides, medical waste, and chemicals released from industries. Detection and monitoring toxic metal ions is one of the challenges confronting scientists in biological, environmental, and chemical systems. This study describes the design and synthesis of a new imidazole-based fluorescent and colourimetric chemosensor (DPICDT) for highly selective sensing of Hg2+ and Cu2+ ions in aqueous acetonitrile medium. The probe was synthesised by coupling benzil and substituted aldehyde using ethanolic ammonium acetate. The structure of DPICDT was confirmed via IR spectra, NMR, and HR-MS spectra. The DPICDT probe displayed a rapid naked-eye response towards Cu2+ ions from colourless to red-purple and significant fluorescence quenching response towards Hg2+ over other competitive metal ions in both solution and solid support. The binding modes of DPICDT with Cu2+ and Hg2+ ions were found to be at a 1![[thin space (1/6-em)]](https://www.rsc.org/images/entities/char_2009.gif) :1 ratio as determined using Job plot, ESI HR-MS, and the sensing mechanism was evolved by 1H NMR titrations, HR-MS spectra, and DFT calculations. The lower detection limit was 15.1 nM for Cu2+, eventually far less than the World Health Organization guideline for drinking water (Cu2+ – 31.5 μM) and 1.17 μM for Hg2+ (permissible concentration 2 ppb). Promisingly, the tissue paper-based DPICDT test strips and silica-supported DPICDT were developed and demonstrated for on-site application without resorting to expensive instruments.
:1 ratio as determined using Job plot, ESI HR-MS, and the sensing mechanism was evolved by 1H NMR titrations, HR-MS spectra, and DFT calculations. The lower detection limit was 15.1 nM for Cu2+, eventually far less than the World Health Organization guideline for drinking water (Cu2+ – 31.5 μM) and 1.17 μM for Hg2+ (permissible concentration 2 ppb). Promisingly, the tissue paper-based DPICDT test strips and silica-supported DPICDT were developed and demonstrated for on-site application without resorting to expensive instruments.
Introduction
In recent years, heavy metals have been an environmental threat and are of grave concern worldwide and a growing threat to humanity. Among all heavy metals, copper (Cu) and mercury (Hg) are potentially toxic. Copper is a critically important transition metal for many fundamental physiological processes and in regulating the action of some of the coenzymes in humans, such as superoxide dismutase, tyrosinase, and cytochrome C oxidase.1–3 Copper can be stored in the living tissues of plants, animals, and humans. However, overloading of copper in humans would induce a sequence of neurodegenerative diseases, such as Wilson, Alzheimer, Parkinson's, and metabolic disorders including obesity and diabetes.4,5 In addition, gratuitous metal ions lead to environmental pollution, which soberly threatens the health of microorganisms, plants, animals, and even humans.6 Mercury, a dormant contaminant in the environment, has been a global concern because of its toxicity. Notably, Hg2+ ions can quickly accumulate in living beings. They can bind with thiols and amino groups in proteins and enzymes, which may further induce diseases such as kidney failure, tumour formation, motor disorders, and neurological damage such as prenatal brain damage.7,8 Considering an overview of these ions in day-to-day life, developing techniques for sensing and monitoring these ions is in great demand.
Various analytical methods have been used for the determination of metal ions, including nuclear techniques,9,10 gravimetry,11 electrochemical techniques,12,13 ion chromatography,14 γ-ray spectrometry,15 inductively coupled plasma/mass spectrometry,16 capillary zone electrophoresis,17 and using cation-exchange resin18 and extraction.19 However, these methods have many drawbacks, including high cost, intricate sample preparation, time-consuming, and require skilled human resources. To overcome these limitations, chemical sensors were used to determine metal ions.20,21 The alternative and more sensitive methods that can swiftly and selectively measure the metal ions in low concentrations in different media are difficult. Mainly, amphoteric imidazole is a well-known organic compound, and its substituted analogues have been ardently studied due to its simple synthetic tactic, superior yield, effortless purification, desirable photophysical properties, and ease of integration of the artificial binding sites towards various analytes.
Although some of the sensors have been reported to detect Cu2+ and Hg2+, most of them either could not access discrimination within the same measurement method or differentiate both using masking reagents.22,23 Unfortunately, to the best of our knowledge, a simple sensor that can detect both Cu2+ and Hg2+ within the same sample with various responses is yet to be reported. With this in mind herewith, we developed a simple, facile, and rapid DPICDT chemosensor with specific selectivity and sensitivity towards Cu2+ and Hg2+ over other interfering metal ions, leading to predominant naked eye colour change from colourless to pink for Cu2+ and fluorescence off response for Hg2+ under UV light (λ = 365 nm). Interestingly, the tissue paper-based DPICDT test strips and solid-supported DPICDT@SiO2 were developed and demonstrated the scope of DPICDT for practical sensing applications for Cu2+ and Hg2+ ions.
Experimental section
Materials and instrumentation
The chloride and nitrate salts of Hg2+, Cu2+, Ca2+, Ce3+, Co2+, Ba2+, Bi2+, Li+, Mg2+, Mn2+, Mo2+, Na+, Ni2+, Pb2+, Sr2+, Al3+, Zr2+, Zn2+, all reagents, and solvents (analytical and spectroscopic grade) were purchased from Sigma Aldrich, TCI chemicals, Avra and were used without further purification. Deionised water was used throughout the experiments. The stock solutions were prepared by dissolving the analytes in deionised water. The reaction monitoring and purity determination of the substrates were accompanied by thin layer chromatography using silica gel 60 F254 plates (Merck Chemical Company, USA). The melting point was measured on an electro-thermal melting point apparatus. For column chromatography, 60–120 mesh silica gel was used to purify the product. FT-IR spectra were measured using a JASCO-4100 spectrophotometer. 1H NMR and 13C NMR spectra were obtained on Bruker 400 MHz spectrometer, and the chemical shifts are expressed in δ ppm using tetramethylsilane (TMS) as an internal standard. High-resolution mass spectrometry (HRMS) was obtained on a Joel GC Mate II GC-Mass spectrometer. Absorption spectra were recorded using a Jasco V-750 UV-Vis spectrophotometer, and emission spectra were obtained on a Jasco FP-8300 instrument. Atomic absorption spectrometer (AAS – Varian Spectra 240) was used to determine the metal concentration. Fluorescent quantum yields were measured against anthracene (φfl = 0.28 in ethanol) as the fluorescence standard.
Preparation of stock solutions
For spectroscopic measurements, a stock solution of 20 μM DPICDT was prepared in (CH3CN:H2O) (8:2, v/v) and various metal ion solutions, Hg2+, Cu2+, Ca2+, Ce3+, Co2+, Ba2+, Bi2+, Li+, Mg2+, Mn2+, Mo2+, Na+, Ni2+, Pb2+, Sr2+, Al3+, Zr2+, Zn2+ (1 mM), were prepared using deionised water.
Fabrication DPICDT loaded paper strips
DPICDT (10.0 mg) was dissolved in 10 mL of ethanol. Strips of tissue paper (2 × 2 cm) were immersed in the above solution for 1 min, then placed on a clean glass plate, and allowed to dry naturally at ambient temperature. In this way, we obtained the DPICDT-loaded tissue paper strips.
Results and discussion
Chemistry
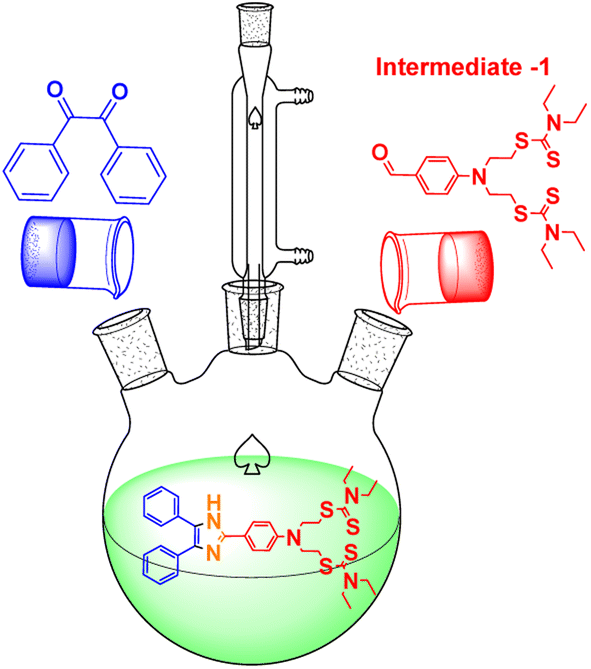
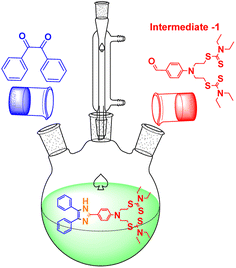
Synthesis of ((4-formylphenyl)azanediyl)bis(ethane-2,1-diyl) bis(diethylcarbamodithioate) (intermediate-1). A mixture of 4-(bis(2-chloroethyl)amino)benzaldehyde (2.5 g, 10 mmol) and sodium diethyldithiocarbamate (4.3 g, 25 mmol) was dissolved in acetonitrile (25 mL) at room temperature. The mixture was heated to reflux for about 24 h. The reaction mixture was cooled to room temperature, and the solution was poured into 100 mL of ice water and filtered to give a light brown solid. The crude product was recrystallized in ethanol to yield intermediate-1 as crystalline light brown solid24 (4 g, 88%) 1H NMR (400 MHz, CDCl3, δ): 9.74 (s 1H, CHO) 7.76–7.73 (d, 2H, Ar H), 7.07–7.05 (d, 2H, Ar H), 4.07–4.02 (t, 4H, CH2), 3.80–3.55 (m, 8H, CH2), 3.53–3.51 (t, 4H, CH2), 1.31–1.27 (t, 12H, CH3) (Fig. S1†); 13C NMR (400 MHz, CDCl3): δ (ppm) 194.47, 190.23, 152.34, 132.34, 125.79, 111.60, 49.86, 49.78, 46.94, 32.93, 12.50, 11.60 (Fig. S2†). HRMS (ESI): calcd for C21H34N3OS4 472.1579 found 472.1593 (Fig. S3†).
Synthesis of ((4-(4,5-diphenyl-1H-imidazole-2 yl)phenyl)azanediyl)bis(ethane-2,1 diyl)bis(diethylcarbamodithioate) [DPICDT]. The DPICDT chemosensor was achieved by a previously reported literature procedure with minor modifications using a simple single-step condensation reaction of aldehyde and ketone with base, as illustrated in Scheme 1.25 To a stirred solution of benzil (1 g, 2.1 mmol) in ethanol (20 mL), intermediate-1 [0.45 g, 2.1 mmol] was added, followed by the addition of ammonium acetate (1.6 g, 21 mmol). The reaction mixture was stirred and heated to reflux for 4 h. The course of the reaction was monitored by thin layer chromatography. After completion, the reaction mixture was cooled and poured into crushed ice. The precipitate was filtered and dried. The obtained solid was further purified by column chromatography using hexane and ethyl acetate (15%) as eluent. The desired DPICDT was obtained as a dirty white solid with an 85% yield. 1H NMR (400 MHz, CDCl3, δ): 12.3 (s 1H, NH) 7.99–7.77 (d, 2H, Ar H), 7.54–7.52 (d, 2H, Ar H), 7.33–7.25 (m, 2H, Ar H), 7.01–6.99 (d, 2H, Ar H), 4.05–4.02 (t, 4H, CH2), 3.78–3.70 (m, 8H, CH2), 3.54–3.50 (t, 4H, CH2), 1.31–1.27 (t, 12H, CH3) (Fig. S4†); 13C NMR (400 MHz, CDCl3): δ (ppm) 194.92, 147.87, 128.51, 127.84, 127.18, 126.83, 117.91, 112.23, 49.97, 49.69, 46.91, 33.31, 12.53, 11.63 (Fig. S5†). HRMS (ESI): calcd for C35H43N5S4 662.004 found 662.2448 (Fig. S6†).
 |
| | Scheme 1 Synthesis of ((4-(4,5-diphenyl-1H-imidazole-2-yl)phenyl)azanediyl)bis(ethane-2,1 diyl)bis(diethylcarbamodithioate) [DPICDT]. | |
Colourimetric and spectral response of DPICDT to Cu2+
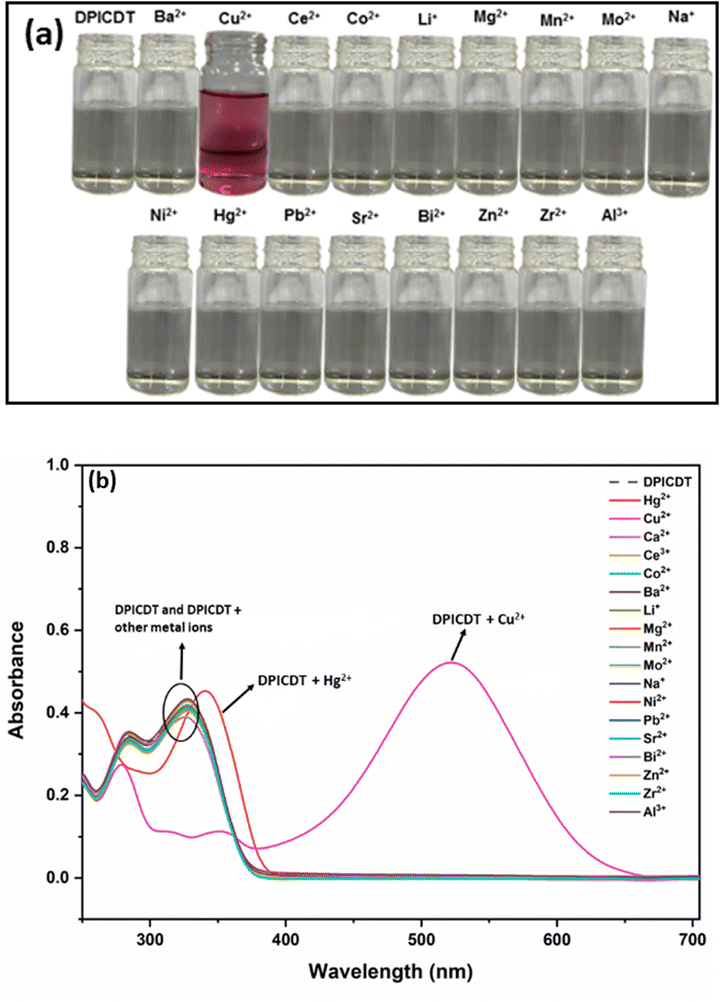
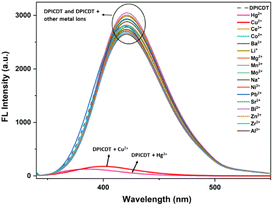
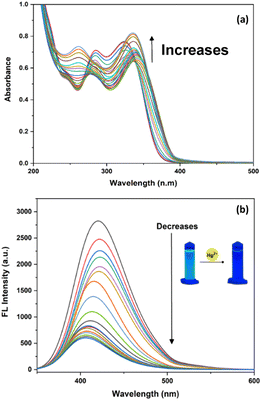
The spectroscopic properties of DPICDT in (CH3CN:H2O) (8:2, v/v) solution were investigated with absorption and fluorescence studies. Absorption spectra of the DPICDT were measured in the presence of different metal ions like Hg2+, Cu2+, Ca2+, Ce3+, Co2+, Ba2+, Bi2+, Li+, Mg2+, Mn2+, Mo2+, Na+, Ni2+, Pb2+, Sr2+, Al3+, Zr2+, and Zn2+. As shown in (Fig. 1), the UV-Vis absorption of DPICDT (20 μM) exhibits two bands, high energy λmax 325 nm attributed to π–π* transitions and a shoulder peak at 283 nm.
 |
| | Fig. 1 (a) DPICDT (20 μM) in the presence of various analytes (1 mM) in (CH3CN:H2O) (8:2, v/v) under daylight. (b) Specific selectivity of DPICDT (20 μM) in the presence and absence of diverse cations (1 mM) in (CH3CN:H2O) (8:2, v/v). | |
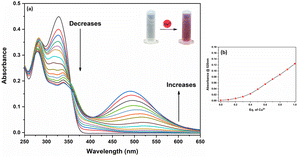
The binding interactions of DPICDT towards diverse metal ions show a selective response and significant absorption changes towards Cu2+ and Hg2+ ions. However, none of the other metal ions caused a substantial effect in the absorption band of DPICDT. When DPICDT was treated with Cu2+ ion, the peaks at 283 and 325 nm disappeared and induced a significant bathochromic shift with a new strong absorption band at 525 nm due to ligand–metal charge transfer. Meanwhile, the colour of the DPICDT probe solution turned from colourless to red-purple after the addition of Cu2+ ions.
The response was reasonably fast, and we could observe a distinct colour change while adding. Thus, DPICDT can be used to detect Cu2+ ions by the naked eye.26 In addition, the colour change could be explained by the LMCT mechanism. The band with the molar extinction coefficient in the thousands (26 × 103 M−1 cm−1 at 520 nm) is too large to be a Cu-based d–d transition and thus must be a ligand-based transition.27 An isosbestic point was identified at 355 nm, which indicates a DPICDT–Cu2+ complex formation.
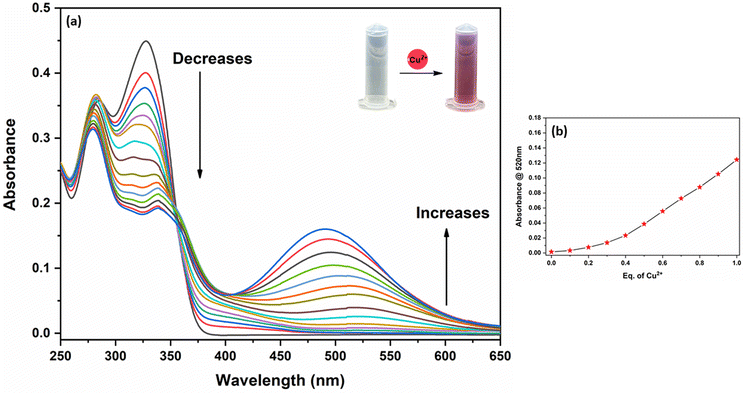
To investigate the DPICDT–Cu2+ interaction, the absorption titration of DPICDT (20 μM) by incremental addition of Cu2+ ion (1 mM) was recorded in (CH3CN:H2O) (8:2, v/v) solution (Fig. 2). UV-Vis titration showed a gradual extinction of the 325 nm signal in the presence of increasing amounts of Cu2+ and a slight increase of the 495 nm signal. Effectively, the absorbance at 325 nm decreases and that of 495 nm increases gradually upon adding one equivalent of Cu2+. Therefore, an M1L complex seems to be formed during the titration.
 |
| | Fig. 2 (a) UV-Vis titration of (20 μM) DPICDT in (CH3CN:H2O) (8:2, v/v) with increasing amounts of Cu2+ (1 mM) (b) absorbance plotted vs. equiv. of Cu2+ at 500 nm. | |
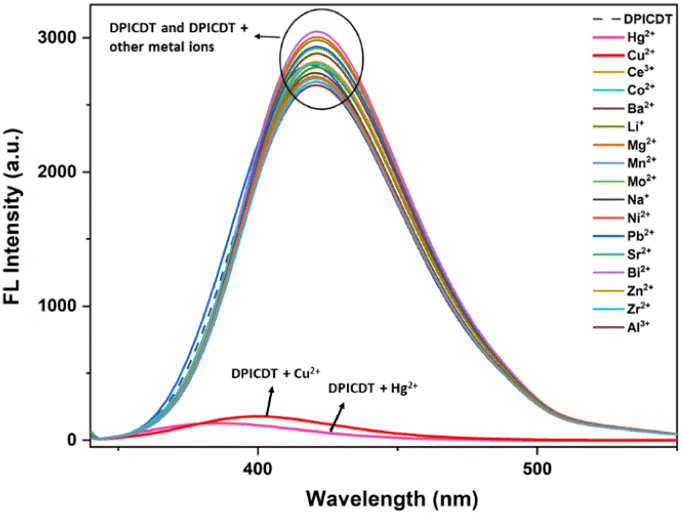
Fluorescence emission spectra of DPICDT are recorded upon excitation at 325 nm to understand the nature of interactions of metal ions in the excited state (Fig. 3). DPICDT shows an emission band at 421 nm, and the emission peak decreased completely upon the addition of Cu2+ ion. The paramagnetic nature of Cu2+ ions can be expected to quench the excited state of DPICDT.28 Adding 2.5 equivalence of Cu2+ ions led to a 30-fold decrease in the 421 nm fluorescence intensity of DPICDT.
 |
| | Fig. 3 Fluorescence spectra of DPICDT (20 μM) in the presence and absence of diverse cations (1 mM) in (CH3CN:H2O) (8:2, v/v). | |
For a better understanding of the quenching mechanism, the fluorescence spectral titrations of DPICDT (20 μM) were performed with incremental addition of Cu2+ in (CH3CN:H2O) (8:2, v/v). As shown in (Fig. 4), the fluorescence intensity of DPICDT centered at 421 nm gradually reduced and shifted to 403 nm with increasing concentration of Cu2+, which eventually became constant at two equivalents of Cu2+.
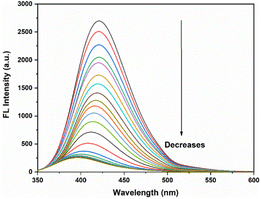 |
| | Fig. 4 Fluorescence titration of (20 μM) DPICDT in (CH3CN:H2O) (8:2, v/v) with increasing amounts of Cu2+ (1 mM) λext = 325 nm. | |
Spectral response of DPICDT to Hg2+
The sensing ability of DPICDT was checked against Hg2+ ions using UV-Vis and fluorescence spectroscopy techniques. As shown in (Fig. 1) the peak at 283 nm disappeared, and the peak at 325 nm was red-shifted to 340 nm with a slight increase in absorbance while adding Hg2+. Furthermore, the UV-Vis titration of DPICDT with Hg2+ is shown in (Fig. 5a). With the addition of increasing amounts of Hg2+ to a solution of DPICDT in (CH3CN:H2O) (8:2, v/v), the isosbestic point at 333 nm and 270 nm confirmed the formation of the complex between DPICDT and Hg2+.
 |
| | Fig. 5 (a) UV-Vis titration of (20 μM) DPICDT in (CH3CN:H2O) (8:2, v/v) with increasing amounts of Hg2+; (b) fluorescence titration of (20 μM) DPICDT in (CH3CN:H2O) (8:2, v/v) with increasing amounts of Hg2+ (1 mM) λext = 325 nm. | |
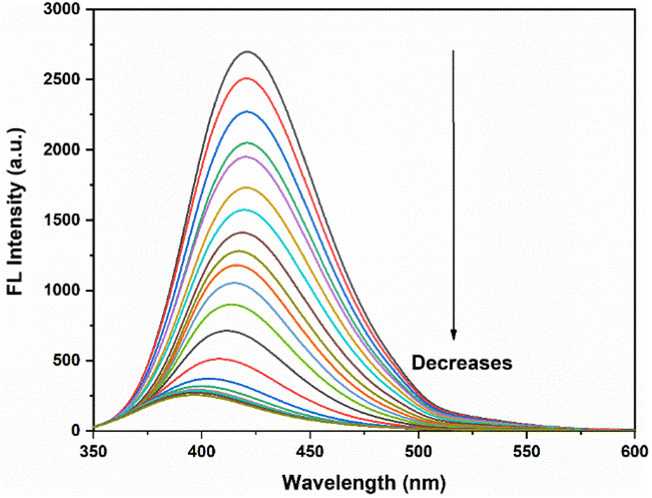
The selectivity of the DPICDT sensor to Hg2+ was further investigated by fluorometric detection in (CH3CN:H2O) (8:2, v/v), which shows a significant decrease in the emission intensity with a slight shift observed upon adding Hg2+. After the successive addition of 0–2.5 equivalents of Hg2+, the emission at 420 nm was entirely quenched, and a weak emission peak at 400 nm was found (Fig. 5b).
In contrast, the fluorescence behaviour of DPICDT in THF decreased with increasing concentration of DMSO. For instance, upon excitation, fluoresce spectrum of dilute DPICDT in THF showed a fluorescence emission band at 410 nm (Fig. S7†). Interestingly, increasing the concentration of DMSO in DPICDT exhibits a minor spectral shift from 410 to 415 nm with a decrease in emission intensity. This decrease in fluorescence intensity was ascribed to an increase in the dipole moment of the TICT state, which on interaction with a polar solvent (DMSO) promotes the intramolecular motions.29
Metal binding and sensing mechanism
The binding ratio of DPICDT to Cu2+ and Hg2+ was further confirmed by the Job's plot. The Job's plot results are illustrated in (Fig. S8†), and 1:1 stoichiometry was calculated for both DPICDT–Cu2+ and DPICDT–Hg2+. The stoichiometry was further confirmed by HR-MS analysis. The positive-ion ESI mass indicated peaks at m/z 721.2675 and m/z = 1059.4265, which were assigned to [DPICDT + Cu2+–3H+] + (calcd, 724.1697) (Fig. S9†) and [DPICDT + Hg(ClO4)2 + H+] + (calcd, 1061.1089) (Fig. S10†), respectively.
From the above outcomes, it was feasible to determine the dissociation constants (Ka) for the interaction of DPICDT with Cu2+ and DPICDT with Hg2+ using the Benesi–Hildebrand plot. The dissociation constant value of Hg2+ with DPICDT was found to be 3.85 × 10⁶ M−1 and 2.71 × 10⁶ M−1 for Cu2+ (Fig. S11†). From this equation, LOD = 3σ/K (where σ is the standard deviation of the blank measurement, and K is the slope of the linear plot, which is emission intensity versus concentration), and the limit of detection was computed to be 15.1 nM for Cu2+ and 1.17 μM for Hg2+ (Fig. S12†). The fluorescence quantum yield was determined using anthracene as a reference with a known ΦR of 0.27 in ethanol. The quantum yield values were found to be 0.155 for DPICDT, 0.0051 for DPICDT–Cu2+, and for DPICDT–Hg2+ is 0.0087. The obtained 30-fold and 17-fold decrease in quantum yield supports the fluorescence quenching of DPICDT on binding with Cu2+ and Hg2+, respectively.
To further investigate the binding mechanism, the expected complex formation was further confirmed using FT-IR and 1H-NMR spectra. The FT-IR spectrum of DPICDT with and without Cu2+ and Hg2+ were measured and illustrated in (Fig. S13†). The DPICDT peaks at 694 cm−1, 1263 cm−1, 1348 cm−1, and 2975 cm−1 were attributed to the stretching vibration of C–S, C![[double bond, length as m-dash]](https://www.rsc.org/images/entities/char_e001.gif) S, (CH3)2–N–CS and NH, respectively. However, in the FT-IR spectrum of DPICDT–Cu2+, the NH peak broadened and was observed at 3150 cm−1; this further confirms that the imine group was involved in coordination with Cu2+. In addition, in the FT-IR spectrum of DPICDT–Hg2+, the characteristic peaks of C–S, CS, and (CH3)2–N–CS were broadened and merged. These obvious changes clearly indicate that the CS in the carbamodithioate group of DPICDT was involved in coordination with Hg2+ ions.
S, (CH3)2–N–CS and NH, respectively. However, in the FT-IR spectrum of DPICDT–Cu2+, the NH peak broadened and was observed at 3150 cm−1; this further confirms that the imine group was involved in coordination with Cu2+. In addition, in the FT-IR spectrum of DPICDT–Hg2+, the characteristic peaks of C–S, CS, and (CH3)2–N–CS were broadened and merged. These obvious changes clearly indicate that the CS in the carbamodithioate group of DPICDT was involved in coordination with Hg2+ ions.
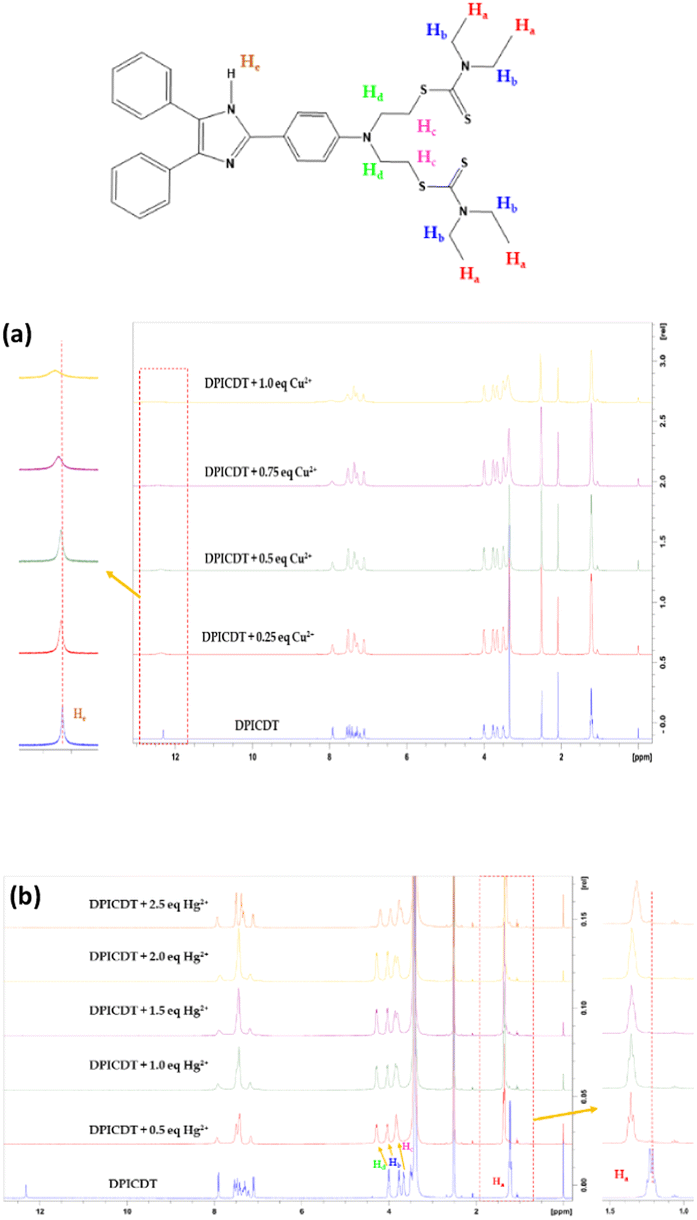
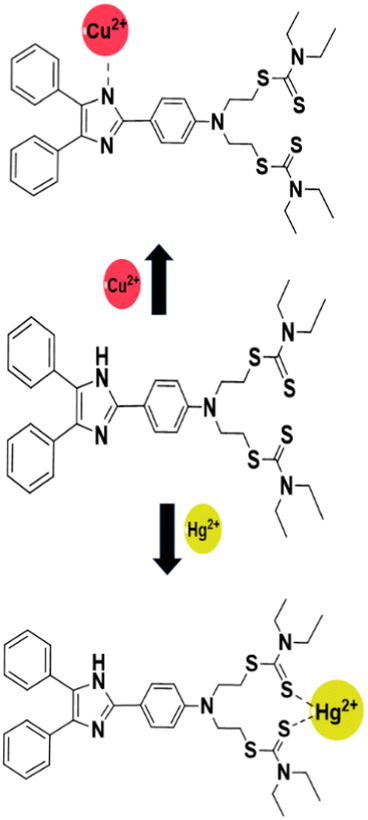
To clarify the coordination mode of DPICDT, 1H NMR titration was executed in DMSO-d6. The DPICDT showed signals at 12.3 ppm due to NH proton (He); the peaks at 7.9–7.0 ppm and 4.0–3.3 ppm are attributed to aromatic and methylene protons (Hb, Hc, and Hd), respectively. The peak at 1.2 ppm corresponds to the methyl protons (Ha). The spectral data before and after adding Cu2+ and Hg2+ are depicted in (Fig. 6a and b). Upon complexation with Cu2+, the imine proton signal at 12.3 ppm decreased gradually and slightly shifted downfield to 12.52 ppm. Similarly, with the addition of Hg2+ to DPICDT, the aliphatic proton (Ha, Hb, Hc, and Hd) signals broadened and shifted downfield. These results showed that the coordination occurs with thione containing dithiocarbamate group. According to Pearson's hard – soft acid – base theory, Hg2+ ions have a high affinity towards sulfur atoms, which was distinctly determined by the fluorescence quenching effect. Thus, based on the above facts, Scheme 2 depicts the plausible coordination modes of DPICDT with Hg2+ and Cu2+ ions.
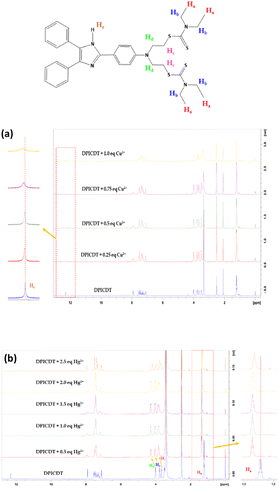 |
| | Fig. 6 1H NMR spectra of DPICDT (400 Hz, DMSO-d6) in the absence and presence of Cu2+ (0 to 1 equiv.) (a) and Hg2+ (0 to 2.5 equiv.) (b). | |
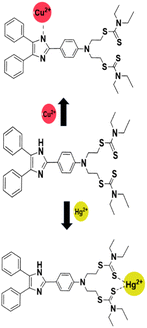 |
| | Scheme 2 Plausible binding of DPICDT with Hg2+ and Cu2+ ions. | |
Theoretical calculation methods
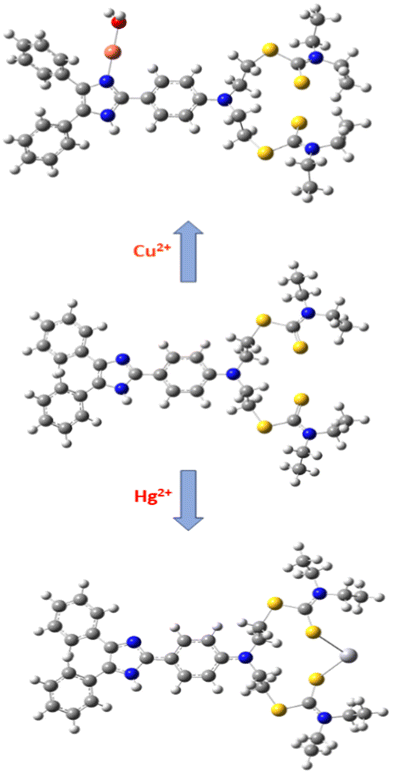
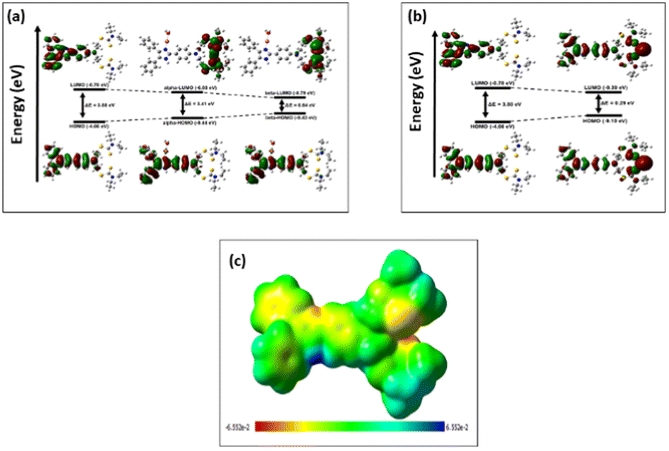
The electronic properties of DPICDT and its complexes with Cu2+ and Hg2+ were investigated through theoretical analysis using DFT calculations. The optimized structure of DPICDT is shown in (Fig. 7).
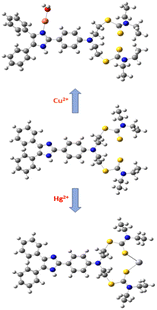 |
| | Fig. 7 DFT optimised DPICDT, DPICDT–Cu2+, and DPICDT–Hg2+ complexes. | |
To determine the reactive sites of the ligand, molecular electrostatic potential surface (ESP) calculations were performed for the metal atom binding, as illustrated in (Fig. 8). The ESP plot revealed regions of higher negative potential around the sulfur (–CS) and nitrogen atoms of the ligand, suggesting that these sites are the most likely binding sites for the Hg2+ and Cu2+ ions, respectively. Additionally, the Frontier molecular orbitals (FMOs) of the ligand and its Cu2+ and Hg2+ complexes (DPICDT–Cu2+, DPICDT–Hg2+) were analysed and are presented in (Fig. 8). The FMO analysis of DPICDT and its Cu2+ complex indicated that the charge density of the free ligand primarily resides on the imidazole part. However, the FMO plots of Cu2+ and Hg2+ complexes showed L–M charge transfer for Cu2+ and twisted intramolecular charge transfer for Hg2+. This charge transfer, accompanied by a significant reduction in the HOMO–LUMO band gap, is likely responsible for the shift in the UV absorption band.
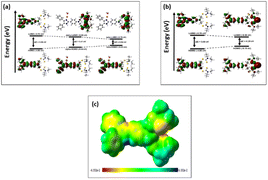 |
| | Fig. 8 (a) Frontier molecular orbitals of the DPICDT probe and its Cu2+ complex (DPICDT–Cu2+). (b) Frontier molecular orbitals of DPICDT and its Hg2+ complex (DPICDT–Hg2+). (c) Molecular electrostatic potential (MEPS) formed by mapping the total density over electrostatic potential in the gas phase of DPICDT. | |
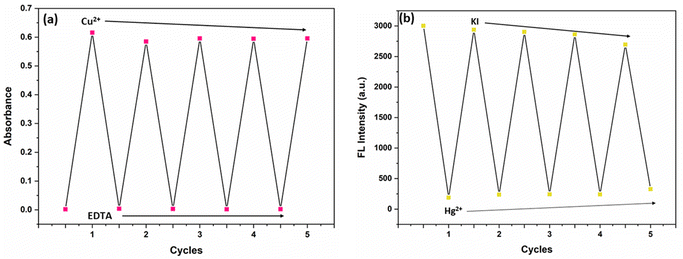
Reversibility studies
To increase the applicability of the chemosensor DPICDT, it was significant to test its reversibility for the detection of cations. The reversible performance of DPICDT towards Cu2+ and Hg2+ was studied using ethylenediamine tetraacetic acid (EDTA) and KI in UV-Vis and FL experiments, respectively, as shown in (Fig. 9). The DPICDT solution is colourless and when it binds Cu2+ ions, the colour is changed to red-purple. However, adding the chelating agent ethylenediamine tetraacetic acid into the Cu2+–DPICDT solution resulted in a colour change from colourless to red-purple, indicating the recovery of DPICDT. Upon successive addition of ethylenediamine tetraacetic acid solution to Cu2+–DPICDT, the maximum absorption peak at 520 nm decreased, and it almost resorted to the original DPICDT signal, indicating the de-complexation. Hg2+ induces a remarkable fluorescence change by showing OFF behaviour through complex formation (Hg2+–DPICDT). In addition, the fluorescence ON response corresponding to DPICDT was recovered upon adding the KI solution. The KI addition increased the intensity and again decreased with negligible intensity loss. This could be attributed to the formation of stable mercury iodide and the consequent release of free DPICDT. The repeated demonstration of the ON/OFF behaviour of the system by fluorescence as well as the absorbance change, clearly suggests that DPICDT is reversible and a reusable sensor.
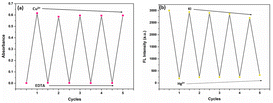 |
| | Fig. 9 (a) Reversible changes in colour and of DPICDT at 520 nm in CH3CN:H2O (8:2, v/v) upon alternate addition of Cu2+ and EDTA; (b) Reversible changes in fluorescence intensity of DPICDT upon alternate addition of Hg2+ and KI. | |
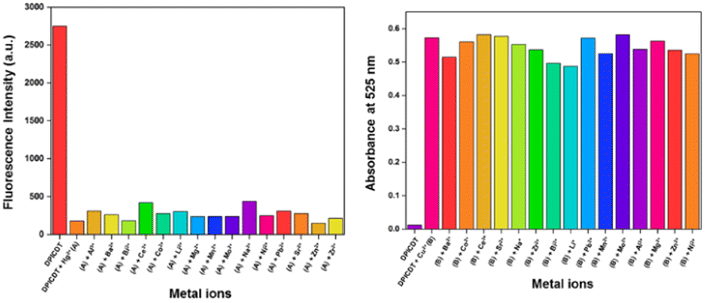
Interference study
DPICDT was treated with various interfering cations to test its practical ability toward Cu2+ and Hg2+ using UV-Vis spectrometer and fluorescence spectrometer. As shown in Fig. 10, various metal ions had negligible effects.30 These findings suggested that DPICDT could be used as a better colorimetric sensor for Cu2+ and fluorometric sensor for Hg2+ ions.
 |
| | Fig. 10 Bar diagram showing interference from other metal ions during detection of Hg2+ (left) and Cu2+ (right) using DPICDT. | |
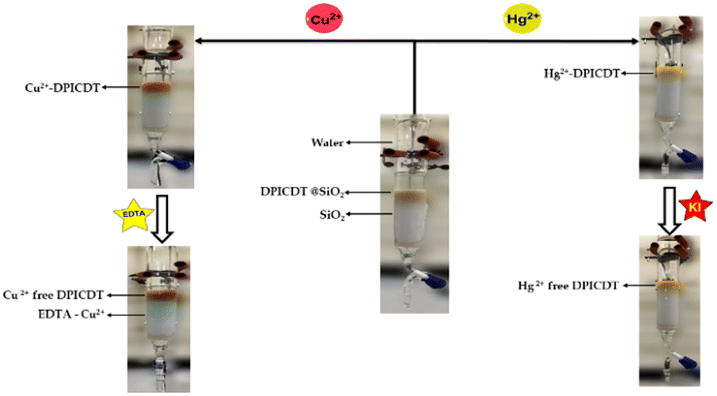
Solid matrix – extraction performance of DPICDT towards Cu2+ & Hg2+
The extraction efficiency is an essential factor in the design and synthesis of novel chemosensors to improve their practical applicability in industries. A solid-supported material (DPICDT@SiO2) was fabricated to study the extraction performance of DPICDT towards Cu2+ and Hg2+, which is displayed in (Fig. 11). The solid-supported matrix was prepared by adsorbing DPICDT onto commercially available silica gel (SiO2, 60–120 mesh) in a 1:4 w/w ratio. The resulting light brown powders (DPICDT@SiO2) were collected and utilised as extractants in column chromatography. The extraction ability of DPICDT was estimated by measuring the amount of Cu2+ and Hg2+ individually using AAS, resulting in >99% of Cu2+ and 100% of Hg2+ ions being extracted by DPICDT@SiO2. Upon the addition of 100 ppm of Cu2+ solution through solid-supported DPICDT@SiO2, the colour of solid support changed from light brown (DPICDT@SiO2) to chestnut (Cu2+–DPICDT@SiO2), and the resulting copper-free fractions were collected. Furthermore, the ethylenediamine tetraacetic acid (EDTA) solution was passed through the column; as expected, the blue colour confirms the Cu2+–EDTA complex formation, and the Cu2+ free DPICDT@SiO2 bed was fully recovered. Similarly, by adding 100 ppm of Hg2+ solution, light brown DPICDT@SiO2 changed to bright yellow, instantly confirming the (Hg2+–DPICDT@SiO2) complex formation. The addition of KI solution into the column resulted in Hg2+ free DPICDT@SiO2. The AAS result suggests that DPICDT is potentially useful as a stationary phase for separating Cu2+ and Hg2+ using column chromatography (Fig. S14†).
 |
| | Fig. 11 Demonstration of extracting metal ions through column chromatography method. | |
Cost-effective tissue paper-based sensor application
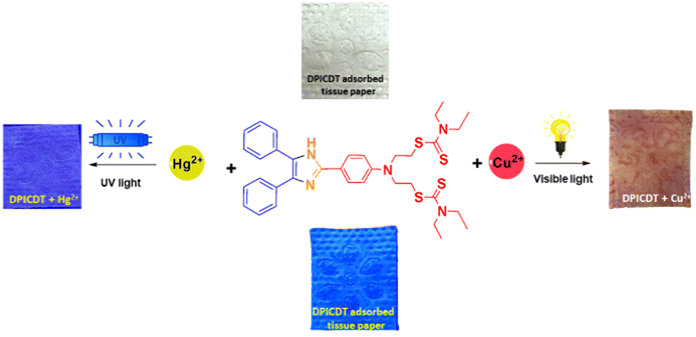
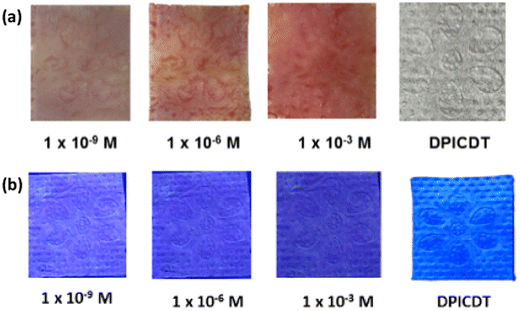
We prepared simple tissue paper-based test strips to demonstrate the DPICDT sensor application towards the on-site application of spiked samples. The Cu2+ and Hg2+ spiked solutions were prepared individually using deionised water. The DPICDT was dissolved in ethanol, and then ordinary tissue papers were immersed into the solution and incubated for 1 min. The collected tissue papers were dried in air at room temperature and utilised to sense various metal ions. A noticeable change was only observed for Cu2+ and Hg2+ solutions. As depicted in (Fig. 12), the colour of the DPICDT-coated tissue paper strip changed from colourless to red-purple with Cu2+ solution under the naked eye. Similarly, the colour intensity decreased when Hg2+ was added to the DPICDT tissue paper strip under the 365 nm UV lamp. Furthermore, to study the sensitivity of DPICDT (Fig. 13), DPICDT fabricated tissue paper was immersed in different concentrations of Cu2+ & Hg2+ (1 × 10⁻³ M, 1 × 10⁻⁶ M, 1 × 10⁹ M). The color change occurred quickly, and the rate of changing the color of the tissue paper strip increased proportionally with increasing Cu2+ concentration, and the color intensity was decreased proportionally with increasing Hg2+ concentration. Therefore, tissue paper-based DPICDT test strips can instantly detect Cu2+ and Hg2+ ions in water samples without the requirements of any analytical instruments.
 |
| | Fig. 12 Photographs of tissue paper strips containing DPICDT for detecting Cu2+ in natural light (right) and Hg2+ under 365 nm UV light (left). | |
 |
| | Fig. 13 Colorimetric response and fluorometric response of DPICDT on tissue paper with various concentrations of (a) Cu2+ and (b) Hg2+ ions. | |
Conclusion
In summary, we have successfully designed and synthesised a novel imidazole fragment (DPICDT), which could serve as a dual chemosensor for Cu2+ and Hg2+ in the presence of various other competitive ions. DPICDT displayed a colourimetric response towards Cu2+ and a fluorescence turn-off response towards Hg2+ with two different sensing approaches. The analytical detection limit of Cu2+ and Hg2+ were 15.1 nm and 1.17 μM, respectively, obtained from the linear plot, which is relatively lower upon comparing recent literature reviews (Tables S1 & S2†). Furthermore, DPICDT has been utilised successfully for Cu2+ and Hg2+ extraction through a solid-supported matrix. UV-Vis, ESI-MS, and NMR studies thoroughly examined the complex formation, stoichiometry, and binding mode, which show the 1:1 complex formation of DPICDT with both Cu2+ and Hg2+. Moreover, the easy-to-prepare tissue paper test strip provided a convenient and reliable detection of Cu2+ and Hg2+ for practical applications. Here, a single molecular system acts as a colourimetric sensor for Cu2+ and an ON–OFF fluorescence sensor for Hg2+, integrating the chemosensor principle.
Conflicts of interest
There are no conflicts to declare.
Acknowledgements
NSK acknowledges the Atomic Energy Regulatory Board, India for sanctioning the CSRP project (Ref. No. AERB/CSRP/PROJ. No.65/06/2017), DST – SERB for Young Scientist Scheme Project (Ref. No. SB/FT/CS-067/2013) and the Grand-in-Aid by FIST scheme from Department of Science and Technology, India (SR/FIST/college-110/2017).
Notes and references
- M. H. Mahnashi, A. M. Mahmoud, S. A. Alkahtani, R. Ali and M. M. El-Wekil, Spectrochim. Acta, Part B, 2020, 228, 117846 CrossRef CAS.
- Y. Cao, Y. Liu, F. Li, S. Guo, Y. Shui, H. Xue and L. Wang, Microchem. J., 2019, 150, 104176 CrossRef CAS.
- F. N. Moghadam, M. Amirnasr, S. Meghdadi, K. Eskandari, A. Buchholz and W. Plass, Spectrochim. Acta, Part A, 2019, 207, 6–15 CrossRef PubMed.
- A. Mohammadi and Z. Ghasemi, Spectrochim. Acta, Part A, 2020, 228, 117730 CrossRef CAS PubMed.
- Y. S. Kim, G. J. Park, S. A. Lee and C. Kim, RSC Adv., 2015, 5, 31179–31188 RSC.
- L. L. Yang, A. L. Tang, P. Y. Wang and S. Yang, Org. Lett., 2020, 22, 8234–8239 CrossRef CAS PubMed.
- P. Marimuthu, B. Umamahesh, S. Baskar, K. Sathiyanarayanan, B. Venkatachalapathy, C. Ravichandran and N. S. Karthikeyan, New J. Chem., 2018, 42, 8530–8536 RSC.
- V. Raju, R. S. Kumar, S. A. Kumar, G. Madhu, S. Bothra and S. K. Sahoo, J. Chem. Sci., 2020, 132, 1–11 CrossRef.
- M. B. Rodríguez, F. V. Tomé, J. C. Lozan and V. G. Escobar, Appl. Radiat. Isot., 2000, 52, 705–710 CrossRef.
- E. J. Bouwer, J. W. McKlveen and W. J. McDowell, Nucl. Technol., 1979, 42, 102–111 CrossRef CAS.
- C. Kósa, M. Danko and P. Hrdlovič, J. Fluoresc., 2012, 22, 1371–1381 CrossRef.
- J. N. Li, F. Y. Yi, Z. M. Jiang and J. J. Fei, Mikrochim. Acta, 2003, 143, 287–292 CrossRef CAS.
- V. K. Gupta, A. K. Jain and P. Kumar, Sens. Actuators, B, 2006, 120, 259–265 CrossRef CAS.
- E. H. Borai and A. S. Mady, Appl. Radiat. Isot., 2002, 57, 463–469 CrossRef CAS PubMed.
- A. Pantelica, I. I. Georgesecu, M. D. Murariu-Magureanu, I. Margaritescu and E. Cincu, Radiat. Prot. Dosim., 2001, 97, 187–191 CrossRef CAS PubMed.
- E. A. Casartelli and N. Miekeley, Anal. Bioanal. Chem., 2003, 377, 58–64 CrossRef CAS PubMed.
- B. F. Liu, L. B. Liu and J. K. Cheng, Talanta, 1998, 47, 291–299 CrossRef CAS PubMed.
- A. K. Jain, V. K. Gupta, U. Khurana and L. P. Singh, Electroanalysis, 1997, 9, 857–860 CrossRef CAS.
- N. El-Hefny and J. Daoud, J. Radioanal. Nucl. Chem., 2004, 261, 357–363 CrossRef CAS.
- B. K. Rani and S. A. John, New J. Chem., 2017, 41, 12131–12138 RSC.
- K. Tayade, A. Kaur, S. Tetgure, G. K. Chaitanya, N. Singh and A. Kuwar, Anal. Chim. Acta, 2014, 852, 196–202 CrossRef CAS PubMed.
- V. Merz, J. Merz, M. Kirchner, J. Lenhart, T. B. Marder and A. Krueger, Chem. - Eur. J., 2021, 27, 8118–8126 CrossRef CAS.
- H. Cho, J. B. Chae and C. Kim, ChemistrySelect, 2019, 4, 2795–2801 CrossRef CAS.
- X. M. Meng, L. Liu, H. Y. Hu, M. Z. Zhu, M. X. Wang, J. Shi and Q. X. Guo, Tetrahedron Lett., 2006, 47, 7961–7964 CrossRef CAS.
- J. Jayram and V. Jeena, RSC Adv., 2018, 8, 37557–37563 RSC.
- M. P. Bhat, M. Kigga, H. Govindappa, P. Patil, H. Y. Jung, J. Yu and M. Kurkuri, New J. Chem., 2019, 43, 12734–12743 RSC.
- Y. S. Kim, G. J. Park, S. A. Lee and C. Kim, RSC Adv., 2015, 5, 31179–31188 RSC.
- Y. Xiang, A. Tong, P. Jin and Y. Ju, Org. Lett., 2006, 8, 2863–2866 CrossRef CAS PubMed.
- S. Sharma, A. Gupta, C. P. Pradeep and A. Dhir, ChemistrySelect, 2017, 2, 10517–10523 CrossRef CAS.
- R. Arumugaperumal, V. Srinivasadesikan, M. C. Lin, M. Shellaiah, T. Shukla and H. C. Lin, RSC Adv., 2016, 6, 106631–106640 RSC.
|
| This journal is © The Royal Society of Chemistry 2023 |
Click here to see how this site uses Cookies. View our privacy policy here. 
 Open Access Article
 This Open Access Article is licensed under a Creative Commons Attribution-Non Commercial 3.0 Unported Licence
 a,
Marimuthu Ponram
a,
Marimuthu Ponram