 Open Access Article
Crystal growth, phase transition, and nuclear magnetic resonance of organic–inorganic hybrid perovskite NH2(CH3)2CdCl3†
Ae Ran Lim *ab and
Ma Byong Yoonb
aGraduate School of Carbon Convergence Engineering, Jeonju University, Jeonju 55069, Korea
bDepartment of Science Education, Jeonju University, Jeonju 55069, Korea. E-mail: aeranlim@hanmail.net; arlim@jj.ac.kr
First published on 1st September 2023
Abstract
Understanding the physicochemical properties of organic–inorganic hybrid materials is essential to promote their applications. In this study, a single crystal of NH2(CH3)2CdCl3 was grown, and it exhibited a monoclinic structure. Its phase transition temperatures were 460 and 470 K, and it showed sufficient thermal stability. The changes in the NMR chemical shifts of each atom in the crystal with increasing temperature were determined; the chemical shift of 1H of NH2 in the NH2(CH3)2 cation changed with temperature, which was correlated to the changes in the chemical shift of 14N in NH2. The change in 113Cd chemical shifts indicate the change of six Cl atoms around Cd in CdCl6. Therefore, the change in the coordination geometry of CdCl6 is attributed to the change in the N–H⋯Cl hydrogen bond between the NH2(CH3)2 cation and CdCl6 anion. In addition, the 13C activation energies Ea obtained from the spin-lattice relaxation time T1ρ values are smaller than those of the 1H Ea values, suggesting that is free compared to 1H in the cation. We believe that this study furthers our fundamental understanding of organic–inorganic hybrid materials to promote their practical solar cell applications.
1. Introduction
Organic–inorganic hybrid perovskite crystals based on metal halides have received increasing attention owing to their interesting optoelectronic, electrical, and magnetic properties.1–5 The most common perovskite MAPbX3 (MA = CH3NH3, X = I, Br, or Cl) based thin-film photovoltaic devices are used as solar cells.6–14 However, MAPbX3-based photovoltaics are highly unstable under ambient conditions, especially in the presence of moisture, and are highly toxic owing to Pb bioaccumulation. Recently, researchers have suggested substituting Pb with other low-toxicity or eco-friendly metals to develop Pb-free photovoltaic devices. Free-Pb [NH3(CH2)nNH3]BX4 (n = 1, 2, 3…, B = Mn, Co, Cu, Zn, or Cd) and [CnH2n+1NH3]2BX4 are organic–inorganic hybrids that have recently attracted considerable attention.15–27 In addition, [NH2(CH3)2]2BX4 and NH2(CH3)2BX3 are MA2BX4- and MABX3-type complexes, where MA+ (= NH2(CH3)2) is a univalent cation.28–34 Here, the organic group of the organic–inorganic hybrid material determines the optical properties and structural flexibility of the material, whereas the inorganic group affects the mechanical and thermal properties. Hence, these organic–inorganic materials constitute an important area of research in the field of materials science.35,36X-ray studies on dimethylammonium trichlorocadmium crystals, NH2(CH3)2CdCl3, revealed their monoclinic structure with a P21/c space group and the lattice parameters a = 8.7377 Å, b = 13.2709 Å, c = 6.6910 Å, β = 98.371°, and Z = 4 at room temperature.37 The structural unit is formed by the organic [NH2(CH3)2]+ and the inorganic [CdCl6]− moieties. The infinite chains consist of face-sharing CdCl6 octahedra, resulting in a 1D perovskite structure of the MABX3 family, where MA = NH2(CH3)2, B = Cd, and X = Cl. The six doubly bridging chloride ions link the adjacent Cd centers via Cd–Cl bonds.
Moreover, Kalthoum et al.37 investigated the application of NH2(CH3)2CdCl3, which has a large dielectric constant, in field-effect transistors. They also reported the optical properties of NH2(CH3)2CdCl3 for solar cell applications.38 And, the effects for Zn2+ and Cu2+ doping of NH2(CH3)2CdCl3 for white-light emission and green solar cell applications were investigated by Jellai et al.39
The minimum of nuclear magnetic resonance (NMR) spin-lattice relaxation time in the rotating frame (T1ρ) depends on the frequency ω1 rather than ωo. Therefore, the minimum T1ρ is observed at a lower temperature than the spin–lattice relaxation time in the laboratory frame (T1). T1ρ provides information on motion in the kHz region, and T1 provides information on rapid motion in the order of tens or hundreds of MHz.40
In this study, among the perovskite types applied to solar cell applications, single crystals of Pb-free and thermal stable materials are grown and their physicochemical properties are studied. Therefore, we grew a NH2(CH3)2CdCl3 single crystal via an aqueous solution method and analyzed its structure by single-crystal X-ray diffraction (SCXRD). The phase transition temperature (TC) of this crystal was determined using differential scanning calorimetry (DSC) and powder X-ray diffraction (PXRD). Thermogravimetric analysis (TGA) was performed to determine the thermodynamic properties of the material. The structural environments of 1H, 13C, 14N, and 113Cd in [NH2(CH3)2] cation and CdCl6 anion were analyzed based on the chemical shifts observed in magic angle spinning (MAS) NMR and static NMR spectra. Moreover, we determined the T1ρ, which represents the energy transfer around the 1H and 13C atoms of the cation, and activation energies (Ea). These physicochemical properties can provide important insights into the mechanisms of compound for potential applications in solar cell.
2. Experimental
2.1. Crystal growth
NH2(CH3)2CdCl3 single crystals were grown from a mixture of a 1![[thin space (1/6-em)]](https://www.rsc.org/images/entities/char_2009.gif) :
:![[thin space (1/6-em)]](https://www.rsc.org/images/entities/char_2009.gif) 1 ratio of NH2(CH3)2Cl (99%; Sigma-Aldrich) and CdCl2 (99.99%; Sigma-Aldrich) in an aqueous solution. The mixture was heated and stirred to form a saturated solution. After filtering the prepared solution through a filter, the colorless and transparent single crystals were grown for a few weeks via slow evaporation at a constant temperature of 300 K.
1 ratio of NH2(CH3)2Cl (99%; Sigma-Aldrich) and CdCl2 (99.99%; Sigma-Aldrich) in an aqueous solution. The mixture was heated and stirred to form a saturated solution. After filtering the prepared solution through a filter, the colorless and transparent single crystals were grown for a few weeks via slow evaporation at a constant temperature of 300 K.
2.2. Characterization
Lattice constants were obtained at 200 K and 300 K using the SCXRD instrument at the Seoul Western Center of the Korea Basic Science Institute (KBSI). A single crystal in Paratone oil was placed on a Bruker diffractometer (D8 Venture PHOTON III M14) equipped with a graphite-monochromated Mo-Kα radiation source (λ = 0.71073 Å) and a N2 cold flow (−50 °C). The data were collected and integrated using SMART APEX3 (Bruker, 2016) and SAINT (Bruker, 2016). The absorption was corrected using the multiscan method implemented in SADABS. This structure was analyzed by full-matrix least-squares on F2 using the SHELXTL software.41 All hydrogen atoms are represented by geometric positions. In addition, the PXRD patterns of the NH2(CH3)2CdCl3 were obtained at various temperatures with a Mo-Kα target.42DSC measurements (DSC 25, USA) were acquired in the range of 200–573 K at a heating rate of 5 °C min−1 and 10 °C min−1 under N2 gas, respectively.
TGA (SDT 0650-0439, USA) and differential thermal analysis (DTA) were performed in the range of 300–873 K at a heating rate of 10 °C min−1 under N2 gas.
The 1H MAS and 13C cross-polarization (CP) MAS NMR spectra of NH2(CH3)2CdCl3 crystals were recorded at the Larmor frequencies of 400.13 and 100.61 MHz using a solid-state 400 MHz NMR spectrometer (AVANCE III+, Bruker, Germany) at the KBSI Seoul Western Center. The samples in the cylindrical zirconia rotors were spun at a rate of 10 kHz for the MAS NMR measurements to minimize the spinning sideband. Adamantane and tetramethylsilane (TMS) were selected as the internal standards for 1H and 13C NMR, respectively. 1D NMR spectrum for 1H and 13C was performed in the delay time of 1.5–15 s. The 1H T1ρ values were measured using π/2–τ spin-lock pulse for a duration of τ, and the π/2 pulse width was 4 μs. And, the 13C T1ρ values were measured by varying the duration of a 13C spin-locking pulse applied after the CP preparation period. The 13C T1ρ values were obtained using CP-τ acquisition. Static 14N NMR spectra of the NH2(CH3)2CdCl3 crystal were recorded using the one-pulse method with a Larmor frequency of 28.90 MHz, where NH4NO3 was the internal standard. Static 113Cd NMR spectra were recorded at a Larmor frequency of 88.75 MHz, where CdCl2O8·6H2O was the internal standard. The NMR experiment above 430 K due to the limitations of the NMR instrument was not possible. The temperature was maintained nearly constant within the error range of ±0.5 °C, even when the rate of N2 gas flow and the heater current were adjusted.
3. Results and discussion
3.1. Single crystal XRD
The SCXRD results at 200 K and 300 K showed that NH2(CH3)2CdCl3 crystallized into a monoclinic system with a P21/c space group. The cell constants were as follows: a = 8.6891 (13) Å, b = 13.212 (2) Å, c = 6.6851 (10) Å, β = 98.362° (2), and Z = 4. Fig. 1 shows the structure of the NH2(CH3)2CdCl3 crystal at 200 K, and the SCXRD data at 200 K and 300 K are presented in Table 1. The structure constitutes an organic [NH2(CH3)2]+ cation and inorganic [CdCl6]− anion. The infinite chains consisted of face-shared CdCl6 octahedra and six doubly bridging Cl− ions linked to adjacent Cd centers. The bond lengths and angles are summarized in Table 2. Moreover, N–H⋯Cl hydrogen bonds connected the [NH2(CH3)2]+ cations to the [CdCl6]− anions. Here, the N–H⋯Cl hydrogen bond consists of an angle greater than 120° as shown in Table 2.43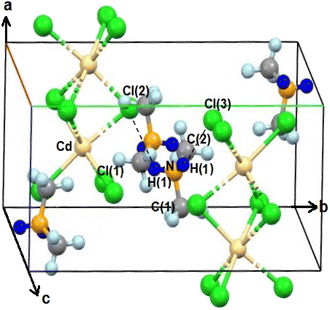 | ||
| Fig. 1 Crystal structure of NH2(CH3)2CdCl3 at 200 K (A.R. Lim CCDC 2258449). | ||
| Chemical formula | C2H8NCdCl3 | C2H8NCdCl3 |
| Weight | 264.84 | 264.84 |
| Crystal system | Monoclinic | Monoclinic |
| Space group | P21/c | P21/c |
| T (K) | 200 | 300 |
| a (Å) | 8.6891 (13) | 8.7426 (5) |
| b (Å) | 13.212 (2) | 13.2834 (8) |
| c (Å) | 6.6851 (10) | 6.6950 (3) |
| β (°) | 98.362 (2) | 98.362 (2) |
| Z | 4 | 4 |
| V (Å3) | 759.0 (2) | 769.23 (7) |
| Radiation type | Mo-Kα | Mo-Kα |
| Wavelength (Å) | 0.71073 | 0.71073 |
| Reflections collected | 14![[thin space (1/6-em)]](https://www.rsc.org/images/entities/char_2009.gif) 048 048 |
13![[thin space (1/6-em)]](https://www.rsc.org/images/entities/char_2009.gif) 392 392 |
| Independent reflections | 1871 (Rint = 0.0582) | 1932 (Rint = 0.0925) |
| Goodness-of-fit on F2 | 1.078 | 1.079 |
| Final R indices [I > 2sigma(I)] | wR1 = 0.0234, wR2 = 0.0615 | wR1 = 0.0884, wR2 = 0.2946 |
| R indices (all data) | wR1 = 0.0244, wR2 = 0.0621 | wR1 = 0.0936, wR2 = 0.3043 |
| Temperature | 200 K | 300 K |
|---|---|---|
| Cd–Cl(1) | 2.6062 (6) | 2.5927 (18) |
| Cd–Cl(2) | 2.5872 (6) | 2.6076 (19) |
| Cd–Cl(3) | 2.6613 (6) | 2.659 (2) |
| Cd–Cl(1)#2 | 2.6788 (6) | 2.6803 (18) |
| Cd–Cl(2)#1 | 2.6223 (6) | 2.6226 (19) |
| Cd–Cl(3)#1 | 2.6860 (6) | 2.6933 (19) |
| N(1)–C(1) | 1.472 (4) | 1.456 (12) |
| N(1)–C(2) | 1.479 (3) | 1.463 (13) |
| N(1)–H(1AN) | 0.9100 | 0.8900 |
| N(1)–H(1BN) | 0.9100 | 0.8900 |
| C(1)–H(1) | 0.9800 | 0.9600 |
| C(2)–H(2) | 0.9800 | 0.9600 |
| Cl(2)–Cd–Cl(1) | 99.17 (2) | 98.83 (6) |
| Cl(2)–Cd–Cl(3) | 84.59 (2) | 84.67 (6) |
| Cl(1)–Cd–Cl(3) | 176.126 (18) | 176.38 (6) |
| H(1AN)–Cl(2) | 2.792 | 2.697 |
| H(1BN)–Cl(3) | 2.551 | 2.590 |
| N(1)–H(1AN)–Cl(2) | 122.09 | 141.02 |
| N(1)–H(1BN)–Cl(3) | 148.93 | 150.24 |
3.2. Phase transition temperatures and thermal properties
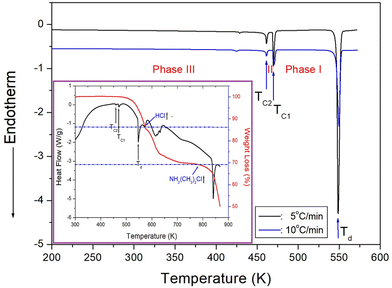
DSC results were obtained in the temperature range of 200–573 K at a heating rate of 5 and 10 °C min−1 by putting powder sample of 15.2 mg and 5.7 mg in a capsule, respectively. Two weak endothermic peaks at 461 and 470 K and one strong endothermic peak at 549 K were shown in Fig. 2. The enthalpies for the three observed peaks in the heating rate of 10 °C min−1 were 20.44, 73.16, and 690.68 kJ mol−1.In addition, TGA experiment with the amount of 8.35 mg was conducted at a heating rate of 10 °C min−1 the same as the DSC experiment, and the results are shown in Fig. 2 in detail. The crystal was thermally stable up to 524 K with a weight loss of ∼2%. The endothermic peak at ∼547 K confirms the peak observed in the DSC curve. Moreover, the fact that the crystal became opaque at ∼550 K suggests that ∼550 K is the decomposition temperature (Td) of the crystal. From the total molecular weight of 264.86 mg, the amounts of residual produced by the decomposition of HCl and [NH2(CH3)2Cl] were considered. The molecular weight losses of 14 and 31% were due to the decomposition of HCl and [NH2(CH3)2Cl], respectively. As the two step decomposition processes, the first undergo a weight loss of 14% near 573 K, and the second undergo a weight loss of 31% near 784 K.
In order to accurately confirm the three peaks shown in the DSC results of Fig. 2, we observed the changes in the single crystal with temperature using an optical polarization microscope. No significant changes were observed when the temperature was increased from 300 to 500 K, following which the crystal gradually became opaque at higher temperatures. The single crystal became completely opaque at ∼550 K and melted at 600 K.
PXRD patterns were acquired at different temperatures in the 2θ range of 8–60° as shown in Fig. 3. The PXRD patterns obtained at 300, 350, and 400 K (blue color) of phase III differ slightly from that recorded at 465 K (red color) of phase II; this difference is associated with TC2 (= 461 K). Furthermore, the PXRD pattern recorded at 465 K of phase II differs from those recorded above 480 K (olive color) of phase I, indicating a clear change in TC1 (= 470 K). These results are consistent with those of the DSC experiments. Additional, the theoretical XRD pattern based on the cif file at 300 K is shown in Fig. 3, which agrees well with the experimental pattern. The peaks observed in this diffractogram are indexed with Mercury program.
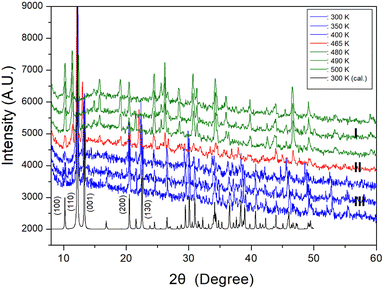 | ||
| Fig. 3 Powder X-ray diffraction patterns of NH2(CH3)2CdCl3 at phases III, II, and I. 300 K (cal.) is the theoretical XRD pattern at 300 K. | ||
Therefore, the DSC, PXRD, and polarizing microscopy experiments suggest that the phase transition temperatures were TC2 = 461 K and TC1 = 470 K, whereas the decomposition temperature was Td = 549 K.
3.3. 1H and 13C MAS NMR chemical shifts
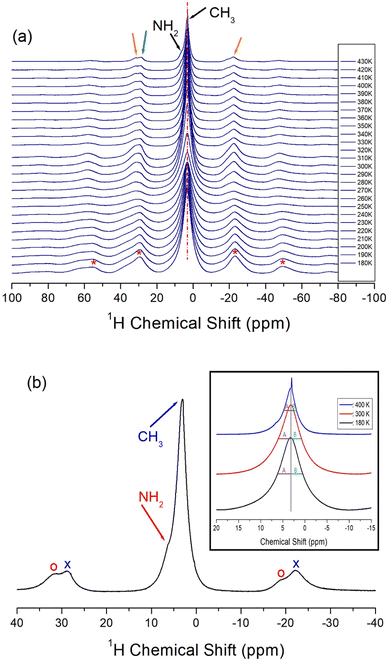
Two 1H NMR spectra by NH2 and CH3 in NH2(CH3)2CdCl3 should be obtained, but only one signal was obtained, and these results are shown in Fig. 4(a). At low temperatures, the two 1H NMR signals completely overlapped. The sideband of the 1H NMR spectrum is marked by *. As the temperature increased, they separated slightly.One sideband appears on the right side and two sidebands appear on the left side. The appearance of two sidebands (oval on the left side) indicated that the two 1H signals in NH2 and CH3 did not completely overlap. That is, at 430 K, the 1H chemical shift in CH3 was 3.24 ppm and the 1H chemical shift in NH2 was ∼5 ppm as shown in Fig. 4(b). Here, the sidebands for NH2 and CH3 are marked by open circles and crosses, respectively; moreover, the half widths (A and B) of full width at half maximum (FWHM) at 180, 300, and 400 K were not symmetrical (inset of Fig. 4(b)). The 1H peak of CH3 hardly changed with temperature, suggesting that the structural environment around 1H in CH3 does not change with temperature. However, the fact that the sideband on the left side appears as one at low temperatures and two at high temperatures indicates that the position of the 1H signal in NH2 changes slightly with temperature. This result indicates that the environments around 1H in NH2 vary slightly with the temperature.
The 13C MAS NMR chemical shifts of NH2(CH3)2CdCl3 were measured at increasing temperatures, as shown in Fig. 5. Two signals for 13C were recorded at 220 K, indicating that the two 13C atoms of the cation had different environments. At 260 K, only one signal is observed, indicating that the environment surrounding 13C remains the same. However, at 300 K and 340 K, two separate 13C spectra were observed, indicating that the surrounding environments of 13C in the cation were different from each other. In other words, the observation of the two 13C NMR signals means that the surrounding environments of the two CH3 located on both sides of N in the NH2(CH3)2 cation are different each other. And, the observation of one 13C NMR signal means that the surrounding environments of the two CH3 located on both sides of N are the same each other. Finally, at temperatures above 380 K, a single spectrum was observed, and the line width became very narrow. Hence, the environments around 13C in CH3 vary considerably depending on the temperature. 13C NMR chemical shifts were observed at 39.84 and 37.97 ppm at 300 K, and the line width was narrower (1.54 ppm) than that (32 ppm) in the 1H NMR of NH2 and CH3, indicating that the molecular motion of 13C located at the end of the [NH2(CH3)2] cation is very free.
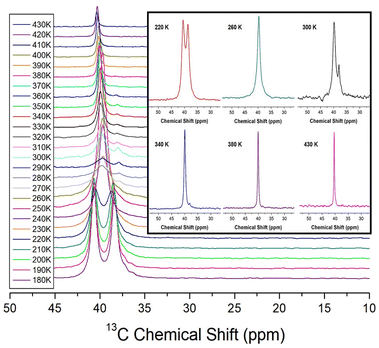 | ||
| Fig. 5 13C MAS NMR chemical shifts for NH2(CH3)2CdCl3 as a function of temperature (inset: 13C MAS NMR chemical shifts for NH2(CH3)2CdCl3 at 220, 260, 300, 340, 380, and 430 K). | ||
3.4. 14N and 113Cd static NMR chemical shift
The 14N static NMR spectrum of NH2 in the NH2(CH3)2CdCl3 single crystal was recorded in the temperature range of 180–420 K as shown in Fig. 6. The 14N NMR spectrum was less sensitive than 1H, but has a larger chemical shift range. The magnetic field direction relative to the single-crystal direction was measured in an arbitrary direction. The NMR spectrum due to the spin number of 14N (I = 1)44 was predicted by the two resonance lines owing to the quadrupole interaction. The Larmor frequency for 14N NMR spectrum was extremely low as 28.90 MHz, which made it difficult to obtain a signal. Moreover, distinguishing the signals was difficult owing to the low peak intensities and wide line widths. Four 14N NMR signals were observed, which were divided into two sets: N(1) and N(2). The chemical shift of N(1) slightly increased with increasing temperature, whereas that of N(2) decreased and then slightly increased. At 300 K, the line width was extremely broad (∼64 ppm) and indicated the presence of two sets of N sites. The continuous changes in the N(1) and N(2) chemical shifts with increasing temperature indicated a change in the coordination geometry of the local environment of 14N atom. SCXRD results did not indicate different N sites; thus, these two sets of 14N NMR signals suggest a twin structure due to the property of ferroelastic materials.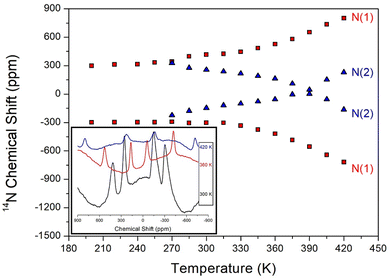 | ||
| Fig. 6 The static 14N NMR chemical shifts of NH2(CH3)2CdCl3 single crystal as a function of temperature (inset: 14N NMR spectrum at 300, 360, and 420 K). | ||
The 113Cd signal was distributed over a wide chemical shift range and exhibited good intensity owing to its relatively high natural abundance; therefore, it was not difficult to record. From the chemical shifts of static 113Cd NMR, the structural environment around 113Cd in CdCl6 was determined based on the temperature change. As the number of spins in 113Cd (I = ½),44 only one resonance signal was expected. At 300 K, the 113Cd chemical shift was 215.26 ppm as shown in Fig. 7, and the 113Cd chemical shifts changed with temperature, suggesting that the 113Cd environment in CdCl6 changed with temperature. The line widths of the 113Cd NMR spectra are shown in detail in Fig. 7. At 300 K, the line width was ∼39 ppm, which is wider than 1H line widths, and hardly changed within the error range depending on the temperature.
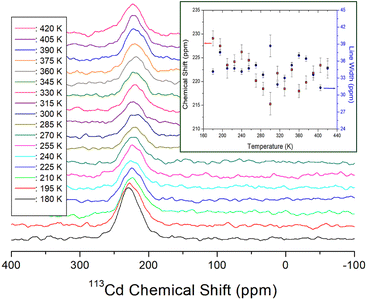 | ||
| Fig. 7 Static 113Cd NMR chemical shifts for NH2(CH3)2CdCl3 as a function of temperature (inset: 113Cd NMR chemical shifts and line widths for NH2(CH3)2CdCl3 as a function of temperature). | ||
3.5. 1H and 13C NMR spin-lattice relaxation times
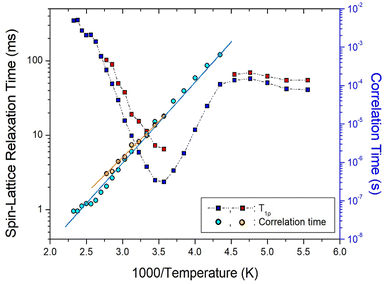
The 1H and 13C T1ρ values of NH2(CH3)2CdCl3 crystals were collected using a spin-lock pulse and subsequent FID. The intensity changes in the measured magnetization are calculated using the following equation:45,46| S(t)/S(0) = exp(-t/T1ρ) | (1) |
 | (2) |
| τC = τC(0)exp(-Ea/kBT) | (3) |
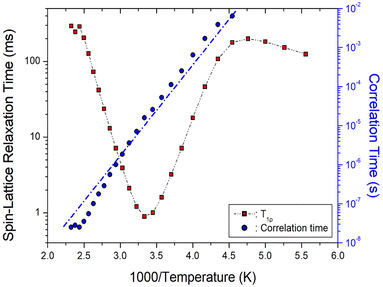 | ||
| Fig. 8 1H T1ρ values and correlation times of NH2(CH3)2CdCl3 as a function of inverse temperature. Blue dot line is represented the activation energy Ea. | ||
 | ||
| Fig. 9 13C T1ρ values and correlation times of NH2(CH3)2CdCl3 as a function of inverse temperature. Two solid lines are represented the activation energies Ea. | ||
On the other hand, the two 13C T1ρ values shown in Fig. 9 showed similar trends at all temperatures, and the minimum T1ρ value of CH3 was observed at 280 K. The minimum 13C T1ρ values of 6.54 and 2.32 ms were observed at 280 K. The 13C T1ρ values varied considerably with temperature. These values first gradually increased with increasing temperature up to 220 K, above which they decreased rapidly to a minimum and finally rapidly increased. Similar to the 1H T1ρ values, the 13C T1ρ values exhibit molecular motion according to the BPP theory. The 13C τC values were calculated using the same method as that used for the 1H τC value based on the temperature change, as shown in Fig. 9. The 13C Ea values obtained from the plots of τC vs. 1000/T were 40.77 ± 2.82 and 37.19 ± 1.91 kJ mol−1; these two values are similar within the error range.
4. Conclusions
In this study, an organic–inorganic hybrid NH2(CH3)2CdCl3 crystal was grown and its crystal structure, phase transition temperature, thermal behavior, and structural dynamics were investigated. The structure of this crystal was monoclinic, as evidenced by SCXRD at 200 K and 300 K, and the phase transition temperatures TC of 460 and 470 K were determined using DSC and PXRD. The thermal properties determined by TGA showed that the crystal began decomposing at 540 K and was thermally stable. Although the surrounding environments by the 1H, 13C, 14N, and 113Cd NMR chemical shifts varied with increasing temperature, this is independent of the phase transition. It is noteworthy that the 1H and 14N NMR chemical shifts bonded to NH2 in the NH2(CH3)2 cation were changed more as the temperature changes, and the change in 113Cd NMR chemical shift indicate changes in the surrounding environment of the six Cl atoms around the Cd in CdCl6. These experimental results suggest that the N–H⋯Cl hydrogen bonding between the NH2(CH3)2 cation and CdCl6 anion changed with temperature. In addition, T1ρ values which represent the energy transfer around the 1H and 13C atoms of the cation, varied significantly with temperature. 1H and 13C T1ρ values were comparable in the measured temperature range because 1H and 13C connect the same bond in the cation. Moreover, 13C Ea values were smaller than those of 1H, suggesting that 13C at the end of the cation is free compared to 1H in the cation. The physicochemical properties will help a fundamental understanding of Pb-free organic–inorganic perovskite type solar cell.Conflicts of interest
There are no conflicts to declare.Acknowledgements
This work was supported by the national Research Foundation of Korea (NRF) grant funded by the Korea government (MSIT) (2023R1A2C2006333). This research was also supported by the Basic Science Research Program through the National Research Foundation of Korea (NRF), funded by the Ministry of Education, Science, and Technology (2016R1A6A1A03012069).References
- R. Jlassi, A. P. C. Ribeiro, M. Mendes, W. Rekik, G. A. O. Tiago, K. T. Mahmudov, H. Naili, M. F. C. Guedes da Silva and A. J. L. Pombeiro, Polyhedron, 2017, 129, 182 CrossRef CAS.
- S. Dgachi, A. M. Ben Salah, M. M. Turnbull, T. Bataille and H. Naili, J. Alloys Compd., 2017, 726, 315 CrossRef CAS.
- O. Kammoun, H. Naili, W. Rekik and T. Bataille, Inorg. Chim. Acta, 2015, 434, 209 CrossRef CAS.
- S. F. Hoefler, G. Trimmel and T. Rath, Monatsh. Chem., 2017, 148, 795 CrossRef CAS PubMed.
- S.-S. Rong, M. B. Faheem and Y.-B. Li, J. Electron. Sci. Technol., 2021, 19, 100081 CrossRef.
- M. Zhang, Z. Li, X. Xin, J. Zhang, Y. Feng and H. Lv, ACS Catal., 2020, 10, 14793 CrossRef CAS.
- Y. Zhu, Y. Liu, Q. Ai, G. Gao, L. Yuan, Q. Fang, X. Tian, X. Zhang, E. Egap, P. M. Ajayan and J. Lou, ACS Mater., 2022, 4, 464 CAS.
- Q. Chen, N. D. Marco, Y. Yang, T.-B. Song, C.-C. Chen, H. Zhao, Z. Hong, H. Zhou and Y. Yang, Nano Today, 2015, 10, 355 CrossRef CAS.
- M. Hermes, S. A. Bretschneider, V. W. Bergmann, D. Klasen, J. Mars, W. Tremel, F. Laquai, H.-J. Butt, M. Mezger, R. Berger, B. J. Rodriguez and S. A. L. Weber, J. Phys. Chem., 2016, 120, 5724 CrossRef PubMed.
- E. Strelcov, Q. Dong, T. Li, J. Chae, Y. Shao, Y. Deng, A. Gruverman, J. Huang and A. Centrone, Sci. Adv., 2017, 3, e1602165 CrossRef PubMed.
- S. K. Abdel-Aal, A. S. Abdel-Rahman, G. G. KocherOberlehner, A. Ionov and R. Mozhchil, Acta Crystallogr. A, 2017, 70, C1116 Search PubMed.
- Y. Liu, L. Collins, R. Proksch, S. Kim, B. R. Watson, B. Doughty, T. R. Calhoun, M. Ahmadi, A. V. Ievlev, S. Jesse, S. T. Retterer, A. Belianinov, K. Xiao, J. Huang, B. G. Sumpter, S. V. Kalinin, B. Hu and O. S. Ovchinnikova, Nat. Mater., 2018, 17, 1013 CrossRef CAS PubMed.
- C. M. Mauck, A. France-lanord, A. C. Hernandez Oendra, N. S. Dahod, J. C. Grossman and W. A. Tisdale, J. Phys. Chem. C, 2019, 123, 27904 CrossRef CAS.
- C. J. Dahlman, R. M. Kennard, P. Paluch, N. R. Venkatesan, M. L. Chabinyc and G. N. Manjunatha Reddy, Chem. Matter., 2021, 33, 642 CrossRef CAS.
- C. N. R. Rao, A. K. Cheetham and A. Thirumurugan, J. Phys. Condens. Matter, 2008, 20, 83202 CrossRef.
- Z. Cheng and J. Lin, CrystEngComm, 2010, 12, 2646 RSC.
- M. F. Mostafa and S. S. El-khiyami, J. Solid State Chem., 2014, 209, 82 CrossRef CAS.
- S. Gonzalez-Carrero, R. E. Galian and J. Perez-Prieto, Part. Part. Syst. Char., 2015, 32, 709 CrossRef CAS.
- S. K. Abdel-Adal, G. Kocher-Oberlehner, A. Ionov and R. N. Mozhchil, Appl. Phys. A, 2017, 123, 531 CrossRef.
- W. Liu, J. Xing, J. Zhao, X. Wen, K. Wang, P. Lu and Q. Xiong, Adv. Opt. Mater., 2017, 5, 1601045 CrossRef.
- P. Mondal, S. K. Abdel-Aal, D. Das and S. K. Manirul Islam, Catal. Lett., 2017, 147, 2332 CrossRef CAS.
- M. Elseman, A. E. Shalan, S. Sajid, M. M. Rashad, A. M. Hassan and M. Li, ACS Appl. Mater. Interfaces, 2018, 10, 11699 CrossRef PubMed.
- J. A. Aramburu, P. Garcia-Fernandez, N. R. Mathiesen, J. M. Garcia-Lastra and M. Moreno, J. Phys. Chem. C, 2018, 122, 5071 CrossRef CAS.
- B. Staskiewicz, O. Czupinski and Z. Czapla, J. Mol. Struct., 2014, 1074, 723 CrossRef CAS.
- B. Staskiewicz, I. Turowska-Tyrk, J. Baran, C. Gorecki and Z. Czapla, J. Phys. Chem. Solids, 2014, 75, 1305 CrossRef CAS.
- Z. Czapla, J. Prezeslawski, M. Crofton, J. Janczak, O. Czupinski and A. Ingram, Phase Transitions, 2017, 90, 637 CrossRef CAS.
- A. Waskowska, Z. Kristallogr., 1994, 209, 752 CAS.
- K. Horiuchi, H. Ishihara and H. Terao, J. Phys.: Condens. Matter, 2000, 12, 4799 CrossRef CAS.
- N. H. Kim, J. H. Choi and A. R. Lim, Solid State Sci., 2014, 38, 103 CrossRef CAS.
- A. R. Lim and Y. Paik, Solid State Sci., 2017, 65, 61 CrossRef CAS.
- N. Mahfoudh, K. Karoui, M. Gargouri and A. BenRhaiem, Appl. Organomet. Chem., 2020, 34, e5404 CAS.
- N. Mahfoudh, K. Karoui, F. Jomni and A. BenRhaiem, Appl. Organomet. Chem., 2020, 34, e5656 CAS.
- N. Mahfoudh, K. Karoui and A. BenRhaiem, RSC Adv., 2021, 11, 24526 RSC.
- A. R. Lim and S. H. Park, Molecules, 2022, 27, 4546 CrossRef CAS PubMed.
- W. Zang and R.-G. Xiong, Chem. Rev., 2012, 112, 1163 CrossRef PubMed.
- A. R. Lim and S. H. Kim, ACS Omega, 2021, 6, 27568 CrossRef CAS PubMed.
- R. Kalthoum, M. B. bechir, A. B. Rhaiem and M. Gargouri, Phys. Status Solidi, 2021, 218, 2100485 CrossRef CAS.
- R. Kalthoum, M. B. Bechir, A. B. Rhaiem and M. H. Dhaou, Opt. Mater., 2022, 125, 112084 CrossRef CAS.
- H. Jellali, R. Msalmi, H. Smaoui, S. Elleuch, A. Tozri, T. Roisnel, E. Mosconi, N. A. Althubiti and H. Naili, Mater. Res. Bull., 2022, 151, 2022 CrossRef.
- J. L. Koenig, Spectroscopy of Polymers, Elsevier, New York, 1999 Search PubMed.
- SHELXTL ν 6.10, Bruker AXS, Inc., Madison, Wisconsin, USA, 2000 Search PubMed.
- A. R. Lim and J. Cho, Sci. Rep., 2022, 12, 16901 CrossRef CAS PubMed.
- E. Arunan, G. R. Desiraju, R. A. Klein, J. Sadlej, S. Scheiner, I. Alkorta, D. C. Clary, R. H. Crabtree, J. J. Dannenberg, P. Hobza, H. G. Kjaergaard, A. C. Legon, B. Mennucci and D. J. Nesbitt, Pure Appl. Chem., 2011, 83, 1637 CrossRef CAS.
- R. K. Harris, Nuclear Magnetic Resonance Spectroscopy, Pitman Pub, UK, 1983 Search PubMed.
- A. Abragam, The Principles of Nuclear Magnetism, Oxford University press, 1961 Search PubMed.
- A. R. Lim, RSC Adv., 2021, 11, 37824 RSC.
Footnote |
| † Electronic supplementary information (ESI) available. CCDC The datasets generated and/or analysed during the current study are available in the CCDC 2258449. For ESI and crystallographic data in CIF or other electronic format see DOI: https://doi.org/10.1039/d3ra04381a |
| This journal is © The Royal Society of Chemistry 2023 |

