DOI:
10.1039/D3RA03680D
(Paper)
RSC Adv., 2023,
13, 20058-20067
A facile strategy to prepare ZSM-5-based composites with enhanced light olefin selectivity and stability in the HTO process
Received
1st June 2023
, Accepted 21st June 2023
First published on 4th July 2023
Abstract
In this study, the influence of different ZSM-5 composite materials (ASA, γ-alumina, η-Al2O3, SiO2, and attapulgite) and their performance in the n-hexane catalytic cracking process in a fixed bed microreactor at 550 °C under atmospheric pressure was studied. XRD, FT-IR spectroscopy, NH3-TPD, BET, FE-SEM, and TG analyses were performed to characterize the catalysts. The result of the n-hexane to olefin process indicated that the A2 catalyst (γ-alumina composition with ZSM-5) showed the highest conversion of 98.89%, highest propylene selectivity of 68.92%, highest yield of light olefins of 83.84%, and highest propylene to ethylene ratio of 4.34. The reason for the significant increase in all these factors and the lowest amount of coke in this catalyst is the use of γ-alumina, which increased the hydrothermal stability and resistance to deactivation, improved the acidic properties with a strong to weak acid ratio of 0.382, and increased the mesoporosity to 0.242. This study indicates the effect of the extrusion process and the composition and the major effect of the properties of this material on the physicochemical properties and distribution of the product.
1 Introduction
Ethylene and propylene as light olefins are important basic chemicals, which are used in many fields, such as the petrochemical industry, pharmaceutical science, coal chemicals, and environmental protection.1–6 In the last few decades, the demand for light olefin production, mainly propylene, as a critical raw material for chemical engineering, has increased exponentially. The methods for the production of light olefins mainly include the thermal cracking of naphtha, which consumes significant energy and emits a lot of carbon dioxide. Furthermore, the amount of propylene produced from this process is very low and insufficient to satisfy the high global demand. Alternatively, the catalytic cracking of naphtha results in high selectivity for light olefins at low temperatures.1,7–9 Therefore, this process has attracted significant attention in recent decades.10,11 Among the different zeolite catalysts used in this process, ZSM-5 exhibits good reactivity and hydrothermal stability during the catalytic cracking of naphtha owing to its unique morphology and acidic properties.12–21 However, its strong acidic sites and low mesoporosity make it susceptible to carbon deposition, which limits its application. BTX molecules (a combination of benzene, toluene, and xylene) result from the hydride transfer and aromatization reactions and act as a precursor of coke.6,22–25 After the formation of coke molecules, they are deposited in the mouth of the pores and inside the micropores, and eventually the acid sites located in the micropores, inactivating these sites.26–28 The formation of coke can be due to secondary reactions of the formed light olefins, which do not have an outlet due to the presence of insufficient mesopores and are unintentionally involved in hydride transfer reactions and the formation of aromatic chains. Subsequently, these reactions cause an increase in the production of BTX and a decrease in olefins. At present, to improve the physicochemical properties of the ZSM-5 zeolite and to address the formation of the precursor of coke, and consequently the rapid deactivation of the ZSM-5 catalyst, there are two main types of techniques for the preparation of hierarchical ZSM-5 zeolites, i.e., the bottom-up and top-down approaches.29,30 To further improve the catalytic performance and stability of ZSM-5, the composite method is employed in commercial processes, where it is often blended with materials such as alumina, silica, and clay to shape the structured catalysts for better mass transfer, alter the porosity, for example, obtain suitable mesoporous to reduce coking formation, and alter the acid site concentration.31–34 For example, the use of alumina due to its mesoporous nature reduces the mass transfer and reduces the amount of coke produced, and consequently increases the amount of light olefins. This is also due to the presence of a sufficient amount of mesopores and the less secondary reactions on the formed olefins to produce aromatics. When less coke is produced, the stability of the catalyst increases, and consequently the lifetime of the catalyst increases, which is very important. In the present study, the ZSM-5 zeolite was successfully shaped into cylindrical extrudes by 30 wt% of five materials (ASA, pseudo-boehmite, bayerite, silica sol, and attapulgite), which was synthesized for the first time for use in the HTO process, and XRD, FT-IR, NH3-TPD, BET, FE-SEM, and TG analyses were performed to characterize the catalysts. Furthermore, the effect of these materials on the textural and acidic properties as well as the performance in the HTO process was studied.
2 Experimental
2.1 Chemicals and reagents
The chemicals utilized in this study to prepare the composite catalysts included ZSM-5 zeolite (Na-ZSM-5, SiO2/Al2O3 = 400, provided by the Research Institute of Petroleum Industry). The ZSM-5 zeolite catalyst was combined with several materials including amorphous silica–alumina (ASA powder with Si/Al = 0.1, which was synthesized according to the reported work of Karami's group35), pseudo-boehmite (AlOOH powder, Shandong Aluminium Industry), bayerite (Al(OH)3 powder, Shandong Aluminium Industry), colloidal silica LUDOX HS-40 (40 wt% SiO2, Sigma-Aldrich), and attapulgite clay (provided by Changzhou Dingbang Mine Company).
2.2 Preparation of ZSM-5 composite catalysts
Before the preparation of the ZSM-5 composite (ASA, γ-alumina, η-Al2O3, SiO2, and attapulgite), Na-ZSM-5 was refluxed at 75 °C for 9 h in three continuous steps (each step lasting 3 h) to obtain NH4-ZSM-5 by using 2.0 M NH4NO3 solution. Then, NH4-ZSM-5 was calcined for 4 h at 600 °C to eliminate NH3, forming H-ZSM-5. The mechanical mixtures of H-ZSM-5 and the above-mentioned materials to prepare the composite catalysts were uniformly blended (wt% of above-mentioned materials: wt% of ZSM-5 = 30![[thin space (1/6-em)]](https://www.rsc.org/images/entities/char_2009.gif) :
:![[thin space (1/6-em)]](https://www.rsc.org/images/entities/char_2009.gif) 70) in a mortar. The details of the composition of the prepared catalysts are presented in Table 1. After kneading the composite physical mixtures and getting the appropriate plasticity for extrusion, the paste-like mixtures were placed inside a cylindrical extruder and passed through a die with a diameter of 2 mm, which created a smooth cylindrical shape. The cylindrical composites were dried at ambient temperature under a lab hood for 2 h, and subsequently all the powders were dried in an oven overnight. Next, the resulting composite samples were calcined at 550 °C for 4 h. The composite zeolites after calcination were denoted as A1, A2, A3, A4, and A5 for the amorphous silica–alumina (ASA), γ-alumina, η-Al2O3, SiO2, and attapulgite materials, respectively.
70) in a mortar. The details of the composition of the prepared catalysts are presented in Table 1. After kneading the composite physical mixtures and getting the appropriate plasticity for extrusion, the paste-like mixtures were placed inside a cylindrical extruder and passed through a die with a diameter of 2 mm, which created a smooth cylindrical shape. The cylindrical composites were dried at ambient temperature under a lab hood for 2 h, and subsequently all the powders were dried in an oven overnight. Next, the resulting composite samples were calcined at 550 °C for 4 h. The composite zeolites after calcination were denoted as A1, A2, A3, A4, and A5 for the amorphous silica–alumina (ASA), γ-alumina, η-Al2O3, SiO2, and attapulgite materials, respectively.
Table 1 Composition of prepared catalysts
| Sample ID |
Materials composited with ZSM-5 zeolite (%) |
| ASA |
γ-Alumina |
η-Al2O3 |
SiO2 |
Attapulgite |
ZSM-5 (%) |
| A1 |
30 |
— |
— |
— |
— |
70 |
| A2 |
— |
30 |
— |
— |
— |
70 |
| A3 |
— |
— |
30 |
— |
— |
70 |
| A4 |
— |
— |
— |
30 |
— |
70 |
| A5 |
— |
— |
— |
— |
30 |
70 |
| ZSM-5 |
— |
— |
— |
— |
— |
100 |
2.3 Characterization of composite catalysts
The phase purity and crystalline structure of the prepared composite zeolites were analyzed by X-ray powder diffraction (XRPD) analysis using an X-ray diffraction apparatus equipped with Cu Kα radiation source (Theta–Theta, Stoe Company). The results of this analysis were obtained in the 2θ range of 5–60°. To assess the change in the acidic site properties of the catalysts upon calcination, temperature-programmed desorption of ammonia (TPDA) was carried out using a micromeritics TPD 2900 apparatus equipped with a thermal conductivity detector (TCD). To determine the morphology and size of the particles and crystals of the composite zeolites, SEM images were recorded using a Zeiss SIGMA VP-FESEM instrument by field emission scanning electron microscopy (FESEM). The specific surface area, average pore size, and pore volume of the samples were quantified using a Micromeritics ASAP2000 adsorption and desorption N2 apparatus. Each sample was preheated and degassed at 450 °C for 3 h. The specific surface area, mesopore volume, and pore size distribution were calculated using the Brunauer–Emmett–Teller (BET) at −196 °C, Barrett–Joyner–Halenda (BJH), and t-plot methods. The change in functional groups due to the compositing process of the prepared zeolite catalysts were evaluated using a Bruker FTIR spectrophotometer (PerkinElmer Company) in the wavenumber range of 400–4000 cm−1. After the catalytic test, the coke formation on the composite catalysts was investigated by thermogravimetric analysis (TGA) using a Mettler Toledo (TGA/SDTA-851) instrument at 800 °C at the rate of 20 °C min−1 in an atmospheric flow.
2.4 Catalytic performance evaluation
The performance of the prepared composite catalysts in the n-hexane to olefin reaction (HTO) was evaluated in a tubular fixed bed quartz reactor, as shown in Fig. 1, at atmospheric pressure. In each reactor test, 0.67 g of each composite catalyst (30–50 mesh) was diluted with 0.33 g quartz (g composite![[thin space (1/6-em)]](https://www.rsc.org/images/entities/char_2009.gif) :
:![[thin space (1/6-em)]](https://www.rsc.org/images/entities/char_2009.gif) g quartz = 2
g quartz = 2![[thin space (1/6-em)]](https://www.rsc.org/images/entities/char_2009.gif) :
:![[thin space (1/6-em)]](https://www.rsc.org/images/entities/char_2009.gif) 1) and installed into the center of the reactor because the thermocouple was set in the center of the catalyst bed. The reactor was heated to 550 °C under an N2 flow N-hexane (99.89% pure, water 0.005 wt%) was introduced in the reactor after passing the preheater zone using a syringe pump and N2 carrier gas was introduced through a mass flow controller (MFC). The reaction was conducted under WHSV = 4 h−1; N2 = 40 cm3; and heating rate = 5 °C min−1 gas and liquid products were collected every 30 min after passing the bath circulator separator and the collected products were analyzed using a GC instrument equipped with an HP-Plot-Q capillary column, TCD, and FID detector. The N-hexane conversion, selectivity of products, and light olefin yield were calculated using eqn (1)–(3). All data were collected after 4 h of reaction.
1) and installed into the center of the reactor because the thermocouple was set in the center of the catalyst bed. The reactor was heated to 550 °C under an N2 flow N-hexane (99.89% pure, water 0.005 wt%) was introduced in the reactor after passing the preheater zone using a syringe pump and N2 carrier gas was introduced through a mass flow controller (MFC). The reaction was conducted under WHSV = 4 h−1; N2 = 40 cm3; and heating rate = 5 °C min−1 gas and liquid products were collected every 30 min after passing the bath circulator separator and the collected products were analyzed using a GC instrument equipped with an HP-Plot-Q capillary column, TCD, and FID detector. The N-hexane conversion, selectivity of products, and light olefin yield were calculated using eqn (1)–(3). All data were collected after 4 h of reaction.| |
 | (1) |
| |
 | (2) |
| | |
Light olefin yield (%) = n-hexane conversion × selectivity of light olefins/100
| (3) |
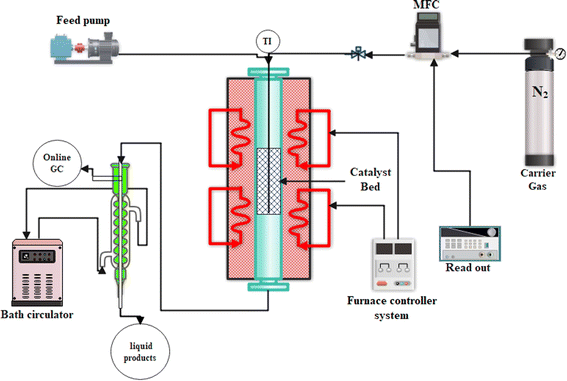 |
| | Fig. 1 Setup of catalytic cracking reactor to test the prepared catalytic samples. | |
3 Result and discussion
3.1 Catalyst characterization
3.1.1 XRD analysis. Fig. 2 displays the XRD patterns of the composite catalysts and simple ZSM-5. The XRD pattern of ZSM-5 exhibits major peaks at 2θ = 7.97°, 8.81°, 23.08°, 23.95°, and 24.41° associated with the plane of the pentasil MFI framework, corresponding to the (101), (200), (332), (303), and (133) Bragg reflections, respectively.6,36,37 These results are consistent with the standard card (JCPDS No. 00-044-0003), indicating the high purity of ZSM-5.38 According to Fig. 2, the XRD patterns of all composite samples showed peaks in the same location as the simple zeolite peaks, suggesting that the material species for all the catalysts was dispersed homogeneously on ZSM-5 and their presence did not have harsh effects on the original structure of the ZSM-5 zeolite. Alternatively, the noticeable decrease in the intensity of the characteristic peaks in the 2θ range of 22.5–25° illustrates the slight decrease in the crystallinity of all the composite samples. This was expected due to the extruding process.39,40
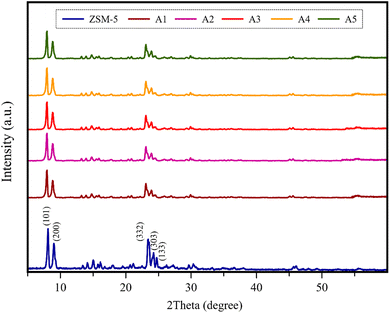 |
| | Fig. 2 XRD patterns of all the catalyst samples. | |
3.1.2 FT-IR analysis. Fig. 3 shows the Fourier transform infrared (FTIR) spectra of the composite catalysts and ZSM-5 sample in the range of 400–4000 cm−1. The vibrations of ZSM-5 indicate four absorption bands related to the bending vibrations of the T–O (T: Si, Al) bonds, asymmetrical tensile vibrations of the double five-numbered ring of the MFI zeolite, symmetrical tensile vibrations of the T–O bonds, and asymmetrical tensile vibrations of the T–O bonds at 453, 547, 802, and 1104 cm−1, respectively.41–43 The absorption band at around 1225 cm−1 is related to the external asymmetric tensile vibrations and shows the formation of ZSM-5 crystal structures, including four five-membered rings arranged around the two-dimensional torsion axis.44 The presence of all these vibrations in the above-mentioned spectral regions in all the composite samples indicates that the ZSM-5 zeolite framework was maintained after the extruding process.
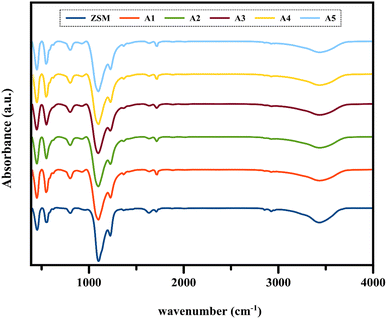 |
| | Fig. 3 FT-IR analysis of all the catalyst samples. | |
3.1.3 NH3-TPD analysis. In Fig. 4 shows the temperature-programmed desorption of ammonia (TPDA) plots, which were employed to determine the total acidity, acid distribution, and power of the acidic site of the different samples. The amount of ammonia desorbed in the higher temperature range of 400–650 °C is usually attributed to the strong acid sites, in the lower temperature range of 200–250 °C attributed to the weak acid sites of the catalysts, and in the intermediate temperature range of 300–400 °C attributed to the intermediate acid sites of the catalysts in terms of acidic power.6,45,46 The amount of different acidic sites (weak, medium, and strong) in all catalysts is summarized in Table 2. According to Table 2, the comparison between the NH3 desorption profiles of the ZSM-5 sample and the composite samples indicated in increase in total acidity for all the samples.
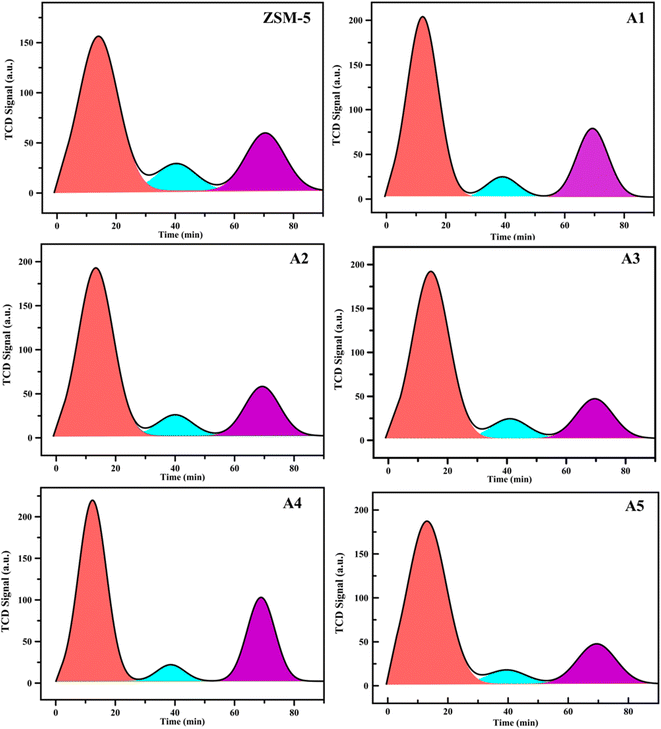 |
| | Fig. 4 NH3-TPD profiles of the samples. | |
Table 2 NH3-TPD data for the catalytic samples
| Samples |
Acidity type (mmol g−1) |
Strong\weak |
| Total acidity |
Weak (T °C) |
Medium (T °C) |
Strong (T °C) |
| ZSM-5 |
0.86 |
0.51 (225) |
0.07 (356) |
0.28 (610) |
0.549 |
| A1 |
1.02 |
0.7 (223) |
0.07 (348) |
0.25 (602) |
0.357 |
| A2 |
1 |
0.68 (221) |
0.06 (357) |
0.26 (612) |
0.382 |
| A3 |
0.92 |
0.69 (224) |
0.06 (352) |
0.17 (605) |
0.246 |
| A4 |
1.26 |
0.70 (226) |
0.08 (349) |
0.48 (598) |
0.685 |
| A5 |
1.01 |
0.61 (228) |
0.09 (358) |
0.31 (608) |
0.508 |
3.1.4 BET analysis. The N2 adsorption–desorption isotherms of the different samples are shown in Fig. 5. According to the IUPAC classification, all the catalysts showed a combination of types I and IV isotherms, with an H4 hysteresis loop, while the A5 sample has an H3 hysteresis loop.47,48 This proves the presence of micropores, indicating strong adsorption at a low relative pressure. Additionally, the hysteresis loop at a high relative pressure (0.4–1) provides evidence of the presence of a mesoporous structure in all the samples.6,39,49 Larger hysteresis loops were observed for A1 and A2 samples, which may be due to the higher number of mesopores in these samples compared to the other samples. The results of the nitrogen adsorption–desorption analysis including Brunauer–Emmett–Teller (BET) surface area, average pore size, and pore volumes are reported in Table 3. The ZSM-5 sample had the lowest mesopore volume based on its microporous nature compared to the other samples. In all the prepared composite samples, the mesoporous volume increased and the microporous volume did not change significantly. This phenomenon indicates that the presence of the materials used to prepare the composites did not change the microporous structure of the zeolite. Also, according to the results of this analysis, it can be concluded that the surface area of the composite samples further decreased due to the loss of crystallinity, which is consistent with the results of the XRPD analysis.
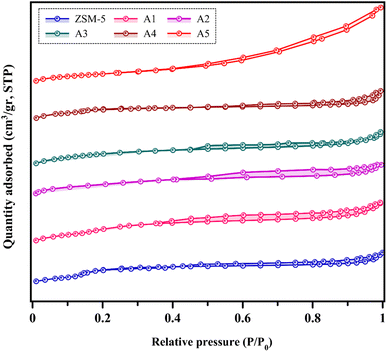 |
| | Fig. 5 Nitrogen adsorption–desorption isotherms. | |
Table 3 Textural properties of the catalyst samples
| Catalyst |
Crystallinitya (%) |
Surface area (m2 g−1) |
Volume (cm3 g−1) |
Df (nm) |
HFg |
| SBETb |
Sexternalc |
Sext/SBET |
Vtotal |
Vmicropored |
Vmesoporee |
| Determined via XRD analysis. Specific surface area calculated by the BET method. External surface area calculated by the t-plot method. Micropore volume obtained by the t-plot method. Mesopore volumes calculated by subtracting the micropore volume from the total volume. Average pore diameter, which is the adsorption average pore width (4 V/A by BET). HF = hierarchical factor= (Vmicro/Vpores)(Sext/SBET). |
| ZSM-5 |
100 |
405 |
117 |
0.28 |
0.190 |
0.086 |
0.104 |
1.87 |
0.130 |
| A1 |
93 |
364 |
245 |
0.67 |
0.309 |
0.081 |
0.228 |
3.39 |
0.176 |
| A2 |
94 |
387 |
281 |
0.72 |
0.322 |
0.080 |
0.242 |
3.32 |
0.180 |
| A3 |
92 |
365 |
202 |
0.55 |
0.286 |
0.082 |
0.204 |
3.13 |
0.158 |
| A4 |
91 |
350 |
170 |
0.48 |
0.259 |
0.083 |
0.176 |
2.96 |
0.155 |
| A5 |
92 |
375 |
192 |
0.51 |
0.273 |
0.084 |
0.189 |
2.91 |
0.157 |
3.1.5 FESEM images. The field-emission scanning electron microscopy (FE-SEM) images are presented in Fig. 6. According to these images, the ZSM-5 zeolite sample has a specific polyhedral geometry. In all the prepared composite samples, the specific polyhedral geometry of the ZSM-5 zeolite is clearly recognized and it can be seen that the materials used for the synthesis of the composites did not alter the morphology of the ZSM-5 zeolite sample significantly. Also, these materials are well distributed on the constituent particles of the ZSM-5 zeolite without changing its overall crystal structure of the specific polyhedral geometry.50–52 The loss of surface area is mainly attributed to the introduction of the materials used for the synthesis of the composites, and particularly their coverage of the zeolite particles. Interestingly, the crystalline structure of the prepared composite samples was not destroyed after extrusion and calcination.
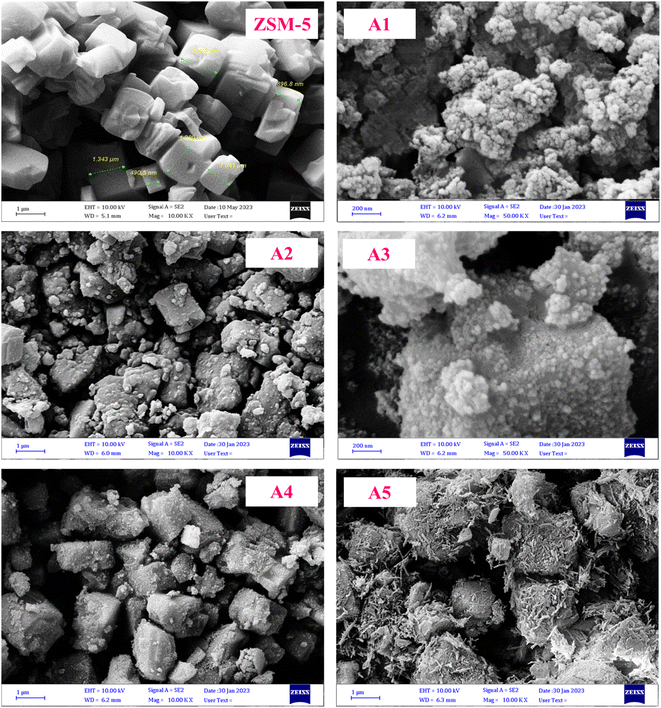 |
| | Fig. 6 FE-SEM images of the catalyst samples. | |
3.2 Coke formation during HTO reaction over the catalyst samples
3.2.1 Thermogravimetric analysis. The used catalysts were collected after 4 h of n-hexane catalytic cracking reaction at 550 °C, and then analyzed by thermogravimetric analysis (TGA) to specify the coke species deposited on the catalyst during the cracking process. The TG curves of the different catalysts are shown in Fig. 7, indicating the weight loss of each catalyst. The weight loss at a high temperature is related to the burning of the coke deposited in the used samples53,54 and this weight loss in all the samples decreased with an increase in mesopore volume.55 This indicates that samples A2 and A1 with the highest mesopores of 0.242 and 0.228 cm3 g−1, respectively, may slow down the coke formation rate and enable the precipitation of the coke species to the pores and mouth pores quickly, thus leading to an increase in the lifetime of the catalyst and demonstrating the resistance of these composites to coke deposition compared to other samples.6
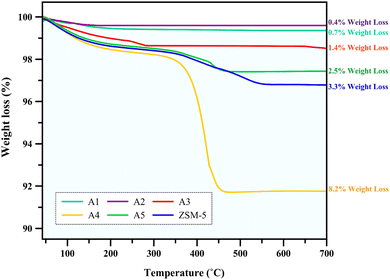 |
| | Fig. 7 TG curves of the spent catalysts. | |
3.3 Catalytic performances of the catalyst samples in HTO catalytic cracking process
The reactor test of n-hexane catalytic cracking was performed over the synthesized catalyst composites and ZSM-5 sample with a WHSV of 4 h−1. Fig. 8 and Table 4 display the distribution of products for all the catalytic samples. According to the results in Table 4 and it can be seen that the highest conversion of n-hexane and the maximum production of light olefins, as well as the lowest production of light alkanes (C1–C4), and BTX as the precursor for coke production were achieved with the A2, A1, A3, A5, ZSM-5, and A4 catalysts, respectively. The catalytic cracking activity, selectivity for each product, and coke deposition during the catalytic cracking of alkanes depend on the acidic and textural properties of the solid acid catalysts as zeolite catalysts.56–58 According to Table 3, the A2 sample has the best textural properties such as the highest amount of mesopores of 0.242 and the maximum hierarchical factor (HF) of 0.180 among the catalysts, especially the parent catalyst. The high values of these parameters in the modified samples compared to the parent sample illustrate that more micropores were retained and the increase in mesoporosity ratio (Sext/SBET) is greater than the decrease in microporosity ratio (Vmic/Vtotal).6,59 An increase in the amount of amount together with the approximate preservation of the micropores causes a reduction in the mass transfer limitation and a reduction in the production of aromatic molecules, which are produced as a result of the diffusion limitation. In terms of acidic properties, satisfactory catalysts should possess strong acid sites to initiate the cracking reaction by producing reactive intermediates, specific pore structures, and short diffusion paths to suppress the formation of coke precursors for the catalytic cracking of naphtha fractions. The high strong acid site density promotes the undesirable secondary reactions of hydrogen transfer and aromatization, thus decreasing the selectivity to light olefins, especially propylene. Aromatics will continue to form coke through hydride transfer reactions, alkylation, cyclization, aromatization, and dehydrogenation. According to Tables 2 and 4, the P/E ratio and propylene selectivity could be significantly improved by manipulating the acid strength distribution and the concentration of acid sites in the composite catalysts except for the A4 sample. The zeolite and A1–A5 phases in the composite are closely bonded by the interface effect, forming an additional Si–O–Al structure, which significantly affected the acidity of the composite catalyst. The physically mixed two-phase catalyst has a higher concentration of acid sites compared with ZSM-5. It should be noted that ZSM-5/A1–A5 exhibits a different density and distribution of acid sites to ZSM-5, demonstrating the presence of an interaction between the A1–A5 phase and the zeolite phase in the composite. The results reported in tables show that the high and low strong to weak acid site ratio was not suitable for the highest propylene production and reduction of BTX production, and the middle range of this ratio was suitable. Specifically, the A2 sample resulted in the highest amount of propylene production of 68.92% and it has a ratio of strong to weak acidity of 0.382, which is the middle ratio for all catalysts. This means that the presence of both strong and weak Brønsted and Lewis acid sites is required for the maximum production of light olefins and the lowest production of BTX, and thus modifications have been made to improve this ratio.60–63 Fig. 9 shows the relationship between the strong to weak acid site ratio and propylene selectivity for all the catalytic samples. The reason for the improvement in the important factors in the catalytic cracking process such as increasing the production of light olefins due to the improvement in mesoporous volume and acidic properties for catalyst A2 is the presence of γ-alumina with a high mesoporous nature, hydrothermal stability by tuning the charge density, and alleviated coke formation by modulating the surface acid strength.52 To verify the effect of the undesirable secondary reactions of hydrogen transfer and aromatization on the different catalysts, the hydrogen transfer index (HTI), which is the ratio of C3H8/C3H6, was calculated.64,65 Based on Fig. 10 and Table 2, the suitable acid properties, and subsequently hydride transfer in the A2 sample provide the highest selectivity for light olefins and lowest selectivity for undesired products (BTX). According to Fig. 10, the HTI value gradually decreased in the order of A4 > ZSM-5 > A5 > A3 > A1 > A2, whereas the propylene to ethylene ratio and light olefin yield increased. According to Table 4 and Fig. 11, the deactivation rate (rd) was calculated for all catalysts.66 The reduction in rd follows the order of A2 > A1> A3 > A5 > ZSM-5 > A4, which indicates the increase in the stability of the catalytic samples according to this trend. The stability of the catalysts in the HTO process depends on their catalytic activity and conversion of n-hexane. Compared to the recent research in the literature, the method used in this study for the preparation of efficient catalysts is easier than other methods to modify zeolites67 and the A2 catalyst showed a better yield of light olefins, conversion, and decreased selectivity toward BTX in the catalytic cracking of n-hexane.6,9,20
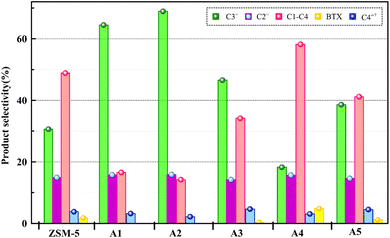 |
| | Fig. 8 Product selectivity over all the catalyst samples. | |
Table 4 Distribution of products for all the composite catalysts and the parent catalyst
| Catalysts |
ZSM-5 |
A1 |
A2 |
A3 |
A4 |
A5 |
| Conversion |
95.21 |
98.59 |
98.89 |
97.53 |
89.46 |
95.70 |
| C2= (mol%) |
14.92 |
15.78 |
15.87 |
14.21 |
15.67 |
14.61 |
| C3= (mol%) |
30.64 |
64.47 |
68.92 |
46.56 |
18.26 |
38.60 |
| P/E |
2.05 |
4.08 |
4.34 |
3.27 |
1.16 |
2.64 |
| Yield (C2= + C3=) |
43.37 |
79.11 |
83.84 |
59.26 |
30.35 |
50.92 |
| ∑(C1–C4) |
48.84 |
16.55 |
14.21 |
34.16 |
58.19 |
41.18 |
| C4+= |
3.80 |
3.20 |
2.17 |
4.67 |
3.08 |
4.51 |
 |
9.17 |
2.20 |
1.65 |
4.36 |
14.01 |
6.97 |
| BTX |
1.8 |
0 |
0 |
0.4 |
4.8 |
1.2 |
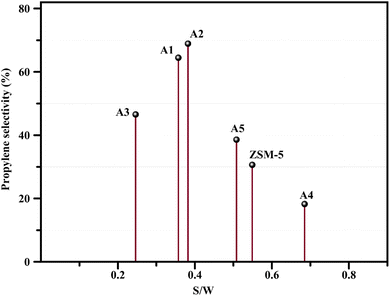 |
| | Fig. 9 Relationship between the propylene selectivity (%) and S/W ratio. | |
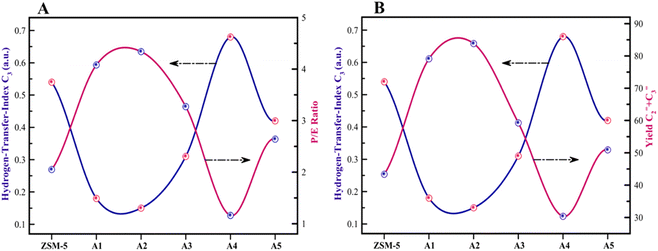 |
| | Fig. 10 (A) Relationship between the HTI values and P/E ratio. (B) Relationship between the HTI values and light olefin yield. | |
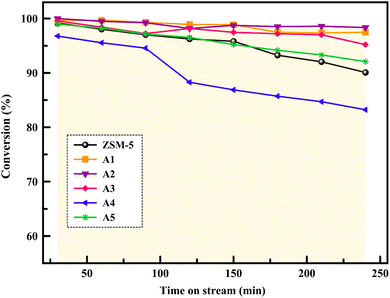 |
| | Fig. 11 Conversion of n-hexane over the samples with increasing time on stream (240 min). | |
4 Conclusion
In summary, the composition method was employed to investigate the impact of the pore size and acidic properties of composite catalysts on their catalytic performance and deactivation during HTO cracking. All the prepared composites, except the A4 sample, had better light olefin yields than the primary ZSM-5, and the light olefin yield increased and the amount of BTX as a precursor of coke decreased according to the order of A2 > A1 > A3 > A5 > ZSM-5 > A4. The results revealed that the A2 sample due to its appropriate mesoporous volume of 0.242 and appropriate strong to weak acidity ratio of 0.382 exhibited the best catalytic performance, highest light olefin yield production (83.84%), highest propylene selectivity (68.92%), and lowest coking due to the suppression of the aromatization reactions and hydrogen transfer. The increase in the amount of mesoporosity and the appropriate amount of strong to weak acidity ratio resulted in the maximum light olefin yield and prevented secondary reactions on the produced light olefins in the A2 sample.
Conflicts of interest
There are no conflicts to declare.
References
- A. Akah, J. Williams and M. Ghrami, Catal. Surv. Asia, 2019, 23, 265–276 CrossRef CAS.
- Z. Gholami, F. Gholami, Z. Tišler, M. Tomas and M. Vakili, Energies, 2021, 14, 1089 CrossRef CAS.
- N. Rahimi and R. Karimzadeh, Appl. Catal., A, 2011, 398, 1–17 CrossRef CAS.
- J. Wang, J. Shan, Y. Tian, T. Zhu, H. Duan, X. He, C. Qiao and G. Liu, Fuel, 2021, 306, 121725 CrossRef CAS.
- X. Xiao, B. Sun, P. Wang, X. Fan, L. Kong, Z. Xie, B. Liu and Z. Zhao, Microporous Mesoporous Mater., 2022, 330, 111621 CrossRef CAS.
- M. Ghazimoradi, N. Safari, S. Soltanali and H. Ghassabzadeh, Microporous Mesoporous Mater., 2023, 112486 CrossRef CAS.
- Z. Ma, X. Hou, B. Chen, L. Zhao, E. Yuan and T. Cui, Chin. J. Chem. Eng., 2023, 55, 165–172 CrossRef.
- A. A. Al-Absi, A. M. Aitani and S. S. Al-Khattaf, J. Anal. Appl. Pyrolysis, 2020, 145, 104705 CrossRef CAS.
- E. N. Al-Shafei, M. Z. Albahar, M. F. Aljishi, A. N. Aljishi, G. A. Nasser, M. A. Sanhoob, A. S. Alnasir and A. AlAsseel, Fuel, 2022, 321, 124089 CrossRef CAS.
- A. Tanimu, G. Tanimu, H. Alasiri and A. Aitani, Energy Fuels, 2022, 36, 5152–5166 CrossRef CAS.
- E. T. C. Vogt and B. M. Weckhuysen, Chem. Soc. Rev., 2015, 44, 7342–7370 RSC.
- M. A. Sanhoob, E. N. Shafei, A. Khan, G. A. Nasser, I. Bakare, O. Muraza, M. Z. Al-Bahar, A. N. Al-Jishi, H. H. Al-Badairy and A. C. Ummer, ACS Omega, 2022, 7, 10317–10329 CrossRef CAS PubMed.
- E. N. Al-Shafei, M. Z. Albahar, M. F. Aljishi, A. Akah, A. N. Aljishi and A. Alasseel, RSC Adv., 2022, 12, 25465–25477 RSC.
- P. Wang, X. Xiao, Y. Pan, Z. Zhao, G. Jiang, Z. Zhang, F. Meng, Y. Li, X. Fan and L. Kong, Catalysts, 2022, 12, 351 CrossRef CAS.
- F. Chen, J. Hao, Y. Yu, D. Cheng and X. Zhan, Microporous Mesoporous Mater., 2022, 330, 111575 CrossRef CAS.
- B. Siddiqui, A. M. Aitani, M. R. Saeed and S. Al-Khattaf, Top. Catal., 2010, 53, 1387–1393 CrossRef.
- S. M. Alipour, Chin. J. Catal., 2016, 37, 671–680 CrossRef.
- S. Mardiana, N. J. Azhari, T. Ilmi and G. T. M. Kadja, Fuel, 2022, 309, 122119 CrossRef CAS.
- E. R. Naranov, K. I. Dement'Ev, I. M. Gerzeliev, N. V. Kolesnichenko, E. A. Roldugina and A. L. Maksimov, Pet. Chem., 2019, 59, 247–261 CrossRef CAS.
- M. R. Sakha, P. Halimitabrizi, S. Soltanali, F. Ektefa, Z. Hajjar and D. Salari, RSC Adv., 2023, 13, 7514–7523 RSC.
- M. R. Sakha, S. Soltanali, D. Salari, M. Rashidzadeh and P. Halimitabrizi, J. Solid State Chem., 2021, 321, 122342 CrossRef.
- R. Palos, E. Rodríguez, A. Gutiérrez, J. Bilbao and J. M. Arandes, Fuel, 2022, 309, 122055 CrossRef CAS.
- R. Javaid, K. Urata, S. Furukawa and T. Komatsu, Appl. Catal., A, 2015, 491, 100–105 CrossRef CAS.
- K. A. Cumming and B. W. Wojciechowski, Catal. Rev., 1996, 38, 101–157 CrossRef CAS.
- J. Fals, C. A. T. Toloza, E. Puello-Polo, E. Márquez and F. J. Méndez, Heliyon, 2023, 9, e15408 CrossRef CAS PubMed.
- X. Hou, W. Zhu, Y. Tian, Y. Qiu, Z. Diao, F. Feng, X. Zhang and G. Liu, Microporous Mesoporous Mater., 2019, 276, 41–51 CrossRef CAS.
- E. Rodríguez, R. Palos, A. Gutiérrez, J. M. Arandes and J. Bilbao, Ind. Eng. Chem. Res., 2019, 58, 5158–5167 CrossRef.
- S. M. Sadrameli, Fuel, 2015, 140, 102–115 CrossRef CAS.
- D. Duan, Y. Zhang, J. Li, L. Huang, Z. Xu, Y. Zhang, W. Sun, Q. Wang and R. Ruan, Fuel, 2023, 331, 125757 CrossRef CAS.
- L. Yu, J. Zhou and W. Wang, J. Solid State Chem., 2023, 322, 123989 CrossRef CAS.
- M. Misk, G. Joly, P. Magnoux, M. Guisnet and S. Jullian, Microporous Mesoporous Mater., 2000, 40, 197–204 CrossRef CAS.
- S. Zhou, C. Zhang, Y. Li, Y. Luo and X. Shu, Ind. Eng. Chem. Res., 2020, 59, 5576–5582 CrossRef CAS.
- G. T. Whiting, F. Meirer, M. M. Mertens, A. Bons, B. M. Weiss, P. A. Stevens, E. de Smit and B. M. Weckhuysen, ChemCatChem, 2015, 7, 1312–1321 CrossRef CAS PubMed.
- Q. Tang, H. Xu, Y. Zheng, J. Wang, H. Li and J. Zhang, Appl. Catal., A, 2012, 413, 36–42 CrossRef.
- H. Karami, S. Soltanali, A. M. Najafi, M. Ghazimoradi, E. Yaghoobpour and A. Abbasi, Appl. Catal., A, 2023, 658, 119167 CrossRef CAS.
- F. Gorzin, J. T. Darian, F. Yaripour and S. M. Mousavi, J. Porous Mater., 2019, 26, 1407–1425 CrossRef CAS.
- W.-Y. Dong, Y.-J. Sun, H.-Y. He and Y.-C. Long, Microporous Mesoporous Mater., 1999, 32, 93–100 CrossRef CAS.
- I. N. Azreena, H. L. N. Lau, N. Asikin-Mijan, M. A. Hassan, S. M. Izham, M. S. Gamal, W. N. A. W. Khalit, M. Arumugam, E. Kennedy and M. Stockenhuber, J. Anal. Appl. Pyrolysis, 2022, 161, 105406 CrossRef.
- A. M. Najafi, S. Soltanali, F. Khorashe and H. Ghassabzadeh, Chemosphere, 2023, 324, 138275 CrossRef CAS PubMed.
- V. Babic, Microporous Mesoporous Mater., 2021, 329, 111513 CrossRef.
- H. Karami, M. Kazemeini, S. Soltanali and M. Rashidzadeh, Microporous Mesoporous Mater., 2022, 332, 111704 CrossRef CAS.
- F. Gorzin and F. Yaripour, Res. Chem. Intermed., 2019, 45, 261–285 CrossRef CAS.
- A. M. Najafi, S. Soltanali and H. Ghassabzadeh, Chem. Eng. J., 2023, 143719 CrossRef CAS.
- R. Le Van Mao, T. S. Le, M. Fairbairn, A. Muntasar, S. Xiao and G. Denes, Appl. Catal., A, 1999, 185, 41–52 CrossRef.
- H. Zhou, F. Zhang, K. Ji, J. Gao, P. Liu, K. Zhang and S. Wu, Catalysts, 2021, 11, 1138 CrossRef CAS.
- Y. Shi, G. Wang, J. Mei, C. Xiao, D. Hu, A. Wang, Y. Song, Y. Ni, G. Jiang and A. Duan, ACS Omega, 2020, 5, 15576–15585 CrossRef CAS PubMed.
- H. Karami, M. Kazemeini, S. Soltanali and M. Rashidzadeh, Can. J. Chem. Eng., 2022, 100, 3357–3366 CrossRef CAS.
- K. V. Kumar, S. Gadipelli, B. Wood, K. A. Ramisetty, A. A. Stewart, C. A. Howard, D. J. L. Brett and F. Rodriguez-Reinoso, J. Mater. Chem. A, 2019, 7, 10104–10137 RSC.
- X. Zhang, D. Cheng, F. Chen and X. Zhan, Chem. Eng. Sci., 2017, 168, 352–359 CrossRef CAS.
- J. Shi, G. Zhao, J. Teng, Y. Wang and Z. Xie, Inorg. Chem. Front., 2018, 5, 2734–2738 RSC.
- Y. Wang, O. V Kikhtyanin, C. Li, X. Su, X. Bai and W. Wu, Pet. Chem., 2021, 61, 394–406 CrossRef CAS.
- L. Zeng, Y. Wang, J. Mou, F. Liu, C. Yang, T. Zhao, X. Wang and J. Cao, Int. J. Hydrogen Energy, 2020, 45, 16500–16508 CrossRef CAS.
- H. Li, B. Zhu, D. Wang, S. Fan, X. Gao, J. Zhang, Q. Ma and T. Zhao, Microporous Mesoporous Mater., 2021, 327, 111403 CrossRef CAS.
- Y. Khani, N. Kamyar, F. Bahadoran, S. S. Lam, S.-H. Jang and Y.-K. Park, Fuel, 2023, 332, 126119 CrossRef CAS.
- O. D. A. Salah Aldeen, M. Z. Mahmoud, H. S. Majdi, D. A. Mutlak and K. Fakhriddinovich Uktamov, Adv. Mater. Sci. Eng., 2022, 2022, 6165180 Search PubMed.
- J. Hao, D. Cheng, F. Chen and X. Zhan, Microporous Mesoporous Mater., 2021, 310, 110647 CrossRef CAS.
- Y. Tian, B. Zhang, H. Liang, X. Hou, L. Wang, X. Zhang and G. Liu, Appl. Catal., A, 2019, 572, 24–33 CrossRef CAS.
- M. H. M. Ahmed, O. Muraza, S. Nakaoka, A. K. Jamil, A. Mayoral, V. Sebastian, Z. H. Yamani and T. Masuda, Energy Fuels, 2017, 31, 14097–14103 CrossRef CAS.
- J. Pérez-Ramírez, D. Verboekend, A. Bonilla and S. Abelló, Adv. Funct. Mater., 2009, 19, 3972–3979 CrossRef.
- C. Li, A. Vidal-Moya, P. J. Miguel, J. Dedecek, M. Boronat and A. Corma, ACS Catal., 2018, 8, 7688–7697 CrossRef CAS.
- T. Yokoi, H. Mochizuki, T. Biligetu, Y. Wang and T. Tatsumi, Chem. Lett., 2017, 46, 798–800 CrossRef CAS.
- E. Epelde, A. G. Gayubo, M. Olazar, J. Bilbao and A. T. Aguayo, Chem. Eng. J., 2014, 251, 80–91 CrossRef CAS.
- Y. Ji, H. Yang and W. Yan, Mol. Catal., 2018, 448, 91–99 CrossRef CAS.
- D. Zhang, Y. Wei, L. Xu, F. Chang, Z. Liu, S. Meng, B.-L. Su and Z. Liu, Microporous Mesoporous Mater., 2008, 116, 684–692 CrossRef CAS.
- Ø. Mikkelsen and S. Kolboe, Microporous Mesoporous Mater., 1999, 29, 173–184 CrossRef.
- X. He, Y. Tian, L. Guo, C. Qiao and G. Liu, J. Anal. Appl. Pyrolysis, 2022, 105550 CrossRef CAS.
- X. Jia, W. Khan, Z. Wu, J. Choi and A. C. K. Yip, Adv. Powder Technol., 2019, 30, 467–484 CrossRef CAS.
|
| This journal is © The Royal Society of Chemistry 2023 |
Click here to see how this site uses Cookies. View our privacy policy here.  Open Access Article
 *,
Hamid Karami,
Hamid Ghassabzadeh and
Javad Bakhtiari
![[thin space (1/6-em)]](https://www.rsc.org/images/entities/char_2009.gif) :
:![[thin space (1/6-em)]](https://www.rsc.org/images/entities/char_2009.gif) 70) in a mortar. The details of the composition of the prepared catalysts are presented in Table 1. After kneading the composite physical mixtures and getting the appropriate plasticity for extrusion, the paste-like mixtures were placed inside a cylindrical extruder and passed through a die with a diameter of 2 mm, which created a smooth cylindrical shape. The cylindrical composites were dried at ambient temperature under a lab hood for 2 h, and subsequently all the powders were dried in an oven overnight. Next, the resulting composite samples were calcined at 550 °C for 4 h. The composite zeolites after calcination were denoted as A1, A2, A3, A4, and A5 for the amorphous silica–alumina (ASA), γ-alumina, η-Al2O3, SiO2, and attapulgite materials, respectively.
70) in a mortar. The details of the composition of the prepared catalysts are presented in Table 1. After kneading the composite physical mixtures and getting the appropriate plasticity for extrusion, the paste-like mixtures were placed inside a cylindrical extruder and passed through a die with a diameter of 2 mm, which created a smooth cylindrical shape. The cylindrical composites were dried at ambient temperature under a lab hood for 2 h, and subsequently all the powders were dried in an oven overnight. Next, the resulting composite samples were calcined at 550 °C for 4 h. The composite zeolites after calcination were denoted as A1, A2, A3, A4, and A5 for the amorphous silica–alumina (ASA), γ-alumina, η-Al2O3, SiO2, and attapulgite materials, respectively.
![[thin space (1/6-em)]](https://www.rsc.org/images/entities/char_2009.gif) :
:![[thin space (1/6-em)]](https://www.rsc.org/images/entities/char_2009.gif) g quartz = 2
g quartz = 2![[thin space (1/6-em)]](https://www.rsc.org/images/entities/char_2009.gif) :
:![[thin space (1/6-em)]](https://www.rsc.org/images/entities/char_2009.gif) 1) and installed into the center of the reactor because the thermocouple was set in the center of the catalyst bed. The reactor was heated to 550 °C under an N2 flow N-hexane (99.89% pure, water 0.005 wt%) was introduced in the reactor after passing the preheater zone using a syringe pump and N2 carrier gas was introduced through a mass flow controller (MFC). The reaction was conducted under WHSV = 4 h−1; N2 = 40 cm3; and heating rate = 5 °C min−1 gas and liquid products were collected every 30 min after passing the bath circulator separator and the collected products were analyzed using a GC instrument equipped with an HP-Plot-Q capillary column, TCD, and FID detector. The N-hexane conversion, selectivity of products, and light olefin yield were calculated using eqn (1)–(3). All data were collected after 4 h of reaction.
1) and installed into the center of the reactor because the thermocouple was set in the center of the catalyst bed. The reactor was heated to 550 °C under an N2 flow N-hexane (99.89% pure, water 0.005 wt%) was introduced in the reactor after passing the preheater zone using a syringe pump and N2 carrier gas was introduced through a mass flow controller (MFC). The reaction was conducted under WHSV = 4 h−1; N2 = 40 cm3; and heating rate = 5 °C min−1 gas and liquid products were collected every 30 min after passing the bath circulator separator and the collected products were analyzed using a GC instrument equipped with an HP-Plot-Q capillary column, TCD, and FID detector. The N-hexane conversion, selectivity of products, and light olefin yield were calculated using eqn (1)–(3). All data were collected after 4 h of reaction.


