
 Open Access Article
 This Open Access Article is licensed under a Creative Commons Attribution-Non Commercial 3.0 Unported Licence
Electroless Ni plated nanostructured TiO2 as a photocatalyst for solar hydrogen production†
Priyanka N. Birla,
Sudhir Arbuj ,
Manish D. Shinde,
Shany Joseph,
Sunit Rane,
Sulabha Kulkarni and
Bharat Kale*
,
Manish D. Shinde,
Shany Joseph,
Sunit Rane,
Sulabha Kulkarni and
Bharat Kale*
Centre for Materials for Electronics Technology (C-MET), Ministry of Electronics and Information Technology (MeitY), Panchavati, Pune 411008, India. E-mail: bbkale@cmet.gov.in
First published on 4th July 2023
Abstract
Herein, we have demonstrated a facile electroless Ni coated nanostructured TiO2 photocatalyst for the first time. More significantly the photocatalytic water splitting shows excellent performance for hydrogen production which is hitherto unattempted. The structural study exhibits majorly the anatase phase along with the minor rutile phase of TiO2. Interestingly, electroless nickel deposited on the TiO2 nanoparticles of size 20 nm shows a cubic structure with nanometer scale Ni coating (1–2 nm). XPS supports the existence of Ni without any oxygen impurity. The FTIR and Raman studies support the formation of TiO2 phases without any other impurities. The optical study shows a red shift in the band gap due to optimum nickel loading. The emission spectra show variation in the intensity of the peaks with Ni concentration. The vacancy defects are pronounced in lower concentrations of Ni loading which shows the formation of a huge number of charge carriers. The electroless Ni loaded TiO2 has been used as a photocatalyst for water splitting under solar light. The primary results manifest that the hydrogen evolution of electroless Ni plated TiO2 is 3.5 times higher (1600 μmol g−1 h−1) than pristine TiO2 (470 μmol g−1 h−1). As shown in the TEM images, nickel is completely electroless plated on the TiO2 surface, which accelerates the fast transport of electrons to the surface. It suppresses the electron–hole recombination drastically which is responsible for higher hydrogen evolution using electroless Ni plated TiO2. The recycling study exhibits a similar amount of hydrogen evolution at similar conditions which shows the stability of the Ni loaded sample. Interestingly, Ni powder loaded TiO2 did not show any hydrogen evolution. Hence, the approach of electroless plating of nickel over the semiconductor surface will have potential as a good photocatalyst for hydrogen evolution.
Introduction
The environment and energy have been progressively decisive issues in the last two decades, in connection with the elusive climatic changes emerging worldwide due to the vast use of fossil fuels. Thus, energy sources that are bountiful, regenerative, and free from carbon emissions are in sizable demand. Solar energy is securing a lot of attention as a sustainable and clean energy source. However, for the sake of its practical utilization, solar energy must be reconstructed into other types of energy, such as chemical fuels, electricity, heat, etc. which allow for more effective storage and conveyance. Among chemical fuels, hydrogen (H2) is quintessentially ascribed to its highest energy capacity of 143 MJ kg−1 among all materials over the globe and its emission-free superiority, generating water as the only by-product from combustion energy.1 Predominantly for the production of hydrogen some cardinal energy systems are implemented such as thermal, electrical, photonic and biochemical.2,3Considering the key energy systems, plenty of techniques were employed for the generation of hydrogen, some of them are conventional electrolysis,4–6 high-temperature electrolysis, thermochemical Cu–Cl, hybrid sulphur, Mg–Cl cycles, thermolysis, photoelectrolysis, photoelectrocatalysis, photoelectrochemical cells (PECs), photocatalysis,7 hybrid photocatalytic Cu–Cl cycles,8 and still search for finding a better technology is going on globally.
Among them, photocatalysis involving the storage of chemical energy in hydrogen molecule enabled by the solar energy is the most cost-effective way of hydrogen production having high efficiency and abundant resource of semiconductor materials such as oxides and sulphides.9,10
Commercialisation of hydrogen production through water splitting has few limitations such as low solar conversion output, fractional solar radiation adsorption range and high rate of charge carrier recombination.11,12
A dependable photocatalyst needs to fulfil important requisites like suitable band gap exhibiting efficient electron–hole separation and transport leading to surface catalytic proton reduction as well as water oxidation, and negligeable photocorrosion.12 Homogeneous photocatalysts possessing these requirements are limited and hence heterogeneous photocatalyst with two or more distinct photocatalysts needs to be employed to overcome the above drawbacks enabling the industrial scale production.13
Majority of the semiconductor photocatalysts belong to transition metal cations consisting of metal sulfides, nitrides and oxides having d0 and d10 configurations. Metal sulphide and nitride photocatalysts such as CoS2, MoS2, Ni3S2, NiCoS4, CdS, InxGa1−xN, GaN, Ta3N5 etc. are highly prone to photo-corrosion and consequently are chemically less stable.14–17
Though, metal oxides such as ZnO, WO3, Nb2O5, Ag3PO4, Bi2WO6, Ta2O5, TiO2, etc. are the most explored materials as photocatalysts, resistance to chemical, thermal and photo-corrosion, easy availability, lower production cost and wide absorption range makes TiO2 the material of choice since the time of Honda and Fujishima.18,19 Application of TiO2 in solar-light-driven photocatalysis has been limited owing to its wide bandgap of 3.2 eV which lies in the ultraviolet (UV) region comprising of only 4% of solar spectrum.
Various approaches have been ventured to overcome the drawbacks associated with TiO2 such as doping (for example with transition metal cations like Cr3+, Fe2+, Ni2+ and Rh3+, etc.)20,21 and use of noble metals (Pt,22,23 Pd, Rh,24,25 Ag and Au26,27) and transition metals like Ni, Cu, Zn, Mn, etc. as co-catalysts.11,28,29
For noble metals, cost is the hindering factor in their practical use as co-catalyst. In recent years, the transition metals like Ni-based (NiO,30 Ni2P,31 NiS,32 and NiSe2 (ref. 33)), Cu-based (Cu(OH)2,34 CuO35), and Co-based (CoO,36 Co3O4 (ref. 37)) co-catalysts have received considerable attention in the photocatalytic field, attributable to their low-cost, abundant resource, stability, facile preparation and substantial catalytic activity.11
Among these materials, nickel, a low-cost and earth abundant transition metal with a work function of nearly 5 eV has been considered as a potent alternative to noble-metal co-catalysts because it is already employed as a catalyst in many industrial chemical reactions.6,7 However, reported hydrogen generation yield of TiO2–Ni based heterogeneous photocatalytic water splitting systems is very low and there is scope for innovations.38
Liu et al. prepared Ni loaded TiO2 nanocomposite, with 6 mol% having 10–20 nm size of Ni nanoparticles around the TiO2 surface using Wet Impregnation Method.39 NiOx nanoparticles with average size of 24 nm distantly spread over the surface of titania in the 5 wt% NiOx-loaded TiO2 nanocomposite.40 (9![[thin space (1/6-em)]](https://www.rsc.org/images/entities/char_2009.gif) :1) Ni–Zn/TiO2 in which Ni content is 45 wt% displayed Ni with a diameter over 100 nm, and TiO2 nanoparticles with an averaged diameter of 25 nm.41 Ni loaded TiO2 thin films with Ni layer thickness of ∼50 nm were fabricated by Cheng et al. using the y atomic layer deposition (ALD) technique.42 NiO/Ni/TiO2 sandwich-like heterojunction with Ni layer of ∼0.5 nm grown by the co-precipitation technique over hydrothermally prepared TiO2 nanocables were grown by Ren et al.43 Most of these reports discuss about Ni nanoparticles having the larger diameters or films entirely covering the semiconductor surfaces which may limit their application as heterogeneous photocatalyst material.
:1) Ni–Zn/TiO2 in which Ni content is 45 wt% displayed Ni with a diameter over 100 nm, and TiO2 nanoparticles with an averaged diameter of 25 nm.41 Ni loaded TiO2 thin films with Ni layer thickness of ∼50 nm were fabricated by Cheng et al. using the y atomic layer deposition (ALD) technique.42 NiO/Ni/TiO2 sandwich-like heterojunction with Ni layer of ∼0.5 nm grown by the co-precipitation technique over hydrothermally prepared TiO2 nanocables were grown by Ren et al.43 Most of these reports discuss about Ni nanoparticles having the larger diameters or films entirely covering the semiconductor surfaces which may limit their application as heterogeneous photocatalyst material.
So far, many different methods, including molten-salt-mediated process,44 precipitation,45 solvothermal,46,47 sol–gel,48 electrodeposition,49 and chemical reduction,39 have been reported for synthesis of Ni@TiO2 systems.50 In this context, electroless plating which is generally used for metallization of work-pieces at macro scale, has unexpectedly emerged as a superior wet-chemical nanofabrication alternative.25
This technique, by virtue of its solution chemistry and mechanistic aspects, is capable of creating nanomaterials various shapes such as nanoparticles, nanowires, nanotubes, and ultrathin films, etc., by simply immersing suitable samples into aqueous solutions for defined amounts of time.27,51–56
It offers flexibility in the choice of the substrate to be metallized and is almost independent of its chemical composition, state (solid/liquid/gas), and morphology including gas nano-bubbles, emulsified droplets, biological micro-organisms, microfluidic channels, nanoparticles, and plastics.54–59
In view of this, preparation of Ni@TiO2 photocatalysts was herein accomplished using the in-house developed electroless Ni plating bath and the effect of Ni loading percentage on the photocatalytic hydrogen generation performance has been studied. To the best of our knowledge, preparation of Ni@TiO2 heterogeneous photocatalyst system using electroless method has not been reported. The electroless deposited catalyst has been found to be highly efficient for the hydrogen production.
Materials and methods
Materials
TiO2 nanopowders were procured from Aldrich (average particle size of 20 nm). For nickel loading commercial electrochemical bath was purchased from Grauer & Weil (India) Limited. Electrochemical commercial bath consisted of cleaning solution, mild etching solution, pre-activator, activator, Ni salt solution and reducing solution. For preparation of 10% sulphuric acid solution, 98% conc. H2SO4 procured from SRL chemicals, India was used.Material preparation
The detailed of bath preparation process has been mentioned in the ESI as Table T1,† all the solutions were prepared as per the data sheet of the manufacturer, Grauer & Weil (India) Limited. Electroless nickel loading process involves different process steps which are carried out under continuous stirring and centrifugation is followed at the end of each process step which are mentioned in the Table T2 in ESI† and Fig. 1 depicts all the processes involved together. In a typical process, TiO2 nanopowder surface was sequentially cleaned using the cleaning solution (maintained at 60 °C for 10 min), mild etching solution (4 min) and acid solution (2 min). At the end of each step, water washing was undertaken followed by centrifugation. Cleaned TiO2 nanopowder surface, was treated with pre-activator solution for 2 min. However, water rinsing was not carried out after this step. | ||
| Fig. 1 Electroless Ni loading process schematic. | ||
Preactivated TiO2 nanopowder was surface activated by administering it to activator and post activator solutions for 5 min each followed by water rinse. Subsequently, surface activated TiO2 (Fig. 2) nanopowder was subjected to Ni loading by transferring it to Ni bath maintained at the temperature of 85–90 °C and pH ∼ 5.2, for 15 min. For varying Ni loading, surface activated TiO2 nanopowders were treated with electroless Ni baths of various concentration and the samples, thus prepared, were used for photocatalytic water splitting application (Table 1).
 | ||
| Fig. 2 Ni decoration of TiO2 surface activation followed by electroless deposition method. | ||
| S. no. | Sample code (wt%) | Nickel salt solution (ml) | Reducing agent solution (ml) | Theoretical% Ni loading concentration |
|---|---|---|---|---|
| 1 | Pristine TiO2 | 0 | 0 | 0 |
| 2 | 0.05% Ni@TiO2 | 0.1 | 0.1875 | 0.05 |
| 3 | 0.1% Ni@TiO2 | 0.2 | 0.5740 | 0.1 |
| 4 | 0.2% Ni@TiO2 | 0.4 | 1.1480 | 0.2 |
| 5 | 0.3% Ni@TiO2 | 0.6 | 1.7120 | 0.3 |
| 6 | 0.4% Ni@TiO2 | 0.8 | 2.2960 | 0.4 |
| 7 | 0.5% Ni@TiO2 | 1 | 2.870 | 0.5 |
Characterization techniques
Powder X-ray diffraction patterns of the Ni@TiO2 nanopowders (XRD, Rigaku MiniFlex 600) were recorded using a Cu-Kα radiation source. X-ray photoelectron spectroscopy (XPS) was conducted using PHI Versa Probe XPS. ICP-OES measurements were done using Spectroblue, Amtek. For this study, 200 mg of sample was dissolved in 4 ml con. HNO3 and 1 ml of 30% Hydrogen Peroxide and digested in microwave digestor, diluted up to 50 ml and filtered solution was run through the calibration curve. Raman spectra were measured on a Renishaw InVia Raman microscope equipped with a 532 nm laser. Diffuse reflectance UV-visible absorbance spectra (UV-DRS) were obtained at room temperature in the range of 200–800 nm using the Shimadzu UV-vis-NIR spectrophotometer (Model UV-3600). The photoluminescence emission spectra of prepared powders were carried out by using Shimadzu (RF5301PC) spectrofluorometer at an excitation wavelength 350 nm.Fourier transform infrared (FTIR) spectroscopy measurements were carried out with a Jasco FTIR-6100 spectrometer over a range of 400–4000 cm−1. Field emission scanning electron microscopy (FESEM, Hitachi, Japan with Model S-4800) and field emission transmission electron microscopy (FETEM by JEOL; JEM-2200FS) techniques were used to perform the morphological and microstructural analysis. For typical FETEM analysis, the test sample was carefully prepared by dispersing the sample powder in de-ionized water and drop of the dispersion was then transferred to carbon coated grid. In order to acquire high imaging and spatial resolution with chemical mapping of the material, out Scanning Transmission Electron Microscopy (STEM) in bright field (BF) mode equipped with energy dispersive X-ray spectroscopy (EDS) coupled elemental mapping by using JEOL, JEM2200FS equipment operated at 200 kV with spherical aberration corrector was carried out. The porosity and surface area of the samples were examined using Brunauer–Emmett–Teller analysis (BET: Quantachrome NOVA touch LX1).
Photoelectrochemical study
Incident photon-to-current conversion efficiency (IPCE) for the prepared pristine TiO2, 0.1% Ni@TiO2 and 0.5% Ni@TiO2 nanopowders were measured in the wavelength region of 350–600 nm (PV Measurement Inc., USA) where a standard tungsten-halogen lamp as monochromatic light source with a broadband bias light for ∼1 sun light intensity was used. The measurements related to electrochemical impedance spectroscopy (EIS) were undertaken on a CH 660C electrochemical analyzer (CH Instruments, Shanghai, China) in a two-electrode configuration where the photoanode comprising the prepared nanopowders and a platinum wire were used as working and counter electrodes respectively. The transport properties of the electrons were measured using electrochemical impedance spectroscopy (EIS) in the frequency range of 10−2 to 105 Hz at an alternative signal of 10 mV. The study on transient current–time profile for the prepared pristine TiO2, 0.1% Ni@TiO2 and 0.5% Ni@TiO2 nanopowders was carried out using a Kiethley Source Measure Unit (Model 2400) under the illumination of a 1000 W xenon lamp (Oriel 91193). The homogeneity of light intensity over an 8 × 8 in2 area was confirmed by calibrating it under 1 sun light intensity (AM 1.5G, 100 mW cm−2) with a Si solar cell.Photocatalytic study
Photocatalytic hydrogen generation study of prepared Ni@TiO2 nanopowders was performed using water splitting technique by following previously reported procedure.60 For this experiment, in-house designed 100 ml capacity quartz glass reactor was employed which was sealed with the septum for collecting the evolved H2 with the help of a gas tight syringe. This water splitting mediated evolved hydrogen can then be applied to gas chromatogram (Shimadzu: Model GC 2014) for quantitatively analysing its production. The main component of this photocatalytic water splitting set up is mercury vapor lamp (400 W) as the light source fitted with continuous water circulation condenser. Such condenser absorbed the IR radiation and minimized the heating effect. For studying the photocatalytic activity of pristine TiO2 and as synthesized Ni@TiO2 nanopowders, 20 mg of sample was mixed with 25 ml of 20% methanol–water mixture in the quartz reactor and was kept under continuous stirring. Conventionally, Pt is added as the co-catalyst in a photocatalytic water splitting process. However, in the present case, Ni itself worked as co-catalyst and hence Pt was not added. The dissolved gases, if any, were removed by Ar gas purging (for 2 min). The reactor was kept in photocatalytic reactor set up under mercury vapor lamp irradiation and the evolved/produced hydrogen gas was collected at an interval of 60 min by means of a 5 ml capacity gas fitted syringe and finally hydrogen production was enumerated with the help of fitted standard curve data.Result and discussion
Structural study by XRD
X-ray diffraction patterns of TiO2 and Ni@TiO2 powders are presented in Fig. 3. The diffractograms of all the samples exhibited tetragonal crystal structure with coexistence of anatase and rutile polymorphic phases (JCPDS card no. 02-22-1272 and 02-22-1276). The ratio of anatase to rutile phase calculated by using Spurr's formula was found to be 81:19.61 The diffraction peaks present at 2θ values of 25.3, 36.7, 37.8, 38.7, 48.09, 53.74, 55.05, 62.19 and 75.15° correspond to (101), (103), (004), (112), (200), (105), (211), (213) and (215) planes of TiO2 anatase phase respectively. The diffraction peaks observed at 2θ values of 27.39, 36.05, 41.35, 54.18, 56.78, 62.69 and 68.96° are ascribable to (110), (101), (111), (211), (220), (002) and (301) planes of TiO2 rutile phase respectively.
 | ||
| Fig. 3 X-ray diffraction patterns of pristine TiO2 and Ni@TiO2 powders. | ||
No additional peaks belonging to metallic nickel was observed in Ni@TiO2 samples. This may be because of low concentration of nickel as well as electroless deposition which generally gives amorphous coating. Most of the researchers did not get Ni phase in their X-ray diffraction study of Ni@TiO2 and hence validated by XPS.40,43,62,63
X-ray photoelectron spectroscopy study
The confirmation of elemental composition as well as chemical state of 0.1% Ni loaded TiO2 nanopowder was carried out using X-ray photoelectron spectroscopy (XPS). The wide scan survey spectrum validated the presence of Ti, O, and Ni that are the three main elements present in the prepared samples (Fig. 4a). The peaks attributable to Ti 2p3/2 and Ti 2p1/2 were found at 458.8 eV and 459.0 eV, and at 464.5 eV and 464.7 eV, respectively (Fig. 4b).41,50 The binding energy difference between Ti 2p1/2 and Ti 2p3/2 was 5.68 eV, attributable to characteristic Ti–O bond of TiO2.50 The O 1s XPS spectra of 0.1% Ni loaded TiO2 nanopowders was shown in Fig. 4c which revealed their typical peak around 530.1 eV which was assigned to the lattice oxygen of the Ti–O species. Another peak at 532.5 eV related to the hydroxyl groups adsorbed on the sites of surface oxygen vacancies of the Ni@TiO2 was noticed. | ||
| Fig. 4 XPS spectra of 0.1% Ni@TiO2 powder corresponding to (a) survey scan, and deconvoluted high resolution scans corresponding to elements (b) Ti 2p, (c) O 1s and (d) Ni 2p. | ||
The XPS signal of Ni 2p peak at the binding energy of 851.83 eV (Fig. 4d) is associated with metallic Ni loaded on TiO2 surface which is consistent with other available reports.40,41 The Ni 2p XPS spectrum exhibited additional peaks at 854.76 and 872.62 eV (Fig. 4d) ascribable to the Ni2+ (2p3/2 and 2p1/2) of Ni(OH)2/NiO, their respective satellite peaks at 861.54 and 879.63 eV were observed.50,64 Thus, coexistence of metallic Ni and Ni(OH)2/NiO, is observed in XPS spectra. This coexistence of metallic Ni and Ni(OH)2/NiO is mutually beneficial. The defects in TiO2 create an electron donor via captivation of Ni2+, generating the Ni–O bonds, which closely fix metallic Ni nanoparticles on the TiO2 surface.50
ICP-OES study
ICP-OES studies of Ni@TiO2 nanopowders are presented in Table 2 which depicts that the observed wt% loading of Ni is consistent with our theoretical calculations carried out while performing the Ni loading experiments.| S. no. | Ni weight% value | |
|---|---|---|
| Theoretical | Observed | |
| 1 | 0.05% Ni@TiO2 | 0.0512 |
| 2 | 0.1% Ni@TiO2 | 0.0984 |
| 3 | 0.2% Ni@TiO2 | 0.1992 |
| 4 | 0.3% Ni@TiO2 | 0.2986 |
| 5 | 0.4% Ni@TiO2 | 0.4013 |
| 6 | 0.5% Ni@TiO2 | 0.4927 |
Raman study
According to the factor group analysis, the six different modes of anatase TiO2, namely 1A1g, 2B1g and 3Eg are the Raman active modes having the following representation (1A1g + 2B1g + 3Eg) and their reported vibrational peak positions are given in Table 3.65 Raman spectra of the Ni@TiO2 are shown in Fig. 5. Raman vibrational modes occurred at frequencies of 142 (Eg), 197 (Eg), 395 (B1g), 516 (A1g + B1g), 637 (Eg) and 793 (first overtone of B1g) cm−1 corroborated the presence of anatase crystalline phase (Fig. 5a). This Eg peak was assigned to the symmetric bending vibration of O–Ti–O in TiO2 frame. In case of Ni doping, it is reported that vibrational mode at 141 cm−1 of Ni@TiO2 samples showed an appreciable shift toward higher frequencies (from 143.2 to 145.0 cm−1) by increasing the nickel content in the photocatalyst. However, in our samples nickel loading/decoration rather than doping is carried out, hence, noticeable shift is not observed (inset of Fig. 5a).65| S. no. | Reported vibrational modes (cm−1) | Observed modes (cm−1) | |
|---|---|---|---|
| Anatase phase | Rutile phase | ||
| 1 | 144 (Eg) | 144 (B1g) | 142 |
| 2 | 199 (Eg) | — | 197 |
| 3 | 399 (B1g) | — | 395 |
| 4 | — | 448 (Eg) | 447 |
| 5 | 515 (A1g + B1g) | — | 517 |
| 6 | — | 612 (A1g) | 613 |
| 7 | 640 (Eg) | — | 637 |
| 8 | 796 (first overtone of B1g) | — | 793 |
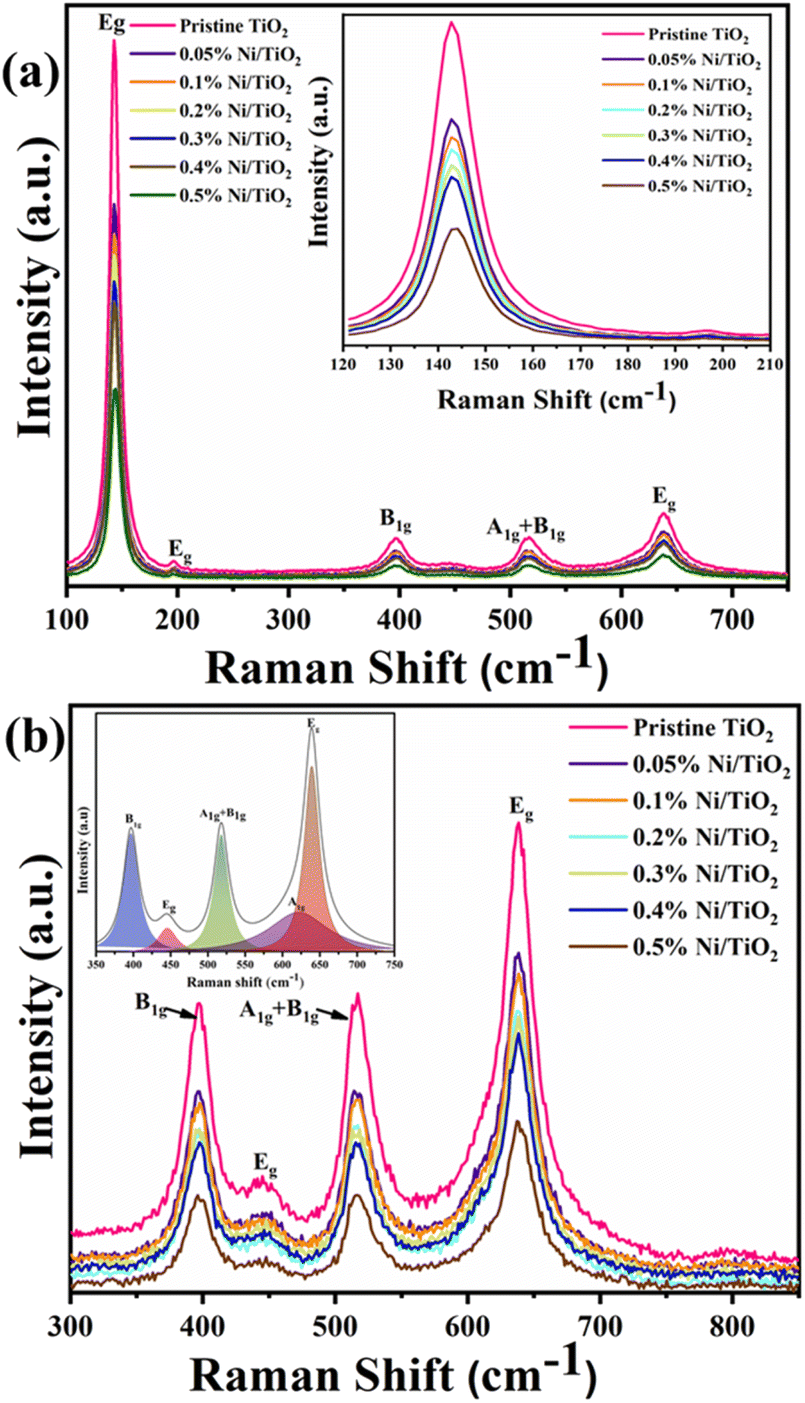 | ||
| Fig. 5 Raman spectra of pristine TiO2 and Ni@TiO2 powders for (a) major peaks depiction (inset: enlarged image of peak at 142 cm−1 due to Eg mode) and (b) major peaks in 300 to 850 cm−1 range (inset: deconvoluted peaks). | ||
Gradual decrease in the intensity of the peaks is noticed with increase in Ni loading concentration. Such quenching may be attributable to the scattering of incident radiation by the Ni on surface of TiO2 nanoparticles. Ni does not show any peaks in the Raman spectrum as Ni, a face-centred cubic (FCC) metal, has a single atom primitive unit cell and does not show any polarizability change due to the interaction between the electric field of the monochromatic light and dipole moment within the material.66
Presence of rutile phase in the sample is confirmed by observed vibrational modes assigned at 142 (B1g), 447 (Eg) and 613 (A1g) cm−1 (Fig. 5b). The shape of the band centred at 637 cm−1 indicates that there could be a shoulder to this band at the lower frequency side which is further confirmed by peak deconvolution (inset of Fig. 5b) using Lorentzian curve fitting.63,67–69 The Raman study clearly reveals the presence of anatase and rutile TiO2 phases.
UV DRS and photoluminescence study
Investigation of the band gap energies of pristine TiO2 and Ni@TiO2 nanopowders was executed using UV-DRS technique and the results are shown in Fig. 6a. When the surface of TiO2 nanopowder is decorated with Ni using electroless coating method, the absorption edges of Ni@TiO2 samples shift towards longer wavelength and a bathochromic shift (red shift) was observed which is also reported by other investigators.70–72 Red shifted absorption edge was perceived as an effect of interconnectivity between the d electrons of Ni2+ and the electrons availed from O2− and Ti4+.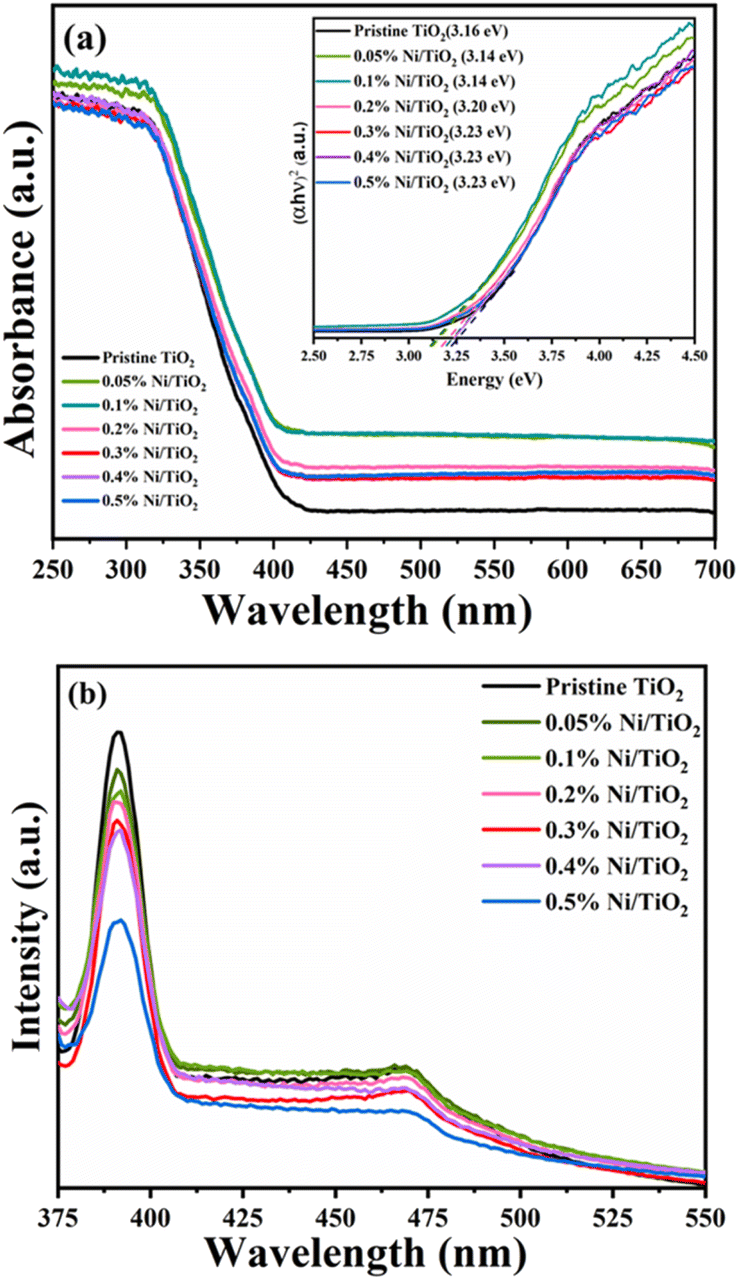 | ||
| Fig. 6 (a) UV-DRS spectra (inset: Tauc plot) and (b) PL spectra of pristine TiO2 and Ni@TiO2 nanopowders. | ||
Remarkably, for the pristine TiO2 nanopowder the edge absorbance value was observed to be at 380 nm, which increased significantly to 394, 392 nm for 0.05 and 0.1% Ni@TiO2 nanopowders and then decreased slightly to 387, 382, 382 and 382 nm, for 0.2, 0.3, 0.4 and 0.5% Ni@TiO2 nanopowders, respectively. Such slight decrease in the absorbance edge at higher Ni loading concentrations may be attributable to excessive interaction d-electrons of Ni2+ and the sp–d exchanges taking place among the electrons in the conduction band of TiO2.73 Nevertheless, the band gap energy of pristine TiO2 and 0.5, 0.1, 0.2, 0.3, 0.4 and 0.5% Ni@TiO2 nanopowders was computed to be 3.26, 3.16, 3.14, 3.20, 3.23, 3.23 and 3.23 eV, respectively by implementing Tauc plot which revealed slight red shift (inset of Fig. 5a).
Photoelectronic features of pristine TiO2 and Ni@TiO2 was reported using photoluminescence spectra and the range used is 400–800 nm. Wavelength of 350 nm sweetens well to cause the excitation of electrons suitable to understand the recombination of holes and electrons. Numerous concurrent processes occur leading to recombination/reunification of electrons and holes after their excitation by photon which are dominated by electronic stoichiometry and crystal structure.73 In Fig. 6b, the first band observed is at 391 nm (UV region) followed by a low intensity band around 470 nm (visible blue-green emission region) in all the samples. The first band is attributable to the band gap transition or the band edge emission of the host TiO2. The emission band at 470 nm can be ascribable to self-trapped excitons, oxygen vacancies, surface defects, etc. The blue-green emission band at 470 nm originated from the charge transfer from Ti3+ to oxygen anion in [TiO6]8− complex hinting at their intrinsic state nature as against the surface state.72–74
Ni2+ loading concentration on the surface of TiO2 nanopowder also plays a vital role as quencher of PL peak intensity.75 When the surface TiO2 nanopowder is decorated with nickel, it creates an epicentre which is non-radiative in nature and prevents aggressive recombination of e−/h+ pair. This phenomenon was also observed in the PL spectra of the present work (Fig. 6b) where decrease in the PL peak intensity was noted with increase of Ni loading percentage responsible for an effective charge separation and an increase of carrier mobility as compared to the pristine TiO2 sample.71,75,76 In case of samples prepared with Ni loading of 0.1 and 0.2 wt%, through the intensity of peak due to the band gap transition is decreased little bit as compared to pristine TiO2, the intensity of peak at 470 nm due to self-trapped excitons, oxygen vacancies, surface defects, etc. decreased to a more extent, which may indicate interaction d electrons of Ni2+ and the sp–d exchanges dominate the electron–hole decay process taking place among the electrons in the conduction band of TiO2.
FTIR study
FTIR analysis was executed to survey the characteristic vibration bands of Ni@TiO2 catalysts and their spectra in the wavenumber range 400–4000 cm−1 are presented in Fig. 7. In the range of 400–800 cm−1, characteristic vibration bands belonging to metal–oxygen bonds were reported.70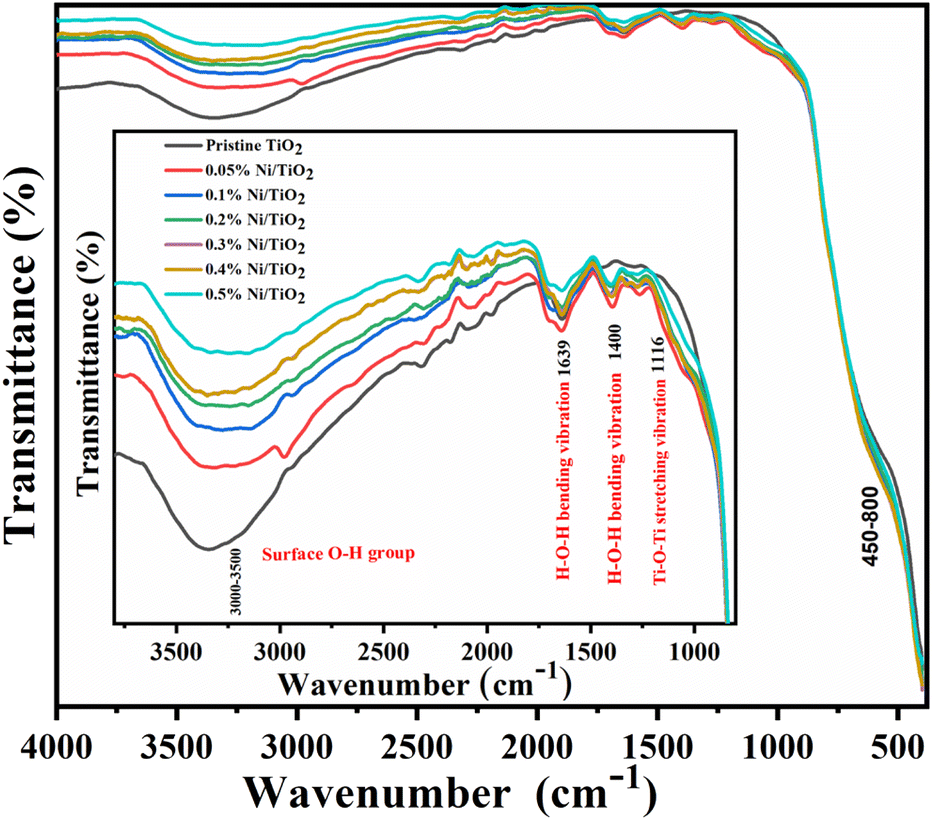 | ||
| Fig. 7 FTIR spectra of pristine TiO2 and Ni@TiO2 nanopowders (inset: enlarged region in 1000–4000 cm−1 range). | ||
From the spectra, absorption band observed in the range of 1000–1700 cm−1 is designated to water molecules adsorbed on the surface of nanostructure (H–O–H bending: 1639 cm−1) and Ti–O–Ti stretching vibration peak at 1116 cm−1.
FESEM analysis
The nanoscale morphology and shapes of pristine TiO2 and 0.05–0.5% Ni@TiO2 powders were examined by field emission scanning electron microscopy (Fig. 8). FESEM images of pristine TiO2 nanopowder show nanoparticles having spherical morphology with particle size in the range of 20–30 nm (Fig. 8a and b). After electroless Ni loading on TiO2 nanoparticles, slight increase in the particle size i.e. 35 nm was noted (Fig. 8c–l and ESI Fig. S2†).50,72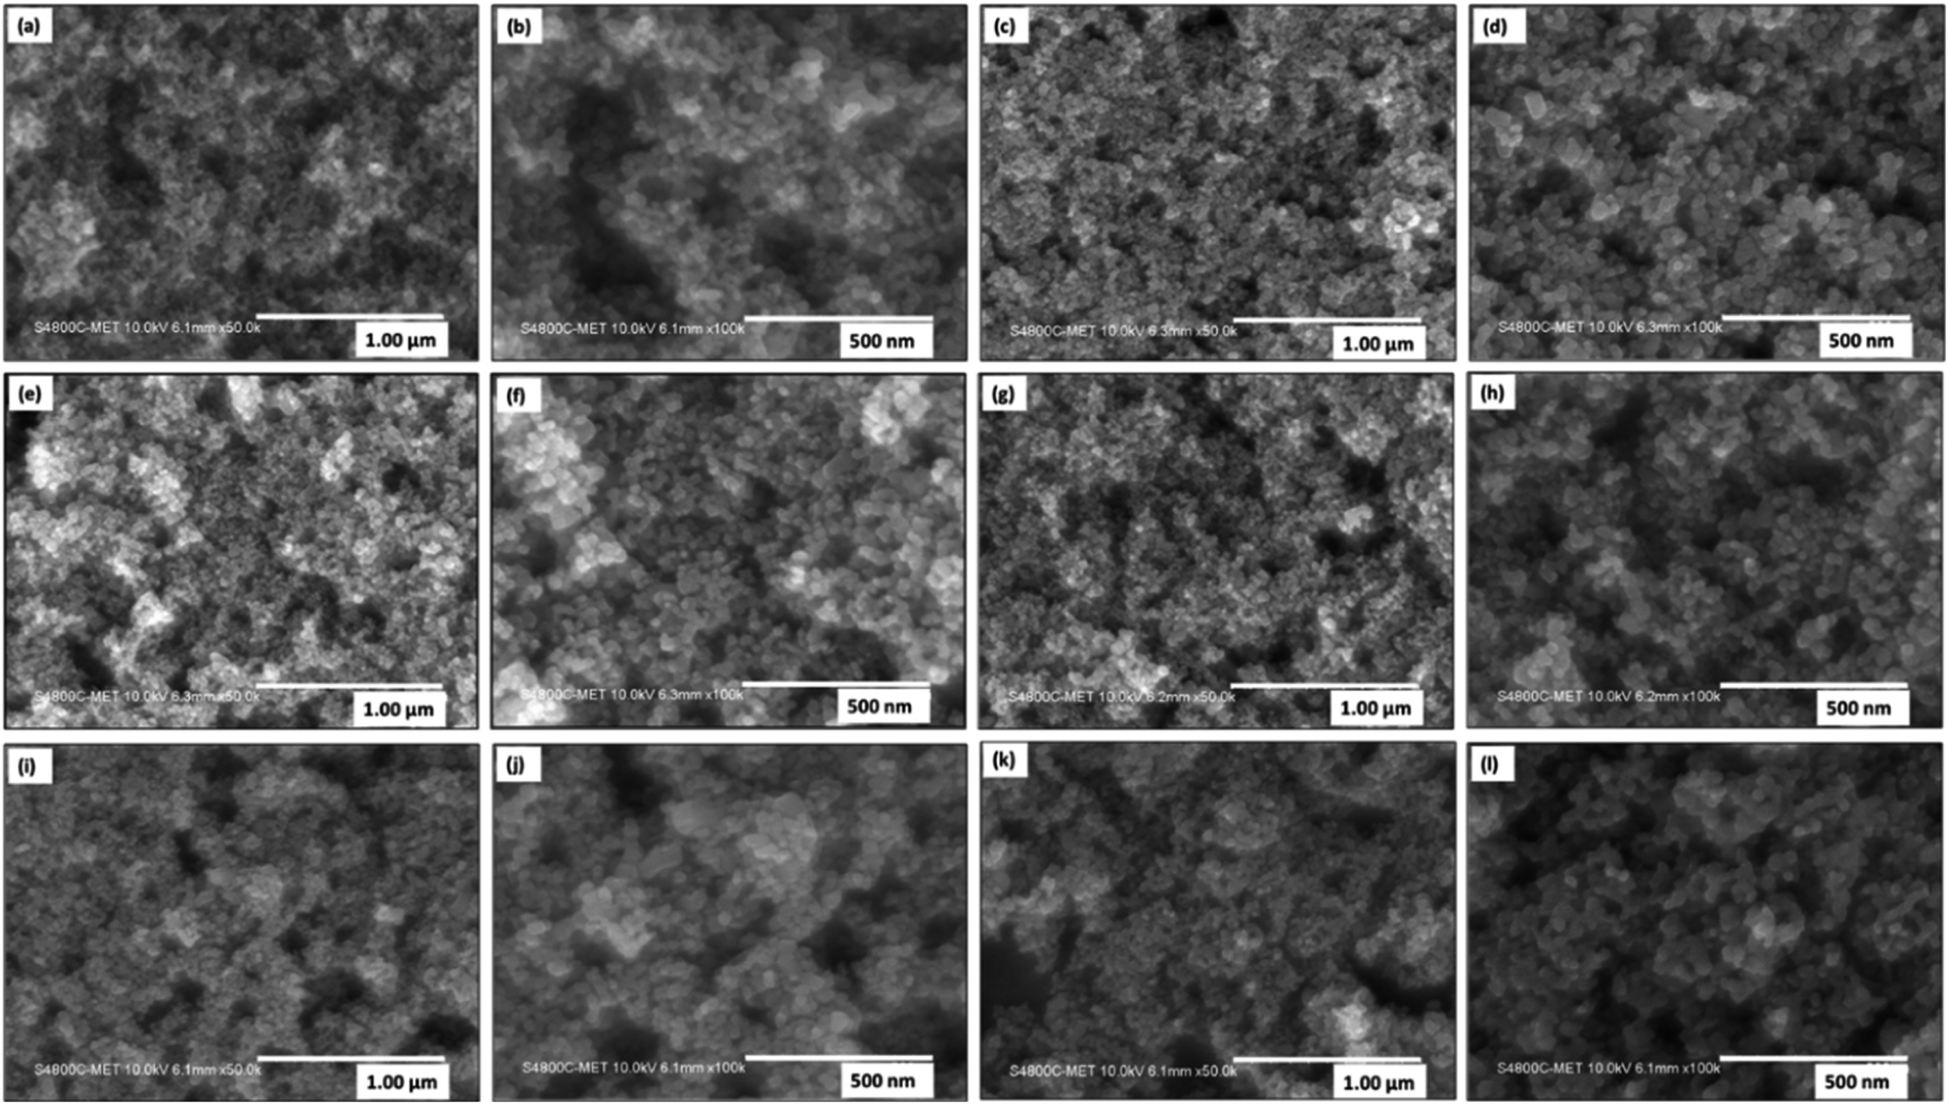 | ||
| Fig. 8 FESEM images of (a and b) pristine TiO2 and Ni@TiO2 nanopowders with respective Ni wt% loading of (c and d) 0.05, (e and f) 0.1, (g and h) 0.2, (i and j) 0.3 at (k and l) 0.4 at low and high magnification respectively. | ||
Microstructural study by FETEM
FETEM imaging
FETEM images for 0.1% Ni loaded TiO2 nanopowders are shown in Fig. 9. FETEM images at low and intermediate magnification (Fig. 9a and b) display hexagonal and cubical faceted morphologies having sharp-edged geometries. The particles are found to have an average size in the range of 20–30 nm. Loading of TiO2 sample by Ni was found to occur by two ways as seen from the high magnification images (Fig. 9c–e). Ni nanofilm were found to get intermittently deposited over TiO2 nanoparticles surface (shown by the yellow colour bordered areas in Fig. 9c and d). The width of this film was found to be in the range of 1–2 nm. Secondly, Ni nanoclusters of size around 2 nm were also observed over the surface of TiO2 nanoparticles (as indicated by the dotted circle in Fig. 9e). The analysis of lattice fringes in Fig. 9b–e reveal presence of three types of materials. Majority of the particles displayed local single crystalline nature with each particle having a different lattice orientation. For TiO2 nanoparticles, fringes with lattice spacing of 3.50, 2.29 and 1.91 Å belonging to (101), (004), (200) planes, respectively, corresponding to the anatase phase and 3.35 and 1.70 Å with planes for (110) and (211) corroborating the presence of rutile phase were noticed.77 The presence of nickel was ascertained by lattice spacing fringes with d-value of 1.98 Å with (111) plane.78 The nanocrystalline nature of the samples through selected area electron diffraction (SAED) patterns (Fig. 7f) was evinced by presence of ring like patterns that are not continuous and display regular bright spots.77 Confirmation of such morphological features due to Ni loading was carried out by obtaining more such FETEM images as displayed in ESI Fig. S4.† The SAED patterns further substantiated presence of anatase and rutile phases TiO2 when d-values from the corresponding rings were calculated and matched with XRD database. The presence of (101), (103), (004), (200), (105) and (110), (211) planes for anatase and rutile phases of TiO2 respectively and (111) plane for Ni were observed. For sake of comparison, FETEM images of 0.5% Ni@TiO2 nanopowder sample are shown in ESI Fig. S5† which also revealed the loading of TiO2 nanopowders by Ni.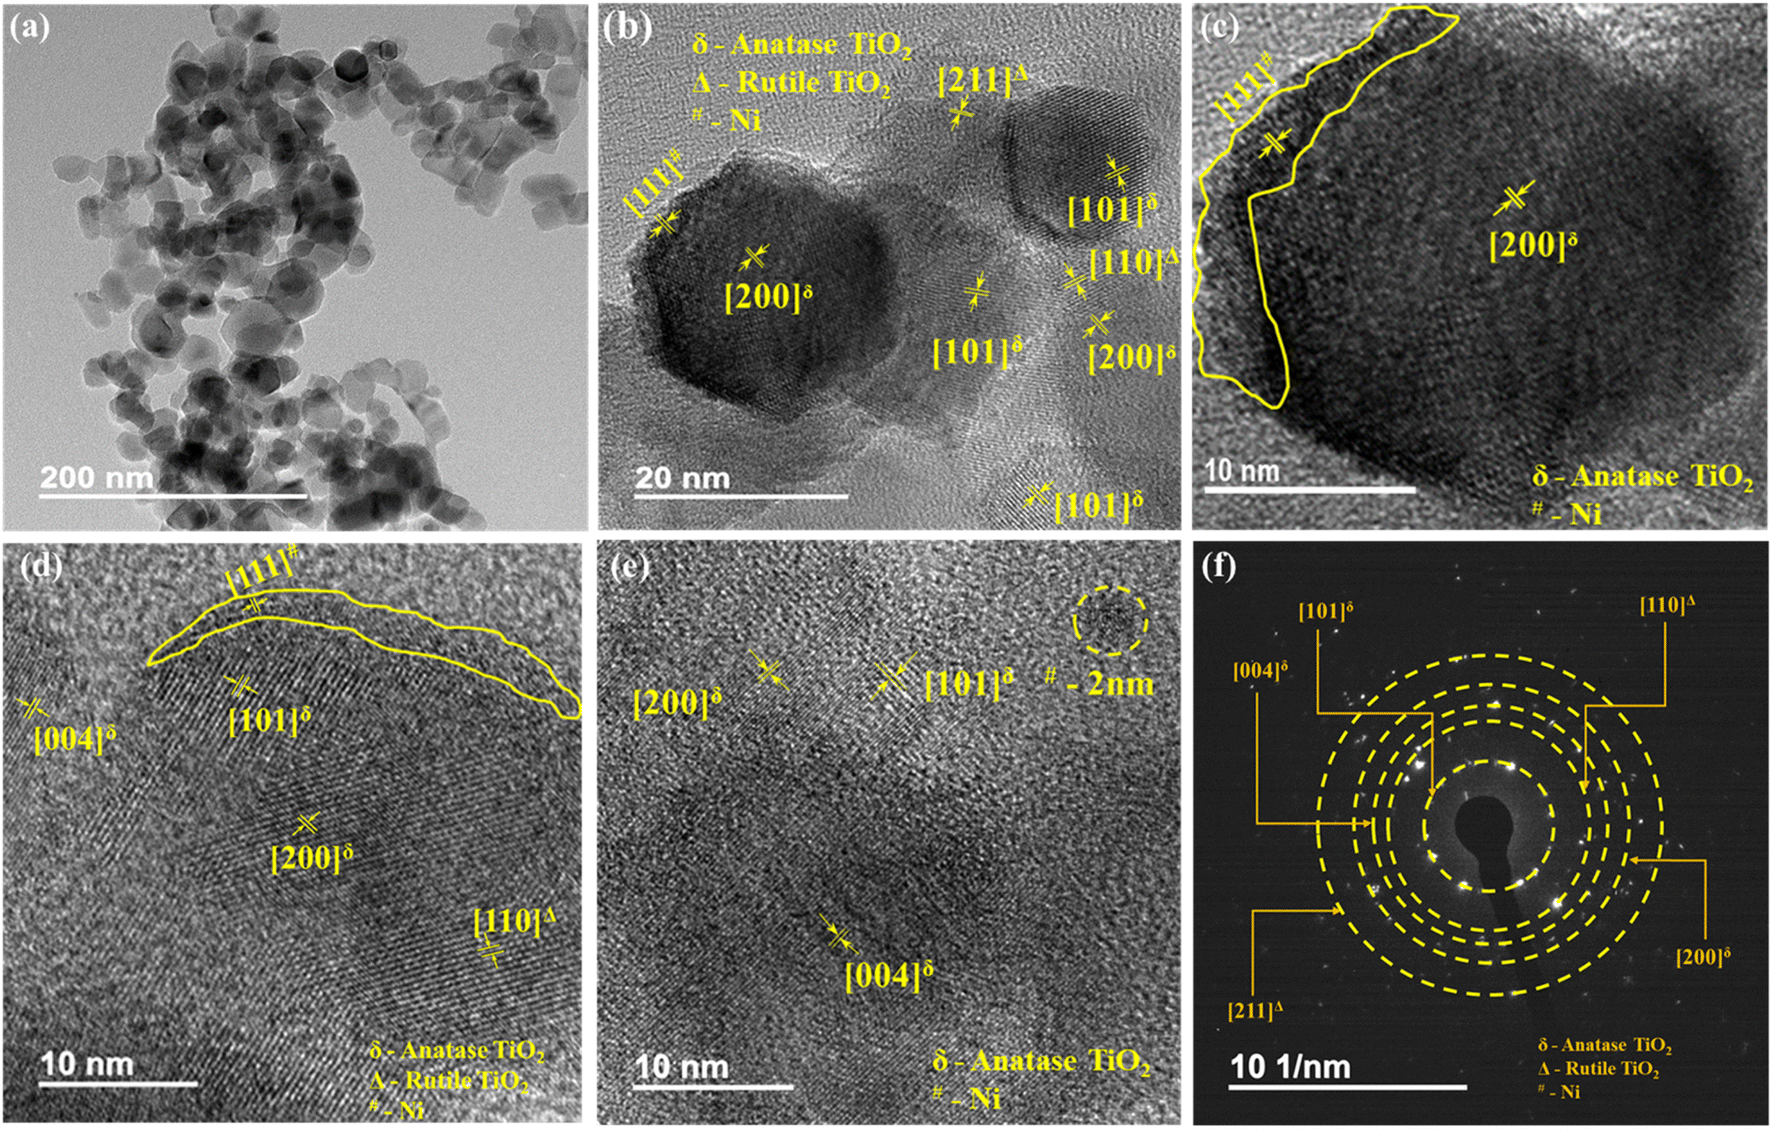 | ||
| Fig. 9 FETEM images of 0.1% Ni@TiO2 powder at (a) low magnification and their HRTEM images (b–f) the corresponding SAED pattern. | ||
FETEM-STEM-EDS analysis of 0.1 wt% Ni@TiO2 photocatalyst
The semi-quantitative qualification of elements present in the 0.1 wt% Ni@TiO2 sample was ascertained using the energy dispersive X-ray spectroscopy (EDS) analysis in scanning transmission electron microscopy (STEM) mode. Ni was loaded over TiO2 nanoparticles in weight-by-weight manner. The pertinent FETEM-EDS spectrum for 0.1 wt% Ni@TiO2 sample with tabulated quantitative data is presented in Fig. 10a and its inset. The EDS spectrum of 0.1 Ni@TiO2 catalyst revealed the presence of Ti, O and Ni and disclosed the presence of 65.24 wt% of titanium, 34.68 wt% of oxygen and 0.08 wt% of Ni.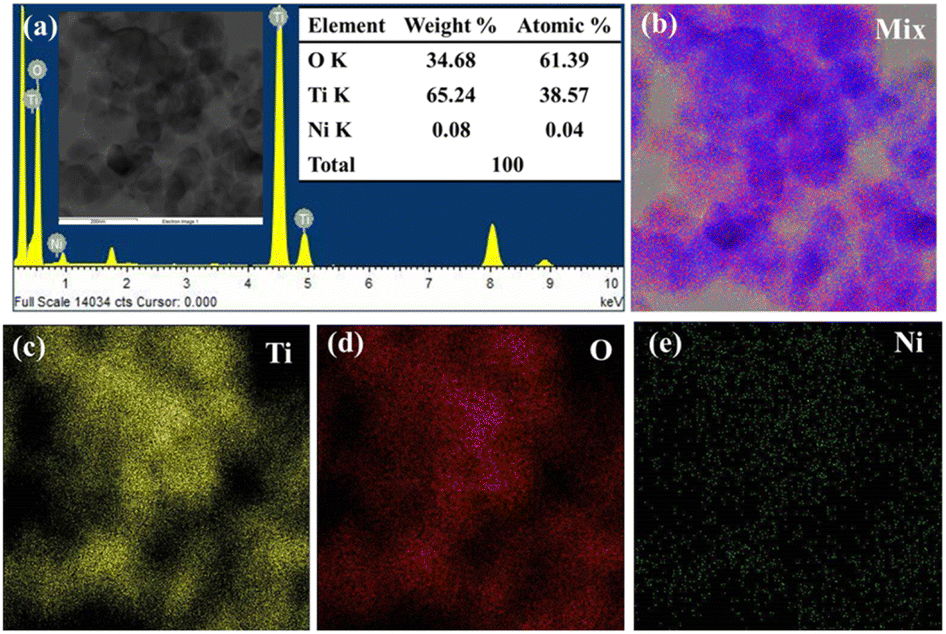 | ||
| Fig. 10 FETEM-STEM-EDS elemental mapping images of 0.1% Ni@TiO2 nanopowders: (a) EDS spectra (inset: electron image of selected region and its quantitative EDS data) and its elemental mapping images for (b) elemental mix, (c) Ti, (d) O and (e) Ni. | ||
This weight percentage of Ni is close to the calculated value and it is obvious that the XRD pattern did not illustrate any Ni peaks. Thus, EDS and XPS analysis data agreed well with each other (Fig. 4). EDS-elemental mapping images of 0.1 Ni/TiO2 sample in STEM mode are shown in Fig. 10. The electron image (given in inset of Fig. 10a) and elemental mapping images ascribable to Ti and O (Fig. 10c and d, respectively) correlated well and overlapped with elemental mapping images for Ni also (Fig. 10e) and confirmed the surface loading of Ni over TiO2 nanoparticles. Higher intensity of the colours allocated to Ti and O as compared to Ni was noticed which was tangible as very low amount of nickel was used for the surface loading of TiO2. FETEM images were in tune with FESEM images.
BET surface area analysis
Fig. 11 displayed the N2 adsorption–desorption isotherms of pristine TiO2 and Ni–TiO2 composites with varying doses of nickel loading from 0.05 to 0.5 wt%. Both pristine TiO2 and Ni@TiO2 composites revealed type IV nitrogen adsorption–desorption isotherms possessing type H3 hysteresis loops. Table 4 summarized the specific surface area, total pore volume and BJH pore sizes of the as-prepared TiO2 and Ni@TiO2 photocatalyst samples. Till 0.1 wt% Ni loading, the surface area of Ni@TiO2 nanopowders was found to increase to 61.54 m2 g−1 from 45.72 m2 g−1 for pristine TiO2. Further increasing the Ni impregnation on TiO2 surface above 0.1%, gradual reduction in the BET surface area was observed. It is postulated that when Ni loading amount is small (0.05 and 0.1 wt%), occupation of nucleation sites by Ni2+ species on TiO2 surface leads to generation of Ni dots. As per TEM images the Ni coating is observed on the particles which might be amorphous after aggregation of Ni dots. At higher concentration electroless nickel plating is intense which might be blocking the surface of TiO2 which is responsible for lowering the surface area.60,79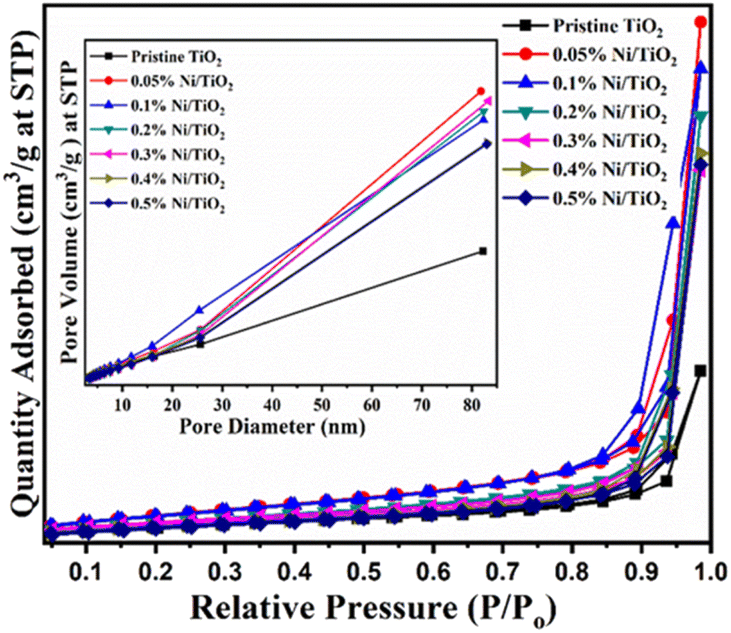 | ||
| Fig. 11 BET surface area graphs of pristine TiO2 and Ni@TiO2 nanopowders (inset: plot of pore diameter vs. pore volume). | ||
| Samples | BET surface area (m2 g−1) | Total pore volume (cm3 g−1) | BJH pore size (nm) | H2 generation (μmol g−1 h−1) | AQEa (%) |
|---|---|---|---|---|---|
| a AQE calculated for per gram of sample. | |||||
| Pristine TiO2 | 45.7 | 0.47359 | 3.37834 | 470 | 3.04 |
| 0.05% Ni@TiO2 | 58.3 | 0.38659 | 3.36268 | 987 | 6.40 |
| 0.1% Ni@TiO2 | 61.5 | 0.2194 | 3.35446 | 1600 | 10.38 |
| 0.2% Ni@TiO2 | 52.6 | 0.39147 | 3.36362 | 1141 | 7.40 |
| 0.3% Ni@TiO2 | 49.2 | 0.42826 | 3.36568 | 1106 | 7.175 |
| 0.4% Ni@TiO2 | 47.8 | 0.43754 | 3.36374 | 1103 | 7.156 |
| 0.5% Ni@TiO2 | 46.6 | 0.45623 | 3.36992 | 997 | 6.468 |
Photoelectrochemical study
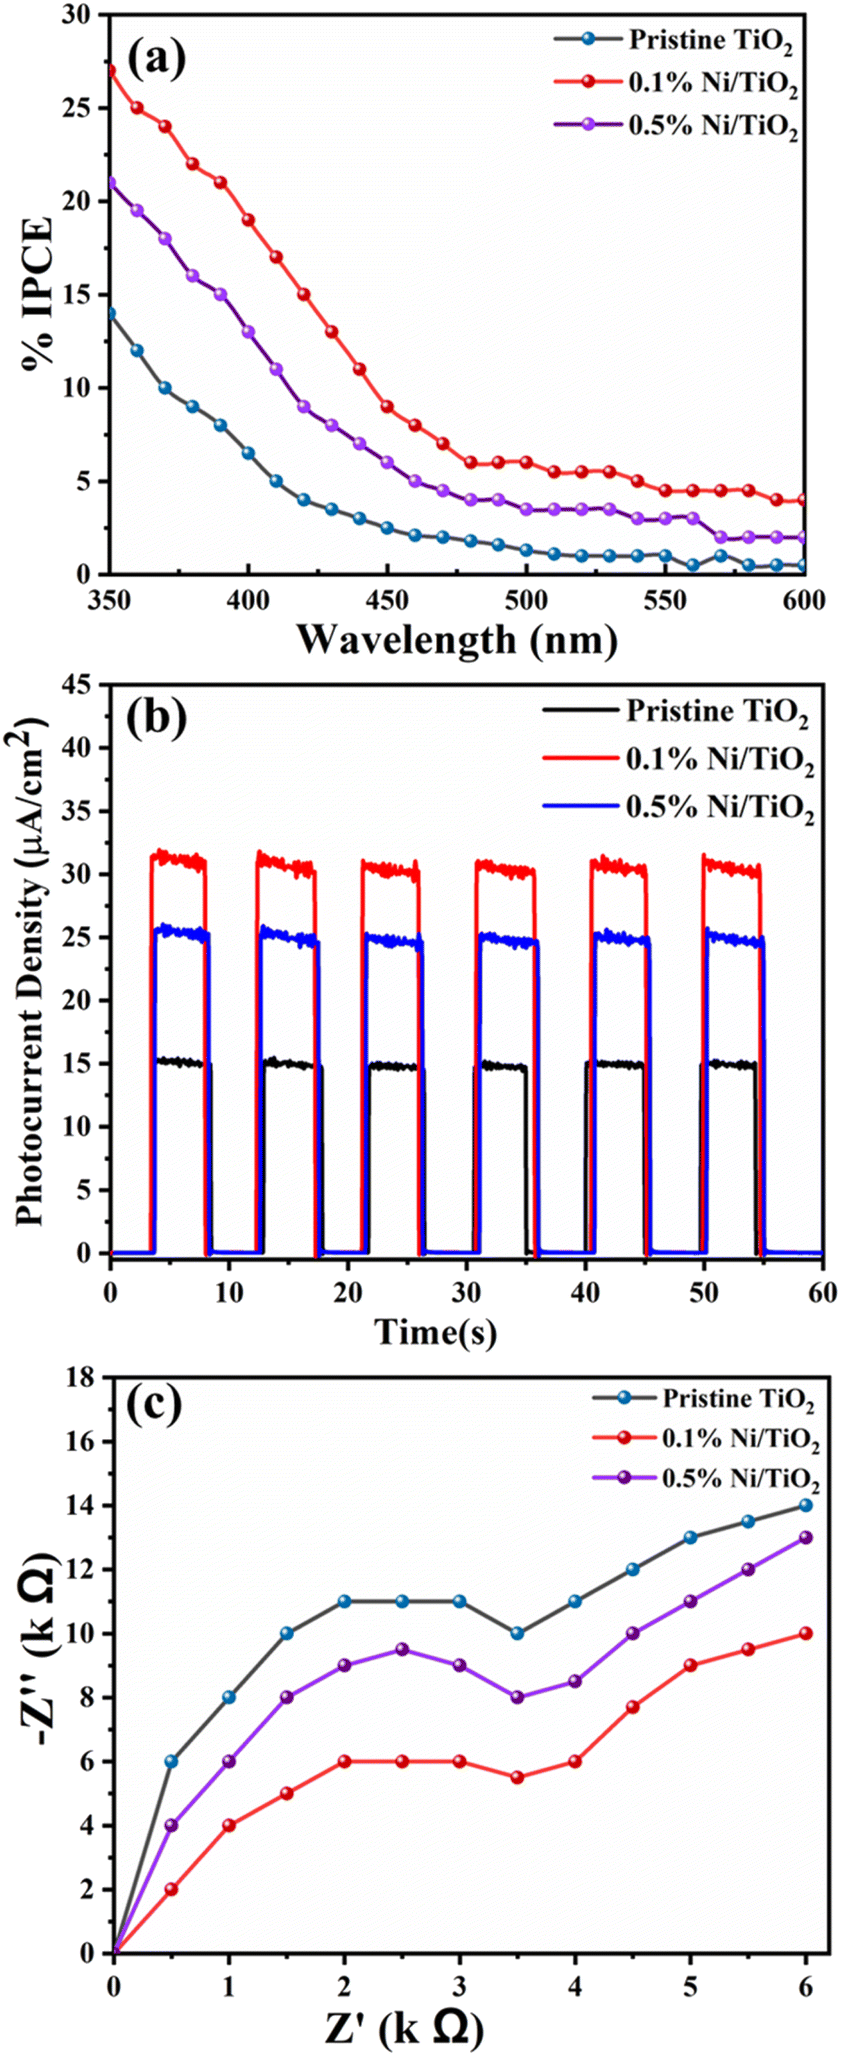 | ||
| Fig. 12 Photoelectrochemical study of Ni@TiO2 nanopowders. (a) IPCE vs. wavelength plot, (b) transient current–time profile and (c) Nyquist plot. | ||
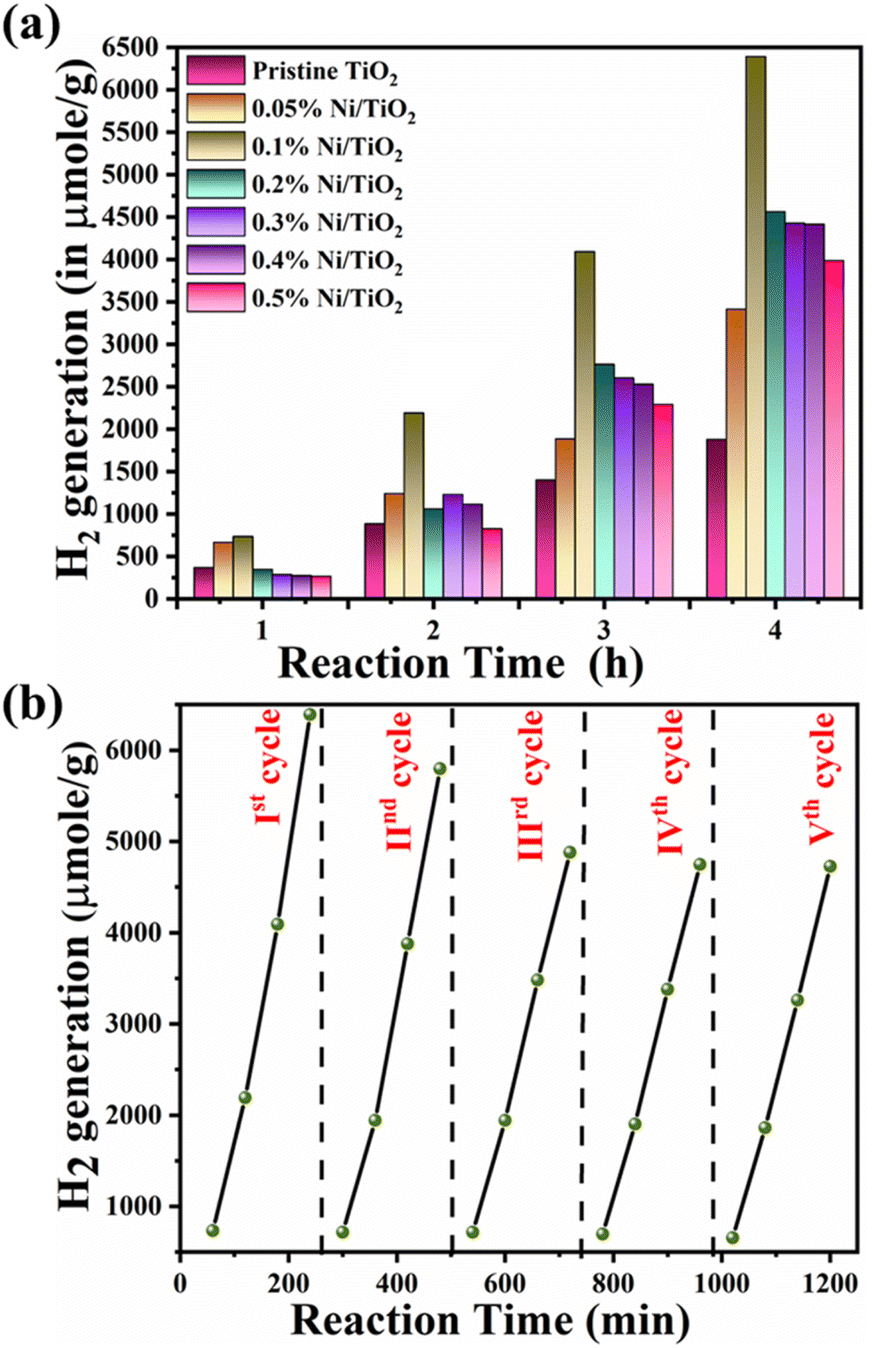 | ||
| Fig. 13 (a) H2 generation performance of pristine TiO2 and Ni@TiO2 nanopowders and (b) recyclability study for 0.1% Ni@TiO2 nanopowder. | ||
In electroless coating method, semiconductor surface was first cleaned, activated and then metallic loading was undertaken which might be helpful for uniform decoration of Ni on TiO2. It may be noted that Ni nanoparticles generated on TiO2 are not just adhered to the surface by physical forces, but chemically through sp–d exchanges. Additionally, presence of nickel obliterated necessity of Pt, a commonly used co-catalyst in water splitting reactions which makes the process economical. Recyclability study of 0.1% Ni@TiO2 photocatalyst was also carried out and the results are shown in Fig. 13b. The decrease in the photocatalytic activity from 6391 μmol g−1 to 5795, 4878, 4748 and 4728 μmol g−1 in the 2nd, 3rd, 4th and 5th cycles correspond to loss of 90.67%, 76.32%, 74.29% and 73.97% respectively than the initial photocatalytic activity. However, these losses are attributed to the material loss during the processing and washing of the catalysts after first cycle. The 20, 18 mg of catalysts are used for 1st, 2nd respectively and for 3rd cycle onwards 16 mg of catalyst was used. It showed almost similar hydrogen evolution for three cycles, ultimately revealing the good stability of the photocatalyst. FETEM images of recycled 0.1% Ni/TiO2 nanopowder photocatalyst are given in ESI Fig. S6† which also revealed the stability of the photocatalyst by the presence of Ni over TiO2 nanoparticles.
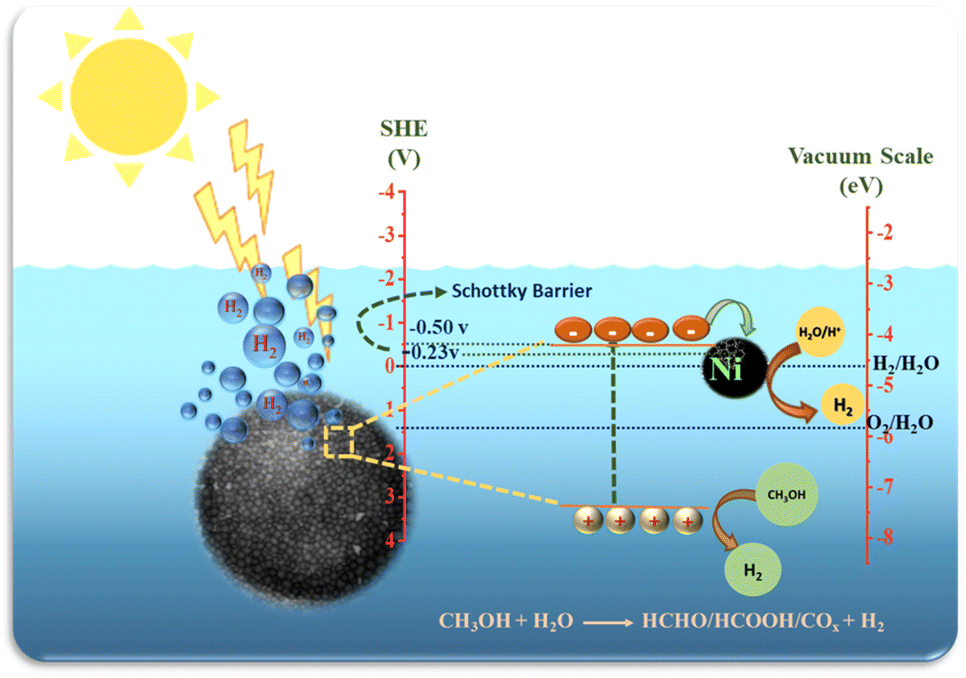 | ||
| Fig. 14 Mechanism of photocatalytic H2 generation of prepared Ni@TiO2 nanopowders. | ||
In photocatalytic H2 generation with methanol as sacrificial agent, photogenerated electrons are used to combine with protons in water to generate H2, while the methanol molecules get oxidized by capturing excess photogenerated holes through a series of reactions finally yielding three hydrogen molecules as given in eqn (1).
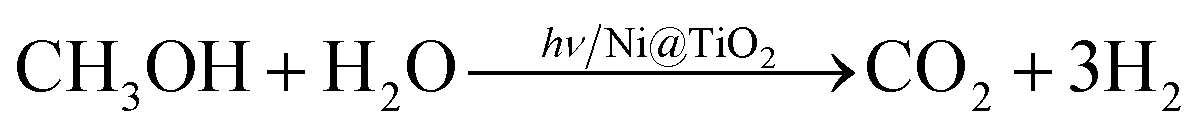 | (1) |
Ni loaded on TiO2 as co-catalysts, absorbs photogenerated electrons to promote the separation and transfer of interface charge carriers, but also provide efficient proton reduction centres.82
It may be noted that the CB level of TiO2 is −0.50 V above the H2 evolution potentials and that of Ni is just −0.23 V and this potential gradient helps in transformation of photoexcited electrons from CB of TiO2 to Ni nanoparticles which subsequently react with H+ ions generated by oxidation of water to form H2 gas.
Beyond the optimized loading, the decreased in the photocatalytic activity was found. In this context, it may be noted the photocatalytic hydrogen generation results corroborate well with BET and PL spectroscopy results. BET surface area was found to increase for Ni decorated TiO2 nanopowders than pristine TiO2 up to 1 wt% Ni loading and then decreased gradually. Similarly, quenching in PL intensity peak and the peak due to presence of defects was noted (Fig. 5b). Both these phenomena were attributed to the density of non-radiative epicentres (causing the increase in Ni particle size as well as defect centres) which, in turn, are responsible for recombination of electron–hole pairs and ultimately reflects on the photocatalytic activity.
Conclusion
Nickel-decorated TiO2 photocatalytic system proficient of responding to visible light was successfully synthesized by autocatalytic deposition (electroless) method. In this study, nickel loading wt% increased on the TiO2 nanopowder surface as a function of Ni concentration in electroless bath. The existence of metallic Ni (in the form of nanocluster and intermittent films) that was uniformly infused onto the TiO2 nanopowder surface was observed in the FETEM images which was further confirmed by EDS (and allied elemental mapping images) and XPS spectroscopy techniques. Ni2+ loading concentration on the surface of TiO2 nanopowder also plays a vital role as quencher of PL peak intensity and as an effective charge separator. The further enhancement of photocatalytic efficacy for Ni@TiO2 nanopowders than pristine TiO2 nanopowder might be due to the effective electron accepter property of Ni and the Schottky barrier formation between these two materials. 0.1% Ni@TiO2 nanopowder exhibited the optimized hydrogen generation rate of ∼1600 μmol g−1 h−1 which is ∼3.5 times higher as compared to pristine TiO2 nanopowder (470 μmol g−1 h−1) and the photocatalyst exhibited fairly good repeatable behaviour. In nutshell, electroless-plating is an efficient technique to decorate TiO2 nanopowder surface using nickel which can not only serve as an efficient and cost-effective heterogeneous photocatalyst but in other applications like gas sensors.Author contributions
The experiments have been planned by B. B. K., S. B. R., S. K. K., S. J. and P. N. B. performed the experiment. The data were analysed by P. N. B., M. D. S. and S. S. A. All the authors participated in writing the manuscript under the lead of B. B. K.Conflicts of interest
There are no conflicts to declare.Acknowledgements
The authors are thankful to the HRD/Knowledge Management Division, Ministry of Electronics and Information Technology (MeitY) and Department of Science and Technology (DST) KIRAN Division for DST Women Scientist fellowship (DST/WOS-A/CS-14/2021) New Delhi.References
- Y. Li and S. C. E. Tsang, Mater. Today Sustain., 2020, 9, 100032 CrossRef
.
- S. Chen, D. Huang, P. Xu, W. Xue, L. Lei, M. Cheng, R. Wang, X. Liu and R. Deng, J. Mater. Chem. A, 2020, 8, 2286–2322 RSC
- C. Acar, I. Dincer and G. F. Naterer, Int. J. Energy Res., 2016, 40, 1449–1473 CrossRef CAS
- L. Sun, Q. Luo, Z. Dai and F. Ma, Coord. Chem. Rev., 2021, 444, 214049 CrossRef CAS
- M. Pein, N. C. Neumann, L. J. Venstrom, J. Vieten, M. Roeb and C. Sattler, Int. J. Hydrogen Energy, 2021, 46, 24909–24918 CrossRef CAS
- Z. P. Ifkovits, J. M. Evans, M. C. Meier, K. M. Papadantonakis and N. S. Lewis, Energy Environ. Sci., 2021, 14, 4740–4759 RSC
- T. Hisatomi, J. Kubota and K. Domen, Chem. Soc. Rev., 2014, 43, 7520–7535 RSC
- T. A. H. Ratlamwala and I. Dincer, Int. J. Hydrogen Energy, 2014, 39, 20744–20753 CrossRef CAS
- S. Chen, T. Takata and K. Domen, Nat. Rev. Mater., 2017, 2, 17050 CrossRef CAS
- S. Pasternak and Y. Paz, ChemPhysChem, 2013, 14, 2059–2070 CrossRef CAS PubMed
- X. Liu and H. Zhuang, Int. J. Energy Res., 2021, 45, 1480–1495 CrossRef CAS
- Z. Wang, C. Li and K. Domen, Chem. Soc. Rev., 2019, 48, 2109–2125 RSC
- T. S. Teets and D. G. Nocera, Chem. Commun., 2011, 47, 9268–9274 RSC
- Z. Kang, H. Guo, J. Wu, X. Sun, Z. Zhang, Q. Liao, S. Zhang, H. Si, P. Wu, L. Wang and Y. Zhang, Adv. Funct. Mater., 2019, 29, 1–10 Search PubMed
- X. Ning and G. Lu, Nanoscale, 2020, 12, 1213–1223 RSC
- Y. Wang, Y. Wu, K. Sun and Z. Mi, Mater. Horiz., 2019, 6, 1454–1462 RSC
- N. T. Thanh Truc, N. Thi Hanh, D. T. Nguyen, H. T. Trang, V. N. Nguyen, M. N. Ha, T. D. C. Nguyen and T. D. Pham, J. Solid State Chem., 2019, 269, 361–366 CrossRef CAS
- A. Fujishima and K. Honda, Nature, 1972, 238, 37–38 CrossRef CAS PubMed
- C. Karthikeyan, P. Arunachalam, K. Ramachandran, A. M. Al-Mayouf and S. Karuppuchamy, J. Alloys Compd., 2020, 828, 154281 CrossRef CAS
- M. Ismael, J. Environ. Chem. Eng., 2020, 8, 103676 CrossRef CAS
- H. Lin and C. Shih, J. Mol. Catal. A: Chem., 2016, 411, 128–137 CrossRef CAS
- K. Matsubara, M. Inoue, H. Hagiwara and T. Abe, Appl. Catal., B, 2019, 254, 7–14 CrossRef CAS
- L. Yang, N. Feng, Q. Wang, Y. Chu, J. Xu and F. Deng, Cell Rep. Phys. Sci., 2020, 1, 100013 CrossRef
- H. Li, W. Zhang, L. Niu, J. Wang, Z. Zuo and Y. Liu, New J. Chem., 2022, 46, 7118–7127 RSC
- F. Muench, ChemElectroChem, 2021, 8, 2993–3012 CrossRef CAS
- M. S. Abd-Elwahed, A. M. Sadoun and M. Elmahdy, J. Mater. Res. Technol., 2020, 9, 13749–13758 CrossRef CAS
- K. C. Poon, D. C. L. Tan, T. D. T. Vo, B. Khezri, H. Su, R. D. Webster and H. Sato, J. Am. Chem. Soc., 2014, 136, 5217–5220 CrossRef CAS PubMed
- Y. Zhou, S. Yang, D. Fan, J. Reilly, H. Zhang, W. Yao and J. Huang, ACS Appl. Nano Mater., 2019, 2, 1027–1032 CrossRef CAS
- Y. Yang, C. Zhou, W. Wang, W. Xiong, G. Zeng, D. Huang, C. Zhang, B. Song, W. Xue, X. Li, Z. Wang, D. He, H. Luo and Z. Ouyang, Chem. Eng. J., 2021, 405, 12654 Search PubMed
- M. A. Mannaa, K. F. Qasim, F. T. Alshorifi, S. M. El-Bahy and R. S. Salama, ACS Omega, 2021, 6, 30386–30400 CrossRef CAS PubMed
- X. Luo, R. Li, K. P. Homewood, X. Chen and Y. Gao, Appl. Surf. Sci., 2020, 505, 144099 CrossRef CAS
- P. Qiao, J. Wu, H. Li, Y. Xu, B. Sun, L. Ren, K. Pan, L. Wang and W. Zhou, Nanotechnology, 2019, 30, 125703 CrossRef CAS PubMed
- S. Jayachitra, D. Mahendiran, P. Ravi, P. Murugan and M. Sathish, Appl. Catal., B, 2022, 307, 121159 CrossRef CAS
- H. She, X. Ma, K. Chen, H. Liu, J. Huang, L. Wang and Q. Wang, J. Alloys Compd., 2020, 821, 153239 CrossRef CAS
- P. Ravi, V. Navakoteswara Rao, M. V Shankar and M. Sathish, Int. J. Hydrogen Energy, 2020, 45, 7517–7529 CrossRef CAS
- X. Chen, B. Sun, J. Chu, Z. Han, Y. Wang, Y. Du, X. Han and P. Xu, ACS Appl. Mater. Interfaces, 2022, 14, 28945–28955 CrossRef CAS PubMed
- J. Liu, J. Ke, Y. Li, B. Liu, L. Wang, H. Xiao and S. Wang, Appl. Catal., B, 2018, 236, 396–403 CrossRef CAS
- S. Fang, Z. Sun and Y. H. Hu, ACS Catal., 2019, 9, 5047–5056 CrossRef CAS
- Y. Liu, Z. Wang, W. Fan, Z. Geng and L. Feng, Ceram. Int., 2014, 40, 3887–3893 CrossRef CAS
- S. Fang, Z. Sun and Y. H. Hu, ACS Catal., 2019, 9, 5047–5056 CrossRef CAS
- F. Neaţu, L. E. Abramiuc, M. M. Trandafir, R. F. Negrea, M. Florea, C. M. Teodorescu and S. Neaţu, ChemCatChem, 2020, 12, 4642–4651 CrossRef
- H. E. Cheng, C. H. Hung, I. S. Yu and Z. P. Yang, Catalysts, 2018, 8, 440 CrossRef
- X. Ren, P. Gao, X. Kong, R. Jiang, P. Yang, Y. Chen, Q. Chi and B. Li, J. Colloid Interface Sci., 2018, 530, 1–8 CrossRef CAS PubMed
- M. Xiao, L. Zhang, B. Luo, M. Lyu, Z. Wang, H. Huang, S. Wang, A. Du and L. Wang, Angew. Chem., 2020, 132, 7297–7301 CrossRef
- Z. Fu, G. Zhang, Z. Tang and H. Zhang, Catal. Surv. Asia, 2020, 24, 38–58 CrossRef CAS
- C. Huang, Y. Ding, C. Hao, S. Zhou, X. Wang, H. Gao, L. Zhu and J. Wu, Chem. Eng. J., 2019, 378, 122202 CrossRef CAS
- A. Shukla, R. K. Singha, T. Sasaki, S. Adak, S. Bhandari, V. V. D. N. Prasad, A. Bordoloi and R. Bal, Mol. Catal., 2020, 490, 110943 CrossRef CAS
- M. Pudukudy, Z. Yaakob, A. Kadier, M. S. Takriff, N. Suhaimi and M. Hassan, Int. J. Hydrogen Energy, 2021, 42, 16495–16513 CrossRef
- K. Mech, M. Gajewska, M. Marzec and K. Szaciłowski, Mater. Chem. Phys., 2020, 255, 2–12 CrossRef
- H. T. Li, W. G. Zhang, L. Niu, J. Wang, Z. J. Zuo and Y. M. Liu, New J. Chem., 2022, 46, 7118–7127 RSC
- M. S. Abd-Elwahed, A. M. Sadoun and M. Elmahdy, J. Mater. Res. Technol., 2020, 9, 13749–13758 CrossRef CAS
- J. Song, M. R. Kim, Y. Kim, D. Seo, K. Ha, T. E. Song, W. G. Lee, Y. Lee, K. C. Kim, C. W. Ahn and H. Han, Nanotechnology, 2022, 33, 065303 CrossRef CAS PubMed
- M. D. Balela and K. L. Amores, Mater. Chem. Phys., 2019, 225, 393–398 CrossRef CAS
- M. Scheuerlein, F. Muench, U. Kunz, T. Hellmann, J. Hofmann and W. Ensinger, ChemElectroChem, 2020, 7, 3496–3507 CrossRef CAS
- T. Boettcher, S. Schaefer, M. Antoni, T. Stohr, U. Kunz, M. Dürrschnabel, L. Molina-Luna, W. Ensinger and F. Muench, Langmuir, 2019, 35, 4246–4253 CrossRef CAS PubMed
- X. Meng, Y. Xu, Q. Wang, X. Yang, J. Guo, X. Hu, L. Tan and Y. Chen, Langmuir, 2019, 35, 9713–9720 CrossRef CAS PubMed
- M. Lan, J. Cai, L. Yuan, Y. Xu and D. Zhang, Surf. Coat. Technol., 2013, 216, 152–157 CrossRef CAS
- T. Tsuneyoshi, Y. Cui, H. Ishida, T. Watanabe and T. Ono, Langmuir, 2019, 35, 13311–13317 CrossRef CAS PubMed
- J. Xu, X. Li, Y. Zhong, J. Qi, Z. Wang, Z. Chai, W. Li, C. Jing and Y. Cheng, Adv. Mater. Technol., 2018, 3, 1800372 CrossRef
- N. Jawale, S. Arbuj, G. Umarji, M. Shinde, B. Kale and S. Rane, RSC Adv., 2023, 13, 2418–2426 RSC
- Anita, A. K. Yadav, N. Khatun, S. Kumar, C. M. Tseng, S. Biring and S. Sen, J. Mater. Sci.: Mater. Electron., 2017, 28, 19017–19024 CrossRef CAS
- N. Mukurala, S. Suman, A. Bhardwaj, K. Mokurala, S. H. Jin and A. K. Kushwaha, Appl. Surf. Sci., 2021, 551, 149377 CrossRef CAS
- T. Raguram and K. S. Rajni, J. Mater. Sci.: Mater. Electron., 2021, 32, 18264–18281 CrossRef CAS
- S. Biswas, H. Y. Lee, M. Prasad, A. Sharma, J. S. Yu, S. Sengupta, D. D. Pathak and A. Sinhamahapatra, ACS Appl. Nano Mater., 2021, 4, 4441–4451 CrossRef CAS
- M. Balakrishnan and R. John, J. Mater. Sci.: Mater. Electron., 2021, 32, 5295–5308 CrossRef CAS
- A. Y. Faid, A. O. Barnett, F. Seland and S. Sunde, Electrochim. Acta, 2020, 361, 137040 CrossRef CAS
- M. P. B. Vega, M. Hinojosa-Reyes, A. Hernández-Ramírez, J. L. G. Mar, V. Rodríguez-González and L. Hinojosa-Reyes, J. Sol-Gel Sci. Technol., 2018, 85, 723–731 CrossRef CAS
- T. Ohsaka, F. Izumi and Y. Fujiki, J. Raman Spectrosc., 1978, 7, 321–324 CrossRef
- U. Balachandran and N. G. Eror, J. Solid State Chem., 1982, 42, 276–282 CrossRef CAS
- F. Dönmez and N. Ayas, Int. J. Hydrogen Energy, 2021, 46, 29314–29322 CrossRef
- J. Park, S. S. Lam, Y. K. Park, B. J. Kim, K. H. An and S. C. Jung, Environ. Res., 2023, 216(3), 114657 CrossRef CAS PubMed
- T. Raguram and K. S. Rajni, Appl. Phys. A: Mater. Sci. Process., 2019, 125, 1–11 CrossRef
- Alamgir, W. Khan, S. Ahmad, M. Mehedi Hassan and A. H. Naqvi, Opt. Mater., 2014, 38, 278–285 CrossRef CAS
- B. Choudhury and A. Choudhury, J. Lumin., 2012, 132, 178–184 CrossRef CAS
- N. Liu, S. Mohajernia, N. T. Nguyen, S. Hejazi, F. Plass, A. Kahnt, T. Yokosawa, A. Osvet, E. Spiecker, D. M. Guldi and P. Schmuki, ChemSusChem, 2020, 13, 4937–4944 CrossRef CAS
- T. Te Wang, C. L. Chiang, Y. C. Lin, V. Srinivasadesikan, M. C. Lin and Y. G. Lin, Appl. Surf. Sci., 2020, 511, 145548 CrossRef
- D. B. Bankar, R. R. Hawaldar, S. S. Arbuj, M. H. Moulavi, S. T. Shinde, S. P. Takle, M. D. Shinde, D. P. Amalnerkar and K. G. Kanade, RSC Adv., 2019, 9, 32735–32743 RSC
- B. H. R. Suryanto, Y. Wang, R. K. Hocking, W. Adamson and C. Zhao, Nat. Commun., 2019, 10, 1–10 CrossRef PubMed
- X. Luo, R. Li, K. P. Homewood, X. Chen and Y. Gao, Appl. Surf. Sci., 2020, 505, 144099 CrossRef CAS
- X. Li, D. T. Wang, J. F. Chen and X. Tao, Electrochim. Acta, 2012, 80, 126–132 CrossRef CAS
- Y. Qi, Y. Zhao, Y. Gao, D. Li, Z. Li, F. Zhang and C. Li, Joule, 2018, 2, 2393–2402 CrossRef CAS
- J. Zhao, R. Shi, Z. Li, C. Zhou and T. Zhang, Nano Sel., 2020, 1, 12–29 CrossRef
Footnote |
| † Electronic supplementary information (ESI) available: XRD, SEM, TEM images and electrochemical tests. See DOI: https://doi.org/10.1039/d3ra03139j |
| This journal is © The Royal Society of Chemistry 2023 |