
 Open Access Article
 This Open Access Article is licensed under a Creative Commons Attribution-Non Commercial 3.0 Unported Licence
Selective determination of nitrite in water and food samples using zirconium oxide (ZrO2)@MWCNTs modified screen printed electrode†
Nadeen Rajaba,
Hosny Ibrahimb,
Rabeay Y. A. Hassan *a and
Ahmed F. A. Youssef*ab
*a and
Ahmed F. A. Youssef*ab
aUniversity of Science and Technology (UST), Zewail City of Science and Technology, Giza, 12578, Egypt. E-mail: ahyoussef@zewailcity.edu.eg; ryounes@zewailcity.edu.eg
bChemistry Department, Faculty of Science, Cairo University, Giza, 12613, Egypt
First published on 17th July 2023
Abstract
Nitrite ions are being used in different forms as food preservatives acting as flavor enhancers or coloring agents for food products. However, continuous ingestion of nitrite may have severe health implications due to its mutagenic and carcinogenic effects. Thus, this study constructed an electrochemical assay using disposable nano-sensor chip ZrO2@MWCNTs screen printed electrodes (SPE) for the rapid, selective, and sensitive determination of nitrite in food and water samples. As a sensing platform, the use of nanomaterials, including metal oxide nanostructures and carbon nanotubes, exhibited a superior electrocatalytic activity and conductivity. Morphological, structural, and electrochemical analyses were performed using electron microscopy (SEM and TEM), Fourier-transform infrared (FTIR) spectroscopy, electrochemical impedance spectroscopy (EIS), cyclic voltammetry (CV) and chronoamperometry (CA). Accordingly, a wide dynamic linear range (5.0 μM to 100 μM) was obtained with a limit of detection of 0.94 μM by the chronoamperometric technique. In addition, the sensor's selectivity was tested when several non-target species were exposed to the sensor chips while no obvious electrochemical signals were generated when the nitrite ions were not present. Eventually, real food and water sample analysis was conducted, and a high recovery was achieved.
Introduction
Nitrite, an inorganic nitrogenous compound that occurs in nature, is considered a hazardous pollutant because of its toxicity to human health, and persistence in the environment.1,2 It is widely used in food additives in cured meat products, chemical bleaches, soil fertilizers, dying agents, and corrosion inhibitors,3–5 in addition to some pharmaceutical uses such as cyanide poisoning antidotes and blood anticoagulation drugs.6 However, excessive nitrite intake in the human body causes arterial hypertension,7 brain anoxia,8 induced abortion,9 and irreversible oxidation of hemoglobin to methemoglobin.10 Also, it has mutagenic and carcinogenic effects that cause gastric cancer11 and birth defects such as blue baby syndrome.12Accordingly, WHO and the European Commission's Food Science Committee (ECFSC) set an acceptable daily intake (ADI) for nitrite of 0.07 mg kg−1 body weight per day, equivalent to 4.2 mg nitrite per day for a 60 kg adult.13–15 Therefore, continuous monitoring of nitrite levels in food or any other environmental samples is necessary. Hence, there is a need to develop a sensitive and simple analytical method to be applied for the fast detection of nitrite.
Classically, nitrite can be detected by many analytical approaches such as ion chromatography,16 chemiluminescence,17 flow injection analysis,18 spectrophotometry,19 and Raman spectrometry.20 However, these techniques are not cost-effective and require complicated pretreatments that consume time and chemicals. In addition, these techniques involve sophisticated instruments that do not fit the on-site monitoring. On the other hand, electrochemical methods are more efficient and cost-effective,21,22 especially among them, the cyclic voltammetry and chronoamperometry techniques. Both techniques are used because of their high fast response, and rapid analysis.23,24 For better electrochemical performance, modifications of working electrode surfaces with sensing nanomaterials can be applied while using disposable screen-printed electrodes, which have extra advantages of preventing contamination by sample impurities, and less sample volume is needed for analysis.25,26
As has been previously published in several articles, modified electrodes with multi-walled carbon nanotubes (MWCNTs) exhibited a reasonable electrochemical sensitivity to nitrite detection.27–29 Electrode surface functionalization and modification with MWCNTs are simple.30 That is why the use of MWCNTs in several sensors and biosensors applications are widely common. For example, the synergistic integration of Au nanoparticles, Co-MOF and MWCNT as biosensors is used for the sensitive detection of low-concentration nitrite.31,32 In addition, ZrO2 is highly reactive with a large surface area, and offers a good distribution of particles in the composite.33 Here, a novel nanocomposite consisting of ZrO2@MWCNTs was introduced as a new sensing platform for nitrite detection. Thus, nanomaterial characterization, electrode surface modification, electrochemical assay optimization, and real sample analysis were accomplished in this study.
Materials and methods
Reagents and preparation of solutions
The tested nanomaterials that were used for the selection of the composite were: multi-walled carbon nanotubes (MWCNTs), manganese oxide (MnO2), tungsten oxide (WO3), cobalt oxide (CoO3), cerium oxide (CeO3), aluminum oxide (Al2O3), antimony oxide (Sb2O3) and zirconium oxide (ZrO2) nanomaterials were screened for the selection of the highest oxidation peak current of nitrite. For preparing the solutions: sodium acetate (CH3COONa), glacial acetic acid (CH3COOH), potassium ferricyanide (K3[Fe(CN)6]) (FCN), potassium chloride (KCl) were prepared by distilled water.The nanomaterials were prepared at the concentration of 5.0 mg mL−1. 0.1 M acetate buffer at pH 4.5 was prepared by adding the glacial acetic acid to sodium acetate to adjust the pH at 4.5 then adding distilled water to reach the volume of the required molarity 0.1 M of sodium acetate. 0.1 M KCl and 5 mM of (K3[Fe(CN)6]) were used for the electrochemical characterization of modified electrodes using the CV and EIS.
Electrochemical measurements
Electrochemical investigations were conducted using Palmsens-4 electrochemical portable-potentiostat from Palm-Sense Company (Randhoeve, Netherlands). Corrtest bench potentiostat from Corrtest-Instruments Company (China), commercial screen-printed carbon electrodes were obtained from Zensor Company (Taichung, Taiwan) with the following specifications: carbon as the working and counter electrodes, Ag as the reference electrode. Electrode surface area was 3.0 mm. Electrochemical impedance spectroscopy (EIS), and cyclic voltammetric (CV) analysis were carried out in triplicates using potassium ferricyanide [Fe(CN)6]3− (5 mM) as the standard redox mediator. KCl (0.1 M) solution was used as the supporting electrolyte. The impedimetric measurements were performed at an open circuit potential, under a 10 mV potential magnitude, and through the frequency range from 10 kHz to 0.1 Hz. For quantitative EIS data analysis, all collected Nyquist plots were fitted with an equivalent circuit model.Voltammetric working parameters were recorded by sweeping the potential within −0.4 to +0.9 V, with a 50 mV s−1 scanning rate. All electrochemical studies were operated at lab temperature (25 ± 2 °C).
Modification of the screen-printed electrodes with the nanocomposite (ZrO2@MWCNTs)
Individual aqueous suspensions of metal oxides nanostructured ZrO2 and MWCNTs were prepared with the concentration of 5.0 mg mL−1 using distilled water and sonicated for 20 minutes to have a homogenous dispersal nano-suspension. In order to prepare a metal oxide/carbon nanotube nanocomposite, a volume of ZrO2 was added to the dispersion of the MWCNTs at the final ratio (3![[thin space (1/6-em)]](https://www.rsc.org/images/entities/char_2009.gif) :1) respectively, and re-sonicated for an additional 20 minutes. From this nanocomposite suspension, 5.0 μL was drop-casted onto the active surface of the working electrode of the disposable screen-printed electrodes, and air dried. Scheme 1 represents the fabrication of modified-screen printed electrodes (SPEs).
:1) respectively, and re-sonicated for an additional 20 minutes. From this nanocomposite suspension, 5.0 μL was drop-casted onto the active surface of the working electrode of the disposable screen-printed electrodes, and air dried. Scheme 1 represents the fabrication of modified-screen printed electrodes (SPEs).
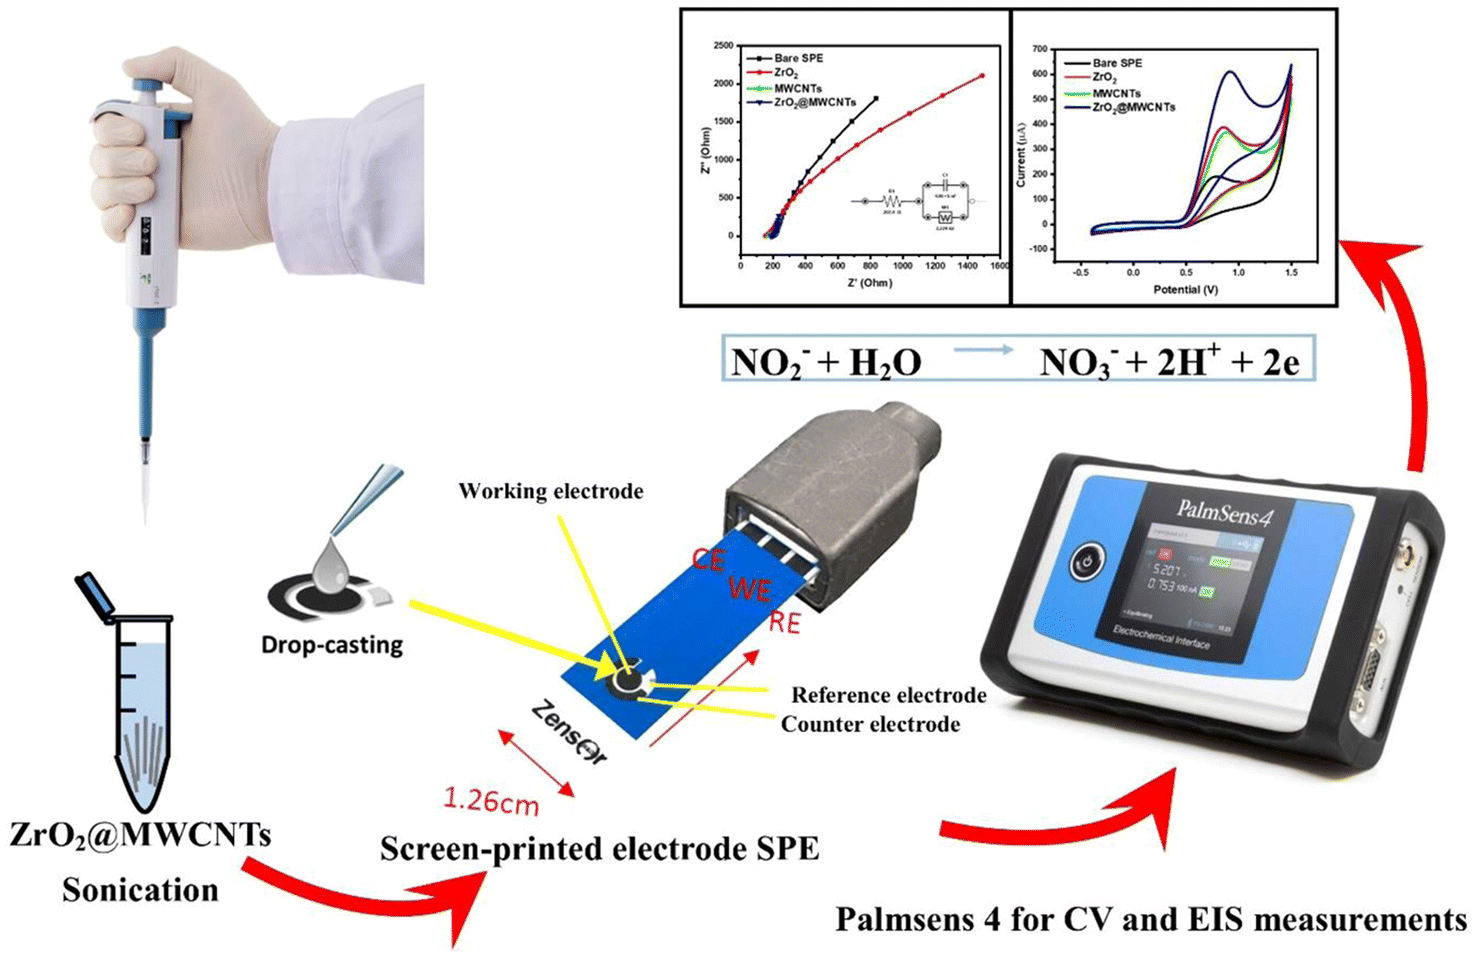 | ||
| Scheme 1 Electrochemical setup and steps of SPEs modification using the nanomaterials. | ||
For nitrite assay optimization, CV was performed in a 0.1 M acetate buffer solution (pH 4.5) at a scan rate of 50 mV s−1 in the potential range from −0.4 to 1.5 V. Moreover, chronoamperometry was carried out with an applied potential of 0.9 V.
Nanomaterial characterization using TEM, SEM and FTIR
Sensors surface morphological analysis was conducted using high-resolution scanning electron microscopy (SEM-Quanta FEI-250, with field emission gun, and an accelerating voltage of 20.00 kV). 2D nano-sized images were obtained using high-resolution-transmission electron microscopy (HRTEM, FEI-Tecnai-T20). Functionalized SPEs surfaces were investigated directly using Fourier transform infrared (FTIR) spectroscopy (Thermo-Scientific-Nicolet iS10 FTIR) in the range of 400–4000 cm−1.Food and water samples analysis
The protocol described by Ding et al.2 was applied to prepare extracts of food samples in this study. A 5.0 g of food sample was crushed, homogenized, and transferred quantitatively into a 250 mL conical flask. 12.5 mL of sodium borate solution (50 g L−1) was added, followed by adding 150 mL of distilled water, and the mixture was heated for 20 minutes at 70 °C while stirring continuously. Afterwards, the samples were left to be cooled down before adding 5.0 mL of zinc acetate solution (220 g L−1), and 5.0 mL of potassium ferricyanide solution (106 g L−1). The grease was removed by centrifugation after 30 minutes of shaking and stirring at 10000 rpm by (4200 tabletop, Kubota centrifuge) and the supernatant was stored in the refrigerator at 10 °C, and taken for examination within two weeks after collection.
Different water samples were collected including tap water, sheller water, wastewater, and ground water samples. A certain volume of each sample was spiked with standard nitrite concentration (45 μM) then the samples were analyzed, and the recovery values were calculated. Worth meaning, sheller water is the water used in the cooling systems of shellers. It contains chemicals additives including nitrite to protect the pipes from corrosion. The ground water sample was collected from an area near to agricultural activities, while the wastewater was collected from pharmaceutical production company where nitrite salts are in use for many targets. In the case of tap water, it was collected from a rural area where leak from the agriculture drainage to the surface water may be possible especially this water is stored in an underground tank before pumping.
Data analysis and statistics
The obtained data were estimated as mean ± relative standard deviation (RSD) from three individual investigations. After the data investigation, the statistical significance was estimated by the statistical hypothesis and the significance of the obtained values was assumed to be p < 0.05. The limits of detection, LOD = 3 × (SD/slope of the curve), and quantification, LOQ = 10 × (SD/slope of the curve), SD: the standard deviation of the intercept, were calculated in correlation to the designed calibration curve.12,34 The reproducibility of the nitrite sensor was estimated as a relative standard deviation (RSD). All the electrochemical results were drawn as correlated figures, and the values were estimated and analyzed using Origin-Lab software.Results and discussion
Electrochemical screening of nanomaterials
For designing an effective sensor platform to be used for the rapid and sensitive electrochemical determination of nitrite traces in environmental and biological samples, screening diverse of nanomaterials was conducted electrochemically using CV, as well as EIS.EIS is one of the most important electrochemical techniques where the impedance in a circuit is measured by ohms (as resistance unit). Over the other electrochemical technique, EIS offers several advantages reliant on the fact that it is a steady-state technique that utilizes small signal analysis, and it can probe signal relaxations over a very wide range of applied frequency, from less than 1 mHz to greater than 1 MHz, using commercially available electrochemical working stations. In a conventional electrochemical cell, matter–(redox species)–electrode interactions include the concentration of electroactive species, charge-transfer, and mass-transfer from the bulk solution to the electrode surface in addition to the resistance of the electrolyte could be monitored. An electrical circuit that consists of resistances, capacitors, or constant phase elements that are connected in parallel or in a series to form an equivalent circuit characterizes each of these features. Thus, the EIS could be used to explore mass-transfer, charge-transfer, and diffusion processes.35,36 Accordingly, the EIS can study intrinsic material properties or specific processes that could influence conductance, resistance, or capacitance of an electrochemical system.
All nanomaterials were characterized and screened either using the targeting analyte (nitrite ions NO2−), or using the 5.0 mM ferricyanide (FCN) as the standard redox probe, whereas the height of oxidation current of nitrite was applied as the main selection criteria. Besides, FCN redox behaviors alongside its EIS signals were taken into consideration for the confirmation of the electrochemical performances of the nanostructured screen-printed electrodes (nano-SPEs). As shown in Fig. 1a, all modified electrodes with the metal oxides nanostructures provided higher oxidation currents than the unmodified electrode. In this regard, peak height with around 300 μA was obtained from the modified surfaces, and less than 100 μA peak height was obtained from the unmodified surface. Among all tested metal oxides, zirconium dioxide (ZrO2) modified-SPE provided the highest nitrite voltammetric signal. Accordingly, ZrO2 was selected as the first sensor component that will be integrated with the MWCNTs for better catalytic activity and conductivity. As a result, the electrochemical signal of nitrite oxidation was raised from 100 μA, to about 600 μA (almost 6-fold increase) when the modified SPE with the ZrO2@MWCNTs was employed for nitrite oxidation, as shown in Fig. 1b. The modification with composite ZrO2@MWCNTs resulted in enhanced peak current of nitrite compared to the peak current of the bare electrode by enhancing the effect of electron transfer rate. As a result, the modified SPEs with the chosen nanocomposite have substantially supported quick and effective voltammetric oxidation of varying nitrite concentrations, where a strong dependency of the oxidation current on the nitrite concentrations was obtained. As shown in Fig. 1c and d, a linear increase in the obtained oxidation currents was correlated with the frequent increase in the nitrite ions concentration from 1.0 to 10 mM. The obtained oxidation peak current densities were plotted with respect to nitrite concentrations and the corresponding linear regression equation is Ipa (μA) = 77.7186C (mM) + 11.9755 (R2 = 0.999).
 | ||
| Fig. 1 (a) CVs of bare and modified SPEs with different metal oxides (MnO2, WO3, CoO3, CeO3, Al2O3, Sb2O3, and ZrO2), using a single nitrite concentration (0.1 M) at scan rate of 50 mV s−1 (b) CVs of bare, ZrO2, MWCNTs and Zr2O3@MWCNTs on SPE for detecting 0.1 M nitrite, at scan rate 50 mV s−1. (c) Effect of nitrite subsequent additions on the voltammetric signal of the ZrO2@MWCNTs-based SPE at scan rate of 50 mV s−1, with nitrite range 1–10 mM. (d) The corresponding linear relationship between the oxidation current of nitrite, and its concentrations (n = 3). (e) CVs of ZrO2@MWCNTs at different scan rates with 8.0 mM of nitrite. (f) Peak current value versus the square root of scan rates. (g) The calibration plot of the current versus the scan rate1/2. The voltammetric experiments were conducted in acetate buffer (pH 4.5, 0.1 M). | ||
Moreover, the effect of scan rate on the voltammetric peak current and peak position of the nitrite oxidation was studied using the modified SPEs, as depicted in Fig. 1e and f. Furthermore, the enlarged surface area, due to the implementation of MWCNTs, offered the possibility of carrying on redox reactions for nitrite ions for a wide range of concentrations without reaching a saturation or declining level as shown in Fig. 2Sa (ESI†). In fact, the large surface area, and the high electro-catalytic properties are the main advantages for designing the targeting electrochemical nitrite sensors.
Electrochemical properties
The electrochemical (CV & EIS) characterization yielded well-defined and sharp reversible redox peaks, confirming the importance of metal oxides in improving voltammetric signals and decreasing the overall charge transfer and diffusion resistances, as shown in Fig. 2a and b.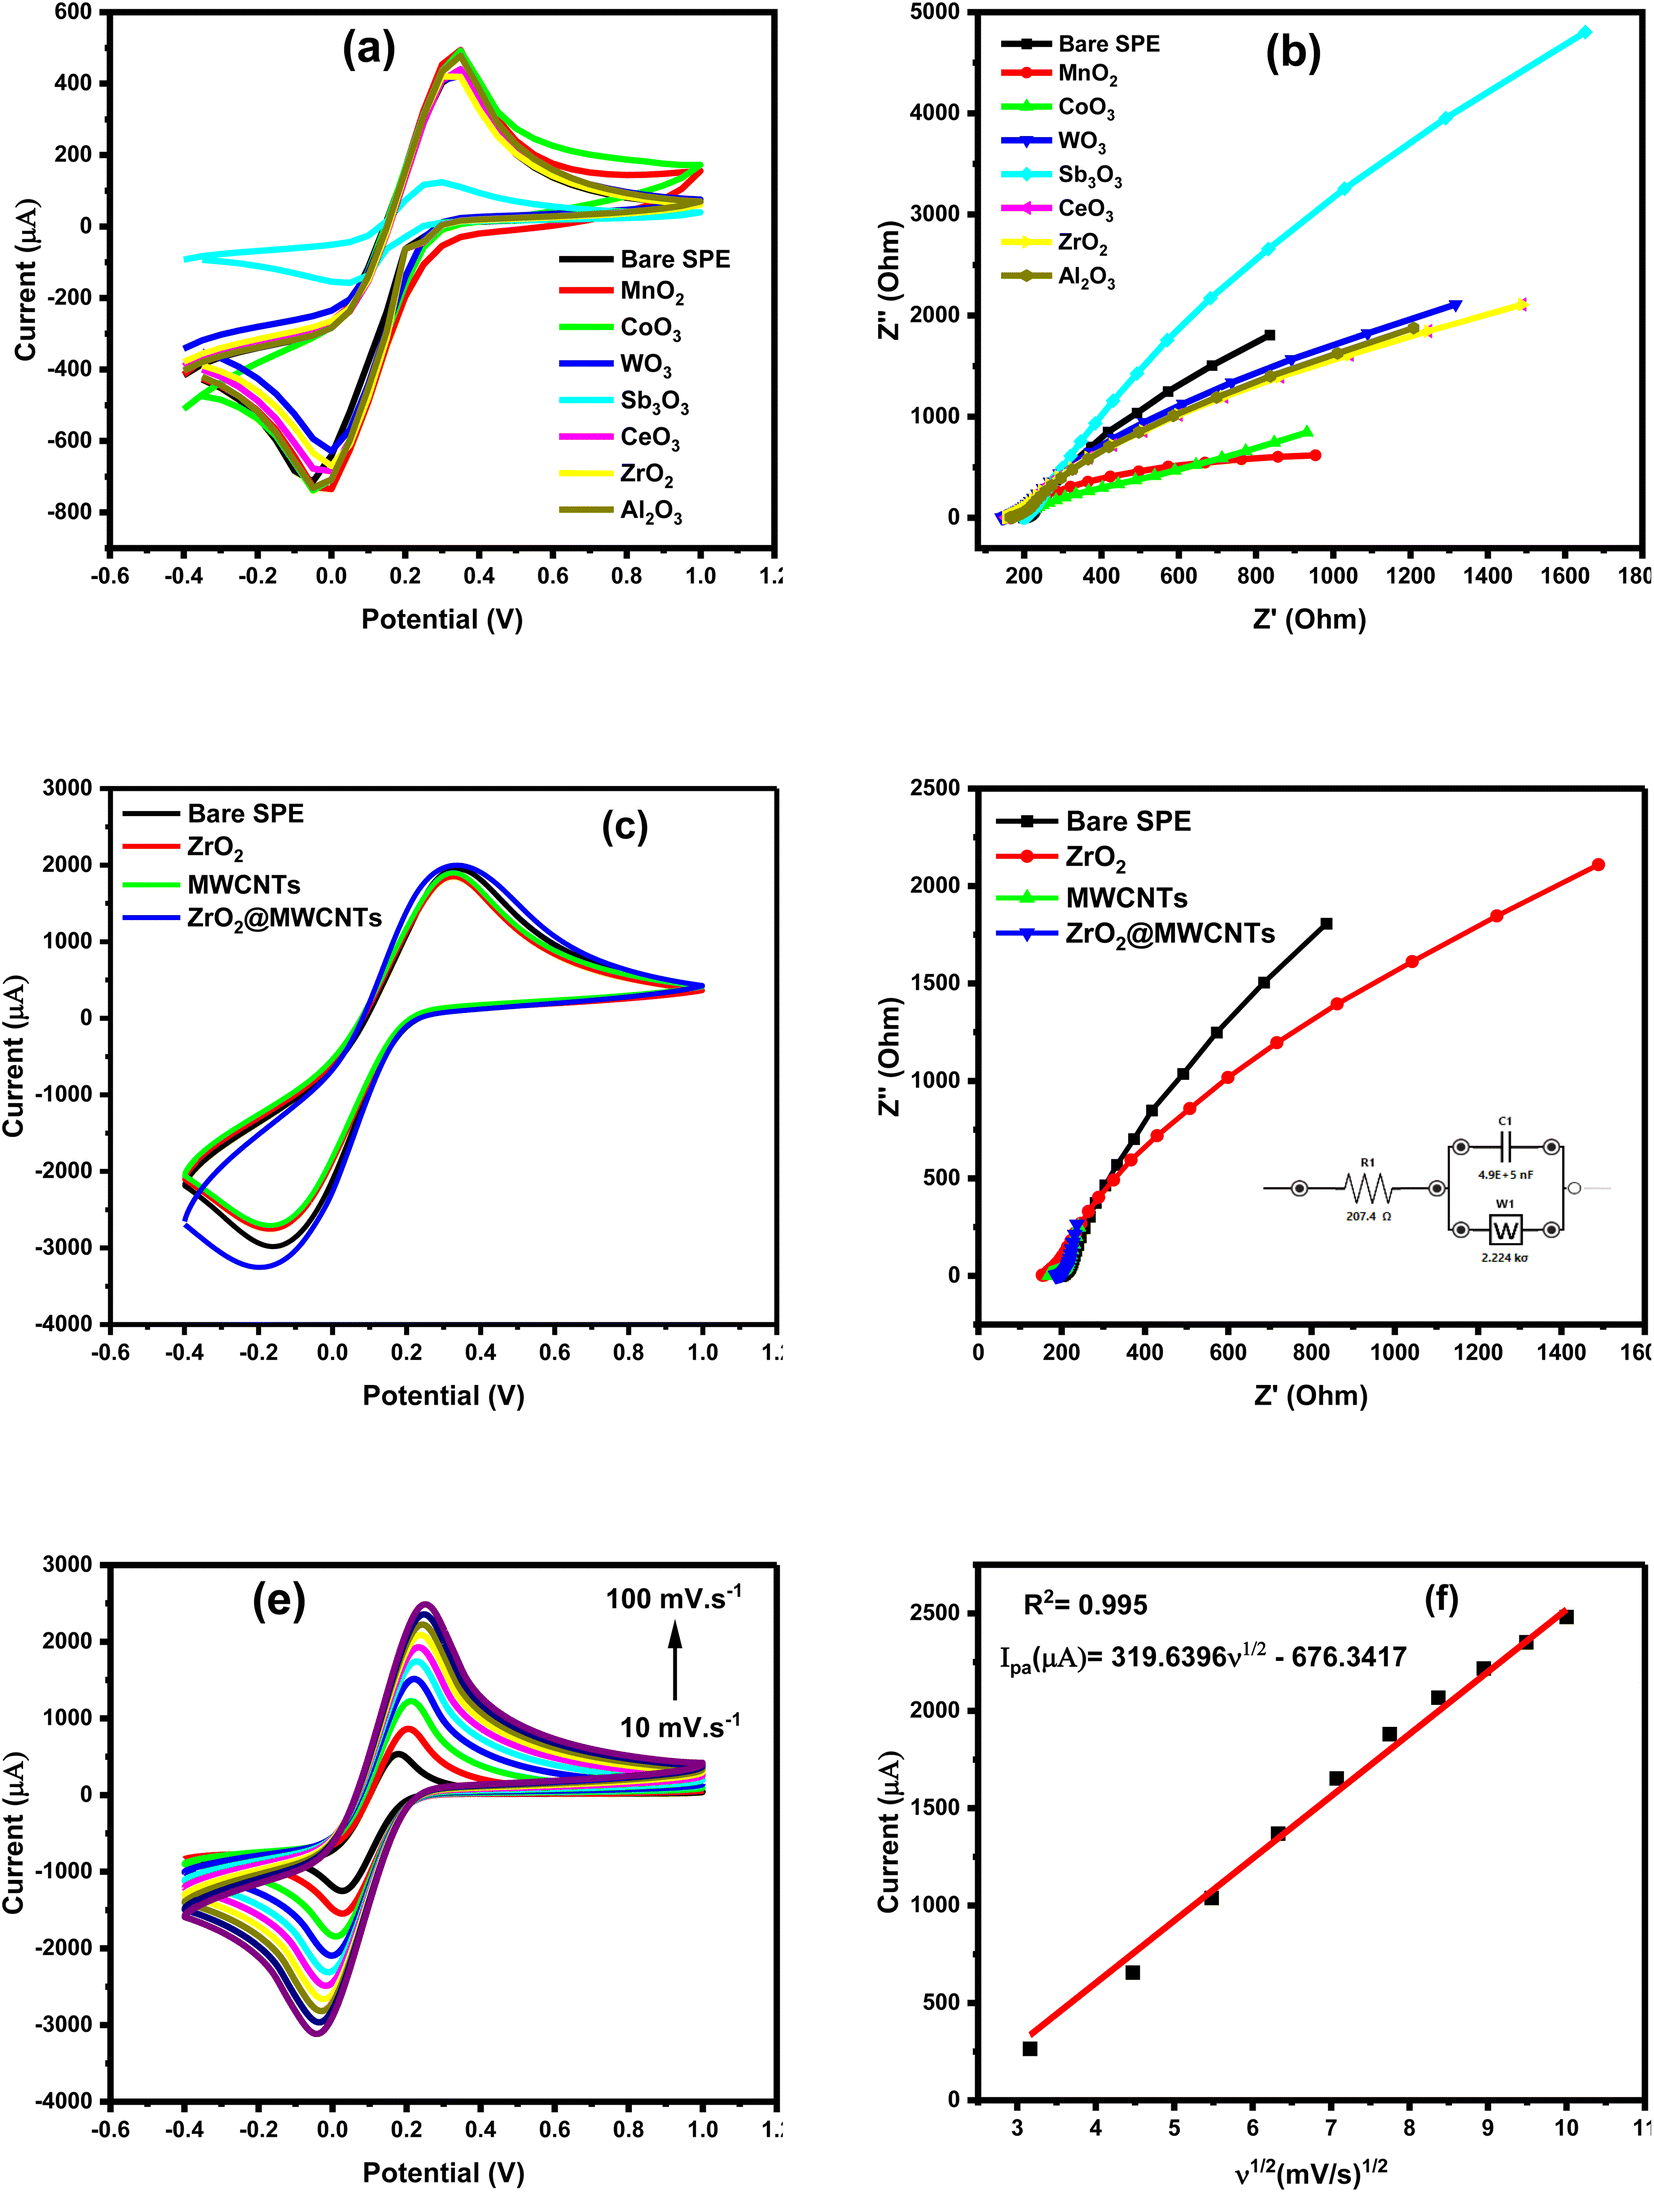 | ||
| Fig. 2 (a) CVs of the voltammetric characterization for the modified screen-printed electrodes with metal oxides (MnO2, CoO3, WO3, CeO3, Sb2O3, Al2O3 and ZrO2). (b) Impedimetric characterization (Nyquist plots) for the modified screen-printed electrodes with metal oxides nanostructures. FCN (5.0 mM) was used as a standard redox probe for the voltammetric as well as the impedimetric characterizations in 0.1 M KCl. (c) CVs of 5.0 mM FCN voltammetric signals of bare, ZrO2, MWCNTs and ZrO2@MWCNTs modified SPEs. (d) The corresponding Nyquist plots of bare and the modified electrodes. (e) Effect of scan rate changes (from 10–100 mV s−1) on the voltammetric signals, inset: the equivalent circuit of ZrO2@MWCNTs (f) the corresponding calibration plot of peak current vs. the scan rate1/2. All electrochemical characterization experiments (CV, and EIS) were conducted in the electrolyte solution containing 5.0 mM of [Fe(CN)6]3− in 0.1 M KCl with the scan rate of 50 mV s−1. | ||
The different materials were tested for the reversible reaction of 5 mM [Fe(CN)6]3− in 0.1 M KCl. Distinguished behaviors of the nanomaterials were obtained where some of the metal oxides exhibited weaker electrochemical performances than the bare-SPE (e.g. the Sb2O3), and others showed extremely high electrochemical signals (MWCNTs incorporated with the zirconium oxide). This was supported by the voltammetric as well as the impedimetric patterns, Fig. 2a and b. From the Nyquist plots (Fig. 2b), the Warburg impedance (W) was predominant than the charge transfer resistances (Rct), this was very clear from the sharp line that was extend along the imaginary and real impedances. This is an interesting phenomenon to reflect the diffusion characters demonstrated by nanomaterials.35,36
Moreover, incorporation of MWCNTs with the zirconium oxide provided the maximum voltammetric signal, which was combined with the generated (favored) lowest impedimetric signals, as shown in Fig. 2c and d. Additional EIS analysis explained the behavior the selected nanomaterials, as the resulted Nyquist plot (Fig. 2b) of bare SPE, ZrO2 and ZrO2@MWCNTs in presence of 5.0 mM of the FCN was conducted, the ZrO2 showed a poor conductivity with a high resistivity of 1500 Ohm in spite of its relatively good catalytic activity. Probably the high charge transfer resistance is caused by the disordered aggregation of the nanomaterials.25 MWCNTs provides the lowest electron transfer resistance, and accordingly, the modification of ZrO2 with MWCNTs (ZrO2@MWCNTs/SPE) enhanced the conductivity of the proposed sensor as the charge transfer resistance decreased to 280 Ohm, indicating a faster electron transfer rate. This is attributed to the combination of the tubular shape of MWCNTs and the crystallinity of the ZrO2 providing abundant electron transport pathways and active sites, that improves the nitrite absorption during the oxidation reaction.37
Consequently, the effect of scan rates was demonstrated, as the increase in scan rates led to an increase in peak current in a dynamic and linear relationship, as shown in Fig. 2e and f. The linear regression equation between the current and the square root of the scan rate confirmed that the redox reaction occurred on the electrode's surface was a diffusion-controlled process and affected by the scan rate value.
Scan rate effect, number of electron transfer, surface area calculation
Diffusion controlled process or adsorption-controlled process is a scan rate dependent phenomenon. To define which process is taking place at the nano-SPE, voltammetric oxidation of nitrite was tested over a range of scan rates, while the other parameters are kept constant.As shown in Fig. 1e, the oxidation peak height was continuously increased with increasing the scan rate from 20 to 100 mV s−1. From the obtained and presented results in this figure, the square root of the scan rate (X-axis) was plotted vs. the increase in the oxidation current (Y-axis), i.e. (v1/2 vs. ip), Fig. 1f. In parallel, a systematic shift in the oxidation peak position with scan rate in cyclic voltammetric measurements was obtained in Fig. 1g. As a result, the anodic peak current provided a good linearity with the square root of scan rate, confirming that nitrite oxidation is dominated by a diffusion-controlled process, which agrees with the previous nitrite sensor of Pt/CoO/GCE electrode.38 The linear regression equation between oxidative peak potential (Ep) and logarithm of scanning rate (logv) is Ep (V) = 0.1708logv + 0.5938 (R2 = 0.997).
The number of electrons in this redox reaction was calculated by Laviron equation:25
|
Ep = E0′ + (RT/αnF)log(RTk0/αnF) + (RT/αnF)logv
| (1) |
Based on the slope between Ep and logv inset (Fig. 1f), αn was calculated to be 0.15041.
Afterward, using eqn (2), where Ep/2 = the half-peak potential, and Ep = the standard potential.
| |Ep/2 − Ep| = 1.857(RT/αF) | (2) |
| NO2− + H2O → NO3− + 2H+ + 2e− | (3) |
On the other hand, electroactive surface area of the electrode was determined from the change of scan rates of the redox reaction of ferricyanide, as shown in Fig. 2e. The increase of the anodic peak current (Ipa) with increasing the scan rates (from 10 to 100 mV s−1) exhibited a linear relationship when the Ipa was plotted vs. the square root of the scan rate (v1/2), (Fig. 2f) with Ipa (μA) = 319.6396v1/2 − 676.3417 (R2 = 0.998). This linearity demonstrated the dynamic diffusion-controlled process occurred at ZrO2@MWCNTs modified electrode.
Further calculations were conducted to estimate the electroactive surface area according to Randles–Sevcik eqn (4):
| Ip = (2.69 × 10⁵)n3/2CAD1/2v1/2 | (4) |
Accordingly, the electroactive surface area of the bare SPE, ZrO2 and MWCNTs was calculated to be 0.023 cm2, 0.047 cm2 and 0.037 cm2, respectively. Moreover, the calculated effective surface area of the modified electrodes with the nanocomposite ZrO2@MWCNTs was estimated to be 1.5 cm2 (65 times higher than the effective surface area of bare SPE). These results indicated that the modified ZrO2@MWCNTs sensor exhibited a large electroactive surface area. From the relationship of the increase of the peak highest with the scan rate changes and the stable position in their potential (i.e. no shift towards the positive potential was obtained) thus, a diffusion-control process could be concluded.
The reason behind this process is attributed to the use of the hybrid of nanostructures (metal oxides plus the carbon nanotubes) that accelerated the kinetic reaction (rapid charge transfer) that created the diffusion-controlled process. In fact, this was expected since the fast charge transfer process was observed and revealed by the EIS results (Fig. 2d).
Sensors morphological and functional analysis
The morphology of the ZrO2 and MWCNTs had a major role in the diffusion-controlled process. The average size of the ZrO2 NPs is about 21 ± 5 nm. ZrO2 has a large surface area, higher reactivity and a good distribution of the particles in the composite.33 In addition, MWCNTs are widely used as catalyst due to their chemical stability, excellent electronic properties, physical shape, and specific surface area.40 Therefore, the dual properties of ZrO2 and MWCNTs exerted a synergistic effect on the electron transfer rate of nitrite in the oxidation reaction. To further explore the morphological characterization for the nanocomposite, the scanning electron microscopy (SEM), as well as the transmission electron microscopy (TEM) were employed. As shown in Fig. 3a, direct imaging of the active area of the nanomaterial-based screen-printed showed a full coverage with tube-like structures decorated with bright spherical dots, which represented the homogenous dispersion of the nanoparticles of zirconium metal oxide with the MWCNTs onto the SPE surface. Similarly, TEM image (Fig. 3b), showed the classical nanotube shape with the nano-spheric decoration. Meanwhile, a selected area electron diffraction (SAED) pattern was obtained, as shown in Fig. 3c. Thus, multiple-defined rings of the SAED indicate the crystallinity of the nanocomposite, which is mainly acquired by the zirconium oxide nanoparticles.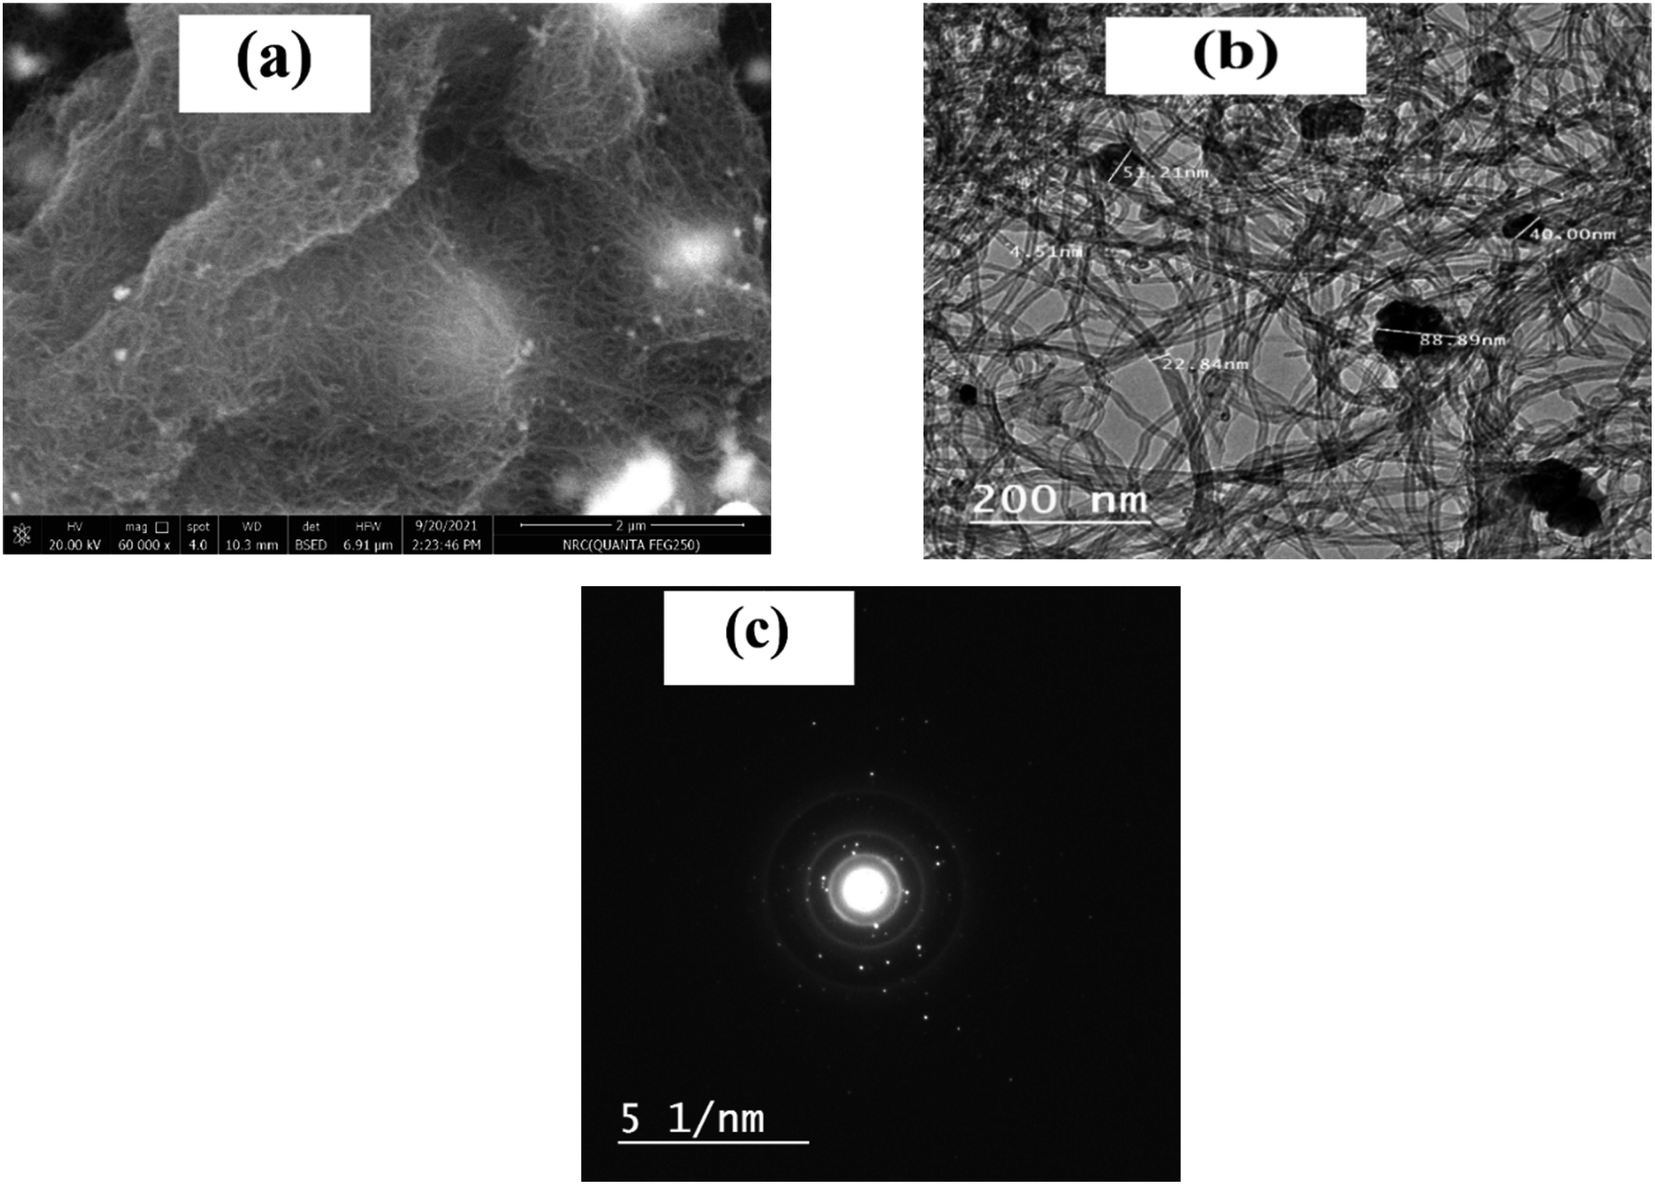 | ||
| Fig. 3 (a) SEM image of the SPE modified with the nanocomposite (ZrO2@MWCNT). (b) TEM image of the nanocomposite suspension on the TEM grid. (c) The corresponding diffraction pattern (SAED). | ||
Additionally, FTIR spectra were collected directly from the surfaces of SPEs modified with ZrO2 and ZrO2–MWCNTs (as shown in Fig. 4). The results demonstrated the declining and disappearance of the remarkable stretching bands of the ZrO2 to show the successful conjugation between the metal oxide nanoparticles and the elongated shapes of the carbon nanotubes.
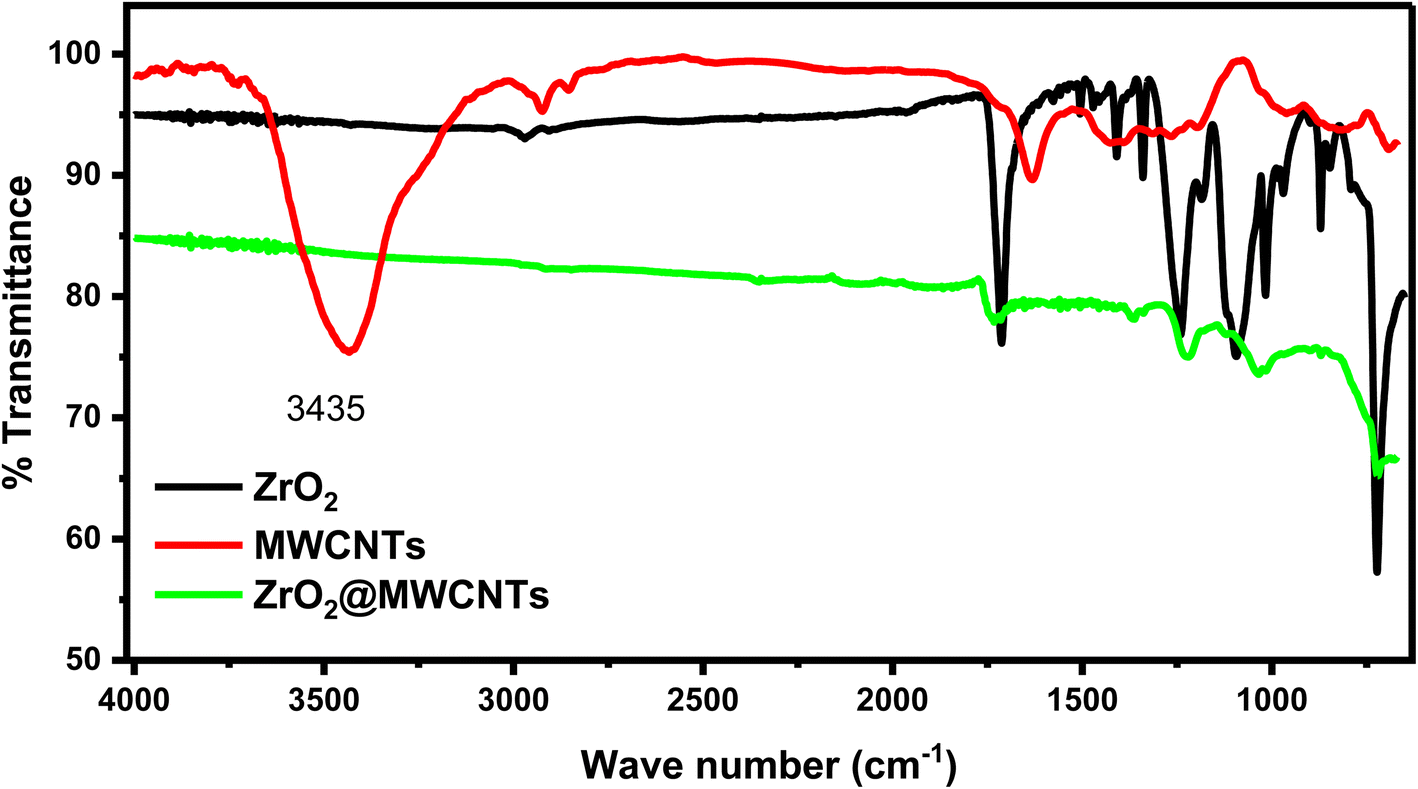 | ||
| Fig. 4 FTIR spectra recorded from the MWCNTs, ZrO2 and SPE modified with ZrO2–MWCNTs. | ||
Electrochemical assay optimization
The successful selection of the nanocomposite (ZrO2@MWCNTs) was followed by testing the weight ratio between the zirconium oxide and carbon nanotubes, as shown in Fig. 5a. The highest voltammetric signal resulted from the nitrite oxidation at the electrode surface was exhibited when the ratio between ZrO2 and MWCNTs was (3:1). Increasing the concentration of ZrO2 in the matrix led to an inhibition in the voltammetric signal at (4:1) ratio. The reason behind the decrease in the voltammetric signals when the metal oxide exceeded the limit is referring to material nature of the ZrO2, which one of the metal oxides that have semiconducting property. Accordingly, this ratio (3:1) was selected for further analysis as the optimal composition.
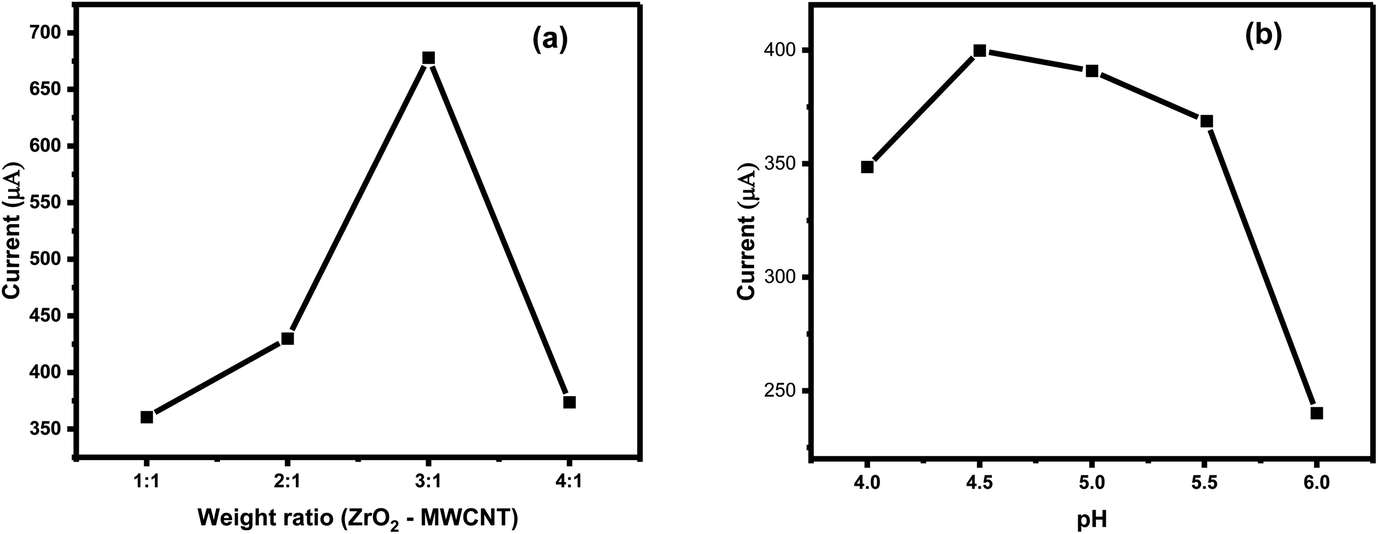 | ||
| Fig. 5 (a) CVs of the ZrO2@MWCNTs weight ratio effect after addition of 0.1 M nitrite, in 0.1 M acetate buffer. (b) CVs of the effect of pH change of acetate buffer on 0.1 M nitrite peak signal of the ZrO2@MWCNTs/SPE. | ||
Consequently, the effect of pH change on the peak current of nitrite oxidation was tested over pH range 4–6 using acetate buffer. The highest peak current was obtained in solution of pH 4.5, followed by a gradual decrease in the peak current until it disappeared completely above pH > 6, as given in Fig. 5b. The voltammetric signal of nitrite is very sensitive to the pH changes. As the acidic pHs (less than 3) caused deterioration of the nanomaterials from the SPE surface, also at alkaline pHs (more than 5) the signal became disturbed and noisy. Hence, pH 4.5 was selected as the optimal.
Chronoamperometric measurements for nitrite quantitative analysis
Direct oxidation of nitrite ions was operated here chronoamperometrically, under the optimized conditions, using the modified screen-printed electrodes. A convenient route is introduced by subsequent additions of standard nitrites concentrations at a fixed time interval of 50 s with continuous stirring of the electrolyte (0.1 M acetate buffer, pH: 4.5). Accordingly, standard individual calibration curves were constructed at different applied DC potentials (0.7, 0.75, 0.8, 0.85, and 0.9 V) to determine the effect of such applied potential on the chronoamperometric responses of nitrite oxidation at the disposable sensor chips. The selected potential values were based on the voltammetric signal of the nitrite oxidation and from the faradaic current obtained at the potential range starting from 0.6–1.1 V, Fig. 1c. Therefore, the effect of DC potential was studied among this potential range. To that end, very fast oxidation currents were recorded for all DC values, the increase in the amperometric signal was dependent on the addition of nitrite ions into the electrochemical cells, as shown in Fig. 6a. In respect to the linearity relationship between the analyte concentration and intensity of the generated signals, applied DC value of 0.9 V provided the best linear proportion and highest electrochemical signal, as shown in Fig. 6b. Thus, for the further analytical measurements, 0.9 V was chosen as the optimum applied potential in the chronoamperometric technique. Eventually, a chronoamperometric curve was constructed with the addition of nitrite in Fig. 6c, and a standard calibration curve was maintained for the sensitive sensing of nitrite, as shown in Fig. 6d. With a quick sensing time of 1.2 s Fig. 1S (ESI†), ultra-high sensitivity was obtained over a wide range of nitrite concentrations (5.0 μM to 100 μM). With a very strong regression coefficient (R2 = 0.999) and a good linearity Ipa = 0.03495x + 0.09586, the limit of detection and quantification were calculated to be 0.94 μM and 3.14 μM, respectively. Worth mentioning here that the obtained limit of detection is lower than the fatal level set by the WHO which is (8.7–28.3) μM of nitrite in water,41 Table 1. Hence, a very high sensitivity was achieved with the quick chronoamperometric sensing responses when the ZrO2@MWCNTs/SPEs were used for the quantitative analysis of nitrite ions.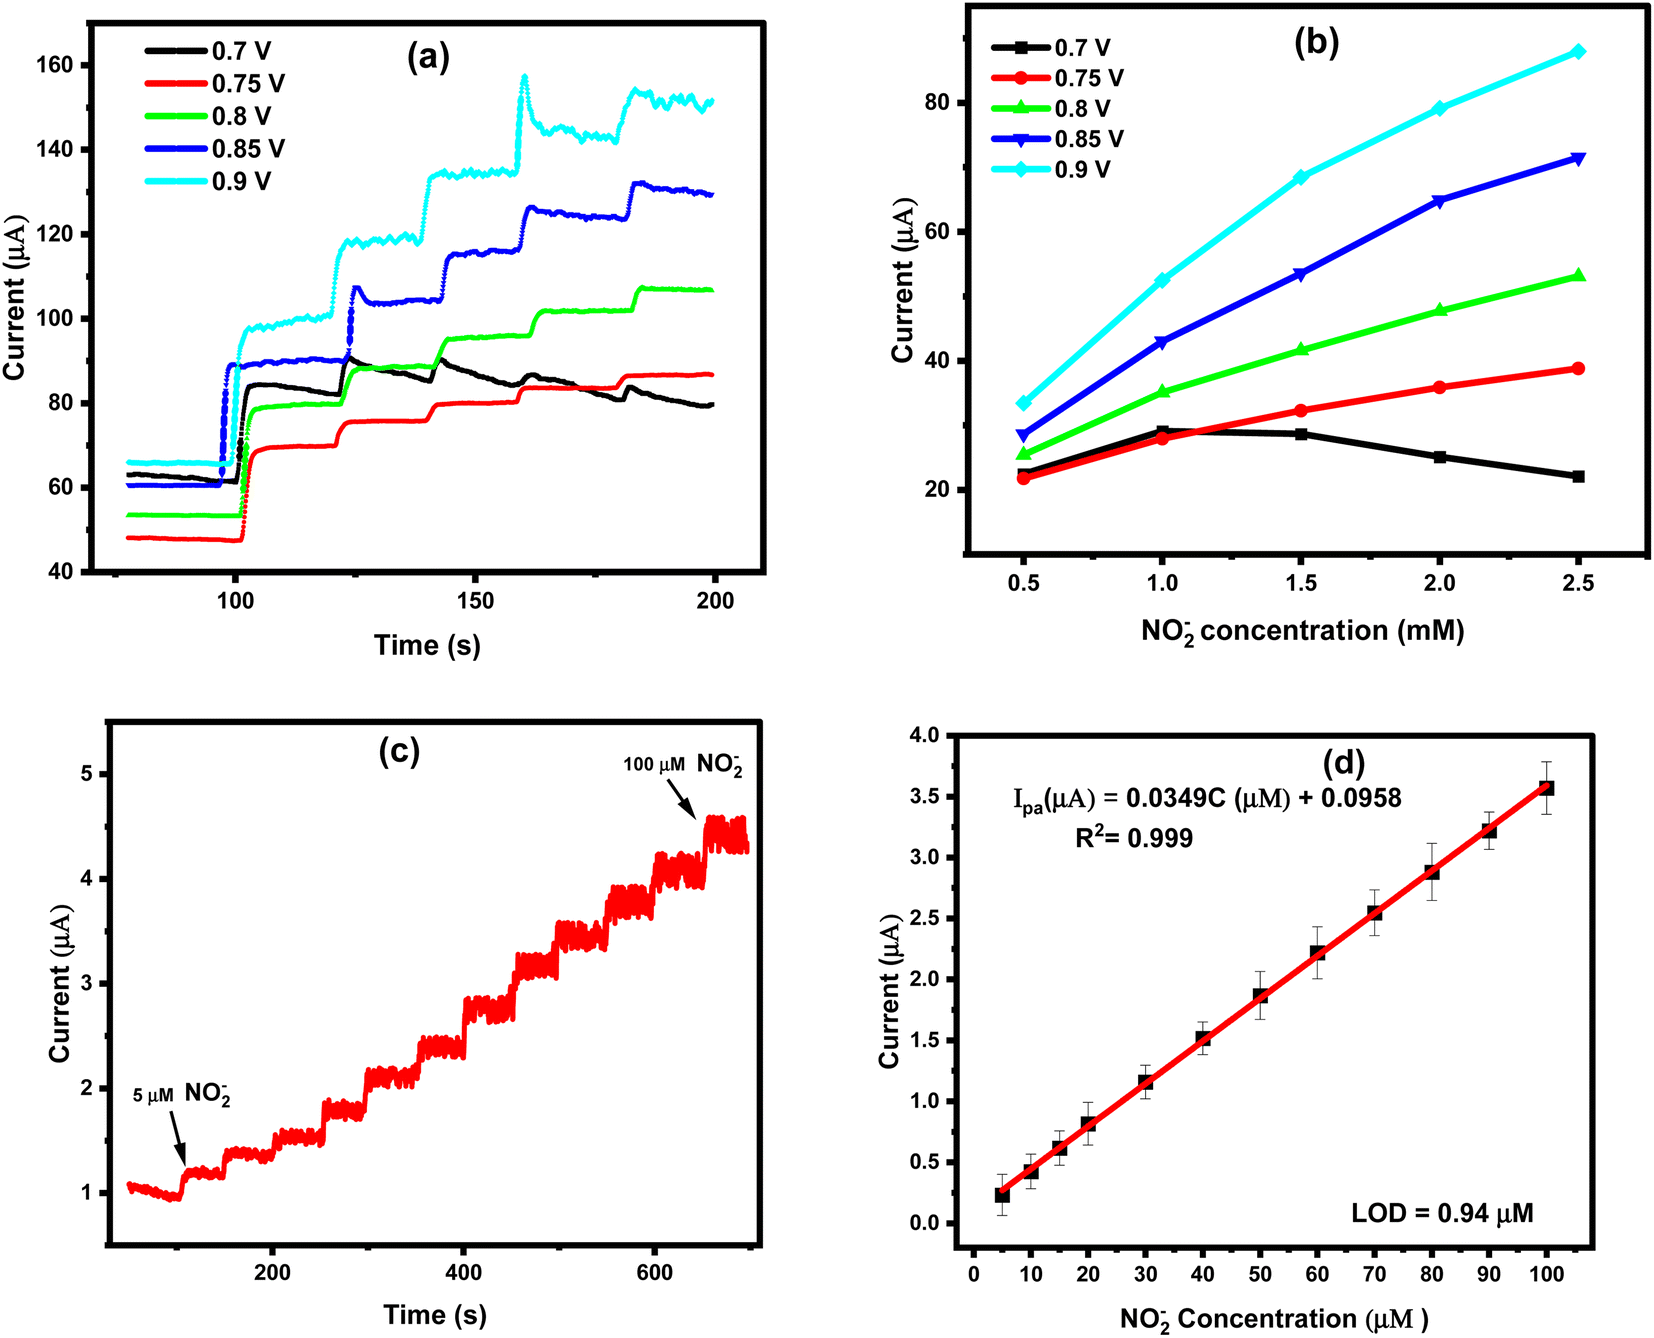 | ||
| Fig. 6 (a) Effect of the applied DC potential on the generated ZrO2@MWCNTs amperometric signals with additions of 0.5 mM of nitrite, (b) the linear relationship between the nitrite ions concentration, and the generated signals at different applied DC values (n = 1). The measurements were conducted in acetate buffer (pH 4.5) as the supporting electrolyte. (c) Chronoamperometric response of ZrO2@MWCNTs/SPE to the successive additions of nitrite (5–100 μM) at 0.90 V in 0.1 M acetate buffer (pH: 4.5), (n = 3) Fig. 3S (ESI†). (d) The corresponding calibration plots. All optimum parameters were applied. | ||
| The modified electrode | Method | Linear range (μM) | LOD (μM) | Ref. |
|---|---|---|---|---|
| Metal–organic gel-carbon nanotube/glassy carbon electrode | DPV | 0.3–100 | 0.086 | 2 |
| Molybdenum oxide/cobalt oxide/carbon cloth | AMP | 0.3125–4514 | 0.075 | 4 |
| Bismuth selenide/carboxylic multiwalled carbon nanotubes | AMP | 0.01–500 | 0.002 | 25 |
| 500–7000 | ||||
| Gold nanoparticles/cobalt hydroxide/carbon cloth | AMP | 0.625–77.5 | 0.1 | 42 |
| 0.625–3387.5 | ||||
| Zinc oxide/Nafion/glassy carbon electrode | AMP | 0.3–6.1 (AMP) | 0.21 | 12 |
| LSV | 0.8–4.8 (LSV) | 0.62 | ||
| Flexible laser-induced graphene electrodes functionalized by CNT decorated by Au nano-particles | SWV | 10–140 | 0.9 | 5 |
| α-Manganese oxide/molybdenum disulfide | AMP | 100–800 | 16 | 9 |
| Iron sulfide nanorods-functionalized carbon cloth | AMP | 0.625–235.5 | 0.07 | 13 |
| Molybdenum disulfide | AMP | 1–386 | 0.028 | 43 |
| Silver/copper/multi-walled carbon nanotube | AMP | 1–1000 | 0.2 | 44 |
| Tin sulfide | AMP | 0.1–2830 | 0.0136 | 11 |
| Glassy carbon electrode modified with hierarchical porous carbon, silver sulfide nanoparticles and fullerene | DPV | 4–148 | 0.09 | 39 |
| Carbon spheres decorated with iron oxide/iron carbide/iron nanoparticles | AMP | 1–2540 | 0.06 | 45 |
| Near spherical zin oxide/glassy carbon electrode | CA | 0.6–5500 | 0.39 (CV) | 46 |
| LSV | 1.9–5900 | 0.89 (LSV) | ||
| Iron–nickel layered double hydroxide nanosheet arrays supported on carbon cloth | CV | 2–1000 | 0.4 | 47 |
| Silica/carbon/alumina/silica pyridinium chloride group | AMP | 0.2–280 | 0.01 | 48 |
| Carbon selenide nanofilms on carbon cloth | LSV | 0.5–1800 | 0.04 | 37 |
| Gold nanowires/carbon nano fibers/graphene | AMP | 1.98–3771 | 1.24 | 41 |
| Ammonia oxidizing bacteria (AOB) in biofilm sensor | AMP | 7–70 | 2.39 | 49 |
| 70–700 | ||||
| ZrO2@MWCNTs/SPE | Chrono-AMP (CA) | 5–100 | 0.94 | This work |
Nitrite sensor's selectivity testing
As the sensor is planned for real sample analysis, then it will be exposed to some sort of complex matrices. Therefore, testing its amperometric performance towards nitrite species mixed with other non-targeting analytes is necessary. Accordingly, 0.1 M of the non-targeted analytes solutions of sodium nitrate NO3−, potassium chloride, sodium benzoate, monosodium glutamate, potassium sulphate, sodium bicarbonate, and sodium tetraborate were prepared and their individual electrochemical behaviors were tested by CV Fig. 4S (ESI†). In addition, all the interferents were tested by CA. As a result, no obvious cyclic voltammetric or amperometric signals were generated from those tested foreigner species, while the sensor was responding quickly to the addition of the nitrite ions even in the presence of mixtures of the foreigner ions, as shown in Fig. 7. Thus, the newly designed nitrite sensor provides high selectivity and sensitivity supported by fast responses.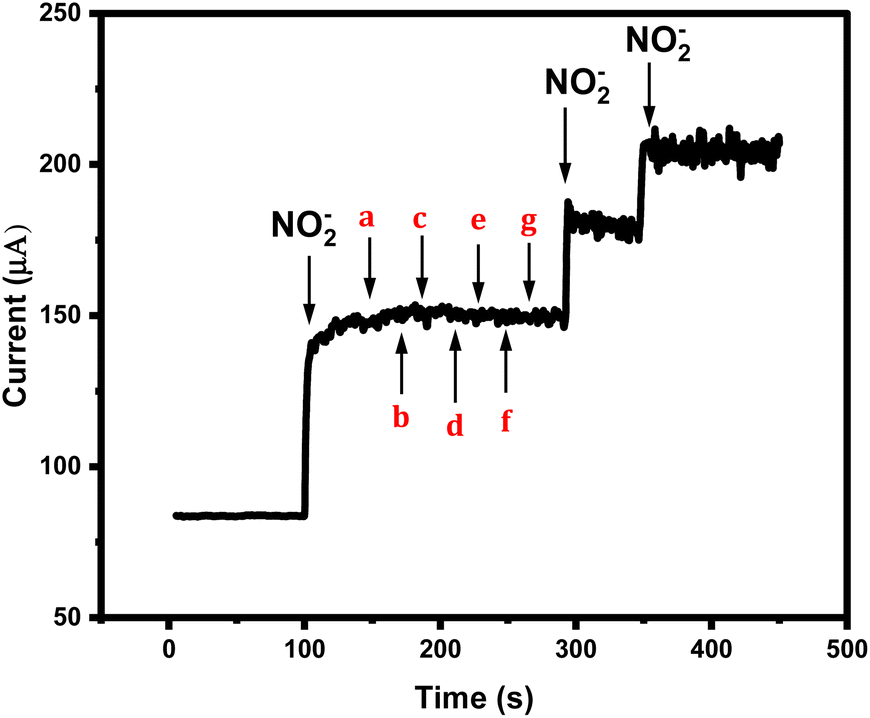 | ||
| Fig. 7 Chronoamperometric responses of targeting analyte (0.5 mM nitrite ions), and 0.1 M of non-targeting analytes including (a) nitrate, (b) chloride, (c) benzoate, (d) glutamate, (e) sulphate, (f) bicarbonate, (g) borate, with additions of 0.5 mM of nitrite in 0.1 M acetate buffer pH (4.5). | ||
Reproducibility and sensor's stability
To evaluate the reproducibility issue, amperometric measurements were carried out for a single concentration of nitrite, 8 mM, using several freshly prepared sensor chips. For each sensor chip, the obtained oxidation current intensity was very similar, as shown in Fig. 8a. Only a slight deviation of about 3.65% was observed, showing the high reproducibility level of the sensor surface. On the other hand, sensor stability and its lifetime were evaluated over four weeks after its fabrication, as can be seen in Fig. 8b. A deviation of 6% was obtained indicating the high stability of the sensor's fabrication.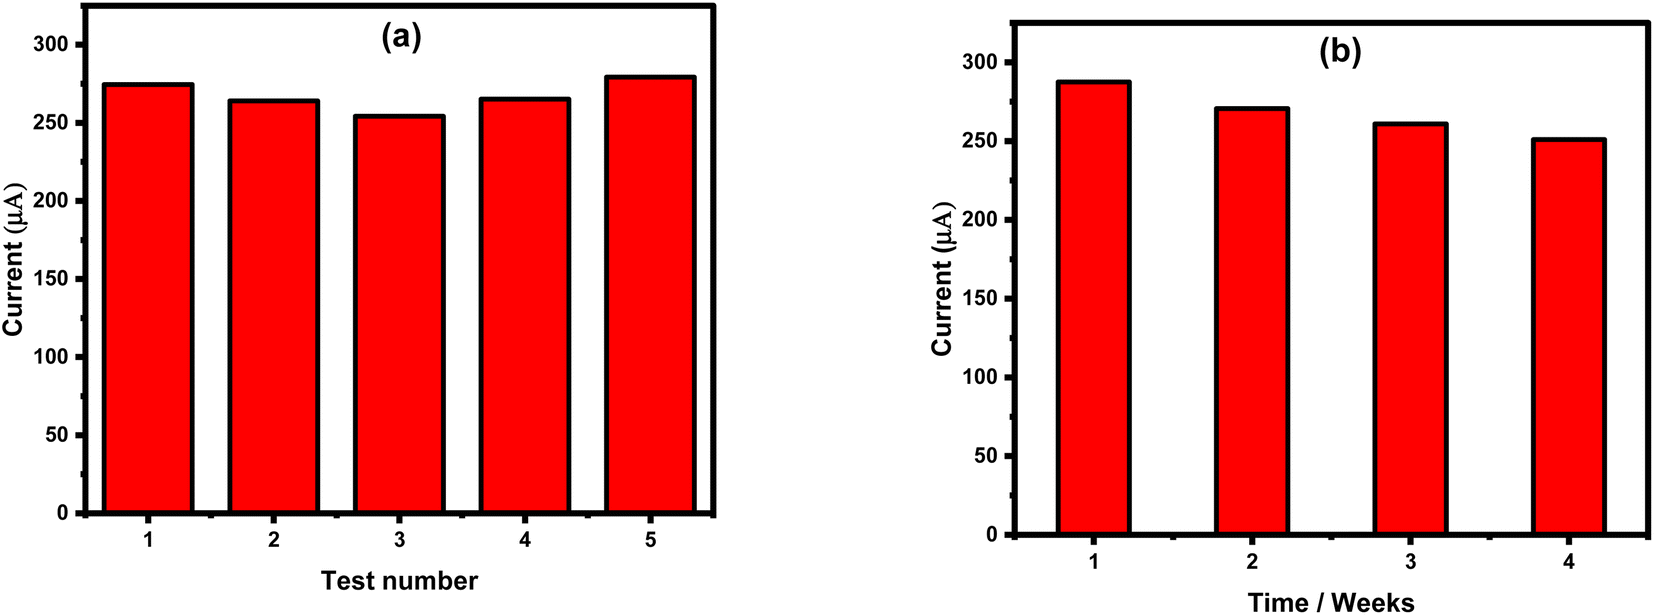 | ||
| Fig. 8 (a) CV responses of 8 mM nitrite with using multiple sensor chips. (b) CV responses of 8 mM nitrite with using a single sensor chip for multiple measurements in four different weeks. All optimal parameters were applied. | ||
Nitrite detection in real samples
As mentioned in the above section, the sensor is mainly designed for the practical application in real samples Fig. 5S (ESI†). The optimized assay offers high sensitivity and high selectivity towards nitrite analysis. Thus, determination of nitrite ions in several water and processed meat samples was established by applying the standard addition method. In this regard, raw processed food and water samples were tested chronoamperometrically (n = 3) using individual sensor chips. The electric response of each sample was tested before and after adding a standard nitrite solution, 45 μM, to each where the sample concertation was calculated based on the difference in the electric response. The obtained results are tabulated in (Table 2) showing high recoveries (from 99.86 to 102.89%) with the RSD (from 0.34 to 3.31%), confirming the high reliability of the sensor to be applied in real sample analysis. Although the nitrite ion was detected in the tap water, for the present sample, its concentration is very low relative to the WHO permissible limit (3.0 ppm).| Sample | Detected (μM) | NO2− added (μM) | Spiked (μM) | Recovery (%) | RSD (%), (n = 3) |
|---|---|---|---|---|---|
| a WHO permissible limit for nitrite 3.0 ppm recovery% = 100 × (spiked − detected)/NO2− added. | |||||
| Chicken salami | 4.37 ± 1.41 | 45 | 49.4 | 100.06 | 2.86 |
| Meat salami | 4.54 ± 0.17 | 45 | 49.5 | 99.91 | 0.34 |
| Sausage | 5.06 ± 0.35 | 45 | 50.0 | 99.86 | 0.72 |
| Burger | 4.55 ± 1.19 | 45 | 49.5 | 99.88 | 2.40 |
| Tap water | 0.41 ± 0.16 | 45 | 45.4 | 99.97 | 0.37 |
| Sheller water | 43.3 ± 1.78 | 45 | 89.6 | 102.89 | 1.99 |
| Wastewater | 2.55 ± 1.30 | 45 | 47.6 | 100.11 | 2.74 |
| Ground water | 2.60 ± 1.15 | 45 | 47.5 | 99.78 | 3.31 |
Based on the real samples results, the present nanomaterial is promising for constructing portable analysis systems suitable for the direct and onsite monitoring of nitrite concentrations, an ease sensors' fabrication, cheap and no previous experience is required for the system operation.
Conclusion
A new nanocomposite was introduced here as a sensor platform ZrO2@MWCNTs/SPE for the sensitive and selective determination of nitrite ions in food and water samples. Among a long list of metal oxide nanostructures, ZrO2exhibited superior electrochemical properties that were supported by the CV and EIS measurements. Conjugation of ZrO2 with the multi-walled carbon nanotubes forming the ZrO2@MWCNTs nanocomposite showed remarkable enhancements in the electrocatalytic activity and conductivity of the sensor surface. Chronoamperometric assay was fully optimized, and the sensor chips showed a high stability over a long period, in addition to the high stability and reproducibility. The specificity features of the sensors was evaluated by testing several non-targeting species, and with no general chronometric responses, the high selectivity was proven. Accordingly, real food and water samples were analyzed, and the results confirmed the high recovery. ZrO2@MWCNTs/SPE has a great promise for the sensitive and reliable detection of nitrite onsite. Android or IOS application smart phones for the onsite detection of nitrite by wireless portable potentiostats can be considered in the next approach.Conflicts of interest
The authors declare no conflict of interest.Acknowledgements
Rabeay Y. A. Hassan and coauthors acknowledge the Science, Technology & Innovation Funding Authority (STDF) for supporting the research project (STDF-33682).References
- M. Kim, S. Kim, W. Yang and J. Sim, Forensic Sci. Int., 2022, 335, 111279 CrossRef CAS.
- F. Ding, G. Zhang, C. Chen, S. Jiang, H. Tang, L. Tan and M. Ma, ACS Appl. Electron. Mater., 2021, 3, 761–768 CrossRef CAS.
- G. Berardi, M. Albenzio, R. Marino, T. D'Amore, A. Di Taranto, V. Vita and M. Iammarino, LWT--Food Sci. Technol., 2021, 150, 112004 CrossRef CAS.
- T. Zhe, M. Li, F. Li, R. Li, F. Bai, T. Bu, P. Jia and L. Wang, Food Chem., 2022, 367, 130666 CrossRef CAS PubMed.
- S. Nasraoui, A. Al-Hamry, P. R. Teixeira, S. Ameur, L. G. Paterno, M. Ben Ali and O. Kanoun, J. Electroanal. Chem., 2021, 880, 114893 CrossRef CAS.
- G. Manibalan, G. Murugadoss, S. Hazra, R. Marimuthu, C. Manikandan, R. Jothi Ramalingam and M. Rajesh Kumar, Inorg. Chem. Commun., 2022, 135, 109096 CrossRef CAS.
- P. Stamm, M. Oelze, S. Steven, S. Kröller-Schön, M. Kvandova, S. Kalinovic, A. Jasztal, A. Kij, M. Kuntic, M. T. Bayo Jimenez, B. Proniewski, H. Li, E. Schulz, S. Chlopicki, A. Daiber and T. Münzel, Nitric Oxide, 2021, 113–114, 57–69 CrossRef CAS PubMed.
- A. Bundgaard, I. M. Ruhr, A. Fago and G. L. J. Galli, Curr. Opin. Endocr. Metab. Res., 2020, 11, 55–64 CrossRef.
- R. Sha, A. Gopalakrishnan, K. V. Sreenivasulu, V. V. S. S. Srikanth and S. Badhulika, J. Alloys Compd., 2019, 794, 26–34 CrossRef CAS.
- Y. Wang, Z. Zeng, J. Qiao, S. Dong, Q. Liang and S. Shao, Talanta, 2021, 221, 121605 CrossRef CAS PubMed.
- S. Velmurugan, S. Palanisamy and T. C. K. Yang, Sens. Actuators, B, 2020, 316, 128106 CrossRef CAS.
- Z. Cheng, H. Song, X. Zhang, X. Cheng, Y. Xu, H. Zhao, S. Gao and L. Huo, Sens. Actuators, B, 2021, 346, 130525 CrossRef CAS.
- T. Zhe, R. Li, Q. Wang, D. Shi, F. Li, Y. Liu, S. Liang, X. Sun, Y. Cao and L. Wang, Sens. Actuators, B, 2020, 321, 128452 CrossRef CAS.
- Y. Yang, Q. Lei, J. Li, C. Hong, Z. Zhao, H. Xu and J. Hu, Microchem. J., 2022, 172, 106904 CrossRef CAS.
- H. Shi, L. Fu, F. Chen, S. Zhao and G. Lai, Environ. Res., 2022, 209, 112747 CrossRef CAS PubMed.
- H. S. Lim, S. J. Lee, E. Choi, S. B. Lee, H. S. Nam and J. K. Lee, Food Chem., 2022, 382, 132280 CrossRef CAS.
- V. Mariyappan, S.-M. Chen, K. Murugan, A. Jeevika, T. Jeyapragasam and R. Ramachandran, Colloids Surf., A, 2022, 637, 128271 CrossRef CAS.
- A. A. Chetty and S. Prasad, Food Chem., 2016, 197, 503–508 CrossRef CAS PubMed.
- H. Wang, N. Wan, L. Ma, Z. Wang, B. Cui, W. Han and Y. Chen, Analyst, 2018, 143, 4555–4558 RSC.
- Z. Cheng, H. Song, X. Zhang, X. Cheng, Y. Xu, H. Zhao, S. Gao and L. Huo, Sens. Actuators, B, 2022, 355, 131313 CrossRef CAS.
- Y. Wang, C. Yin and Q. Zhuang, J. Alloys Compd., 2020, 827, 154335 CrossRef CAS.
- P. B. Deroco, R. C. Rocha-Filho and O. Fatibello-Filho, Talanta, 2018, 179, 115–123 CrossRef CAS PubMed.
- X. Yuan, J. Chen, Y. Ling, S. Yu, S. Li, X. Wu and Z. Zhang, Microchem. J., 2022, 178, 107361 CrossRef CAS.
- Z. Yang, X. Zhou, Y. Yin, H. Xue and W. Fang, J. Alloys Compd., 2022, 164915, DOI:10.1016/j.jallcom.2022.164915.
- F. Zhu, H. Shi, C. Wang, X. Zhou, X. Zhang and F. Yang, Sens. Actuators, B, 2021, 332, 129454 CrossRef CAS.
- P. Janjani, U. Bhardwaj, R. Gupta and H. Singh Kushwaha, Anal. Chim. Acta, 2022, 1202, 339676 CrossRef CAS PubMed.
- H. Lei, H. Zhu, S. Sun, Z. Zhu, J. Hao, S. Lu, Y. Cai, M. Zhang and M. Du, Electrochim. Acta, 2021, 365, 137375 CrossRef CAS.
- G. Zhang, P. Pan, Z. Yang, H. Niu, J. Liu, C. Zhang, J. Meng, Y. Song, Q. Bao, J. Wei, G. Li and Z. Liao, Microchem. J., 2020, 159, 105439 CrossRef CAS.
- A. Karimi-Takallo, S. Dianat and A. Hatefi-Mehrjardi, J. Electroanal. Chem., 2021, 886, 115139 CrossRef CAS.
- Z. Liu, D. Liao, J. Yu and X. Jiang, Microchem. J., 2022, 175, 107216 CrossRef CAS.
- Z. S. Stojanović, A. D. Đurović, S. Ž. Kravić, A. M. Ashrafi and L. Richtera, Electroanalysis, 2023, 35, e202200446 CrossRef.
- F. Behoftadeh, M. Faezi Ghasemi, A. Mojtahedi, K. Issazadeh, M. Golshekan and S. Alaei, Arch. Microbiol., 2023, 205, 70 CrossRef CAS PubMed.
- A. H. Almuqrin, M. I. Sayyed and M. Elsafi, Radiat. Phys. Chem., 2023, 212, 111111 CrossRef CAS.
- A. Forootan, R. Sjöback, J. Björkman, B. Sjögreen, L. Linz and M. Kubista, Biomol. Detect. Quantif., 2017, 12, 1–6 CrossRef CAS.
- H. S. Magar, R. Y. A. Hassan and A. Mulchandani, Sensors, 2021, 21(19), 6578 CrossRef CAS PubMed.
- R. Y. A. Hassan, Sensors, 2022, 22(19), 7539 CrossRef CAS PubMed.
- T. Zhe, R. Li, F. Li, S. Liang, D. Shi, X. Sun, Y. Liu, Y. Cao, T. Bu and L. Wang, Food Chem., 2021, 340, 127953 CrossRef CAS PubMed.
- H.-M. Luo, D. Liu, Q. Gao and L. Xu, Inorg. Chem. Commun., 2020, 118, 107996 CrossRef CAS.
- A. Wong, A. M. Santos, A. A. Cardenas-Riojas, A. M. Baena-Moncada and M. Sotomayor, Food Chem., 2022, 383, 132384 CrossRef CAS PubMed.
- X.-T. Gao, Y.-F. Wang, L. Fu, R.-X. Zhang, R.-M. Li, Z.-H. Gao, Z.-F. Yan, Y.-M. Liu, W. Huang, L. Liu and Z.-J. Zuo, Int. J. Hydrogen Energy, 2023 DOI:10.1016/j.ijhydene.2023.05.009.
- H. T. Le, D. T. Tran, N. H. Kim and J. H. Lee, J. Colloid Interface Sci., 2021, 583, 425–434 CrossRef CAS PubMed.
- R. Li, F. Li, T. Zhe, M. Li, Y. Liu and L. Wang, Sens. Actuators, B, 2021, 342, 130061 CrossRef CAS.
- H. L. Zou, L. Y. Qin, H. Q. Luo, B. L. Li and N. B. Li, Sens. Actuators, B, 2021, 337, 129812 CrossRef CAS.
- Y. Zhang, J. Nie, H. Wei, H. Xu, Q. Wang, Y. Cong, J. Tao, Y. Zhang, L. Chu, Y. Zhou and X. Wu, Sens. Actuators, B, 2018, 258, 1107–1116 CrossRef CAS.
- L. Luo, Q.-Q. Xu, K.-K. Chen, Z.-G. Liu and Z. Guo, Sens. Actuators, B, 2023, 382, 133488 CrossRef CAS.
- Z. Cheng, H. Song, X. Zhang, X. Cheng, Y. Xu, H. Zhao, S. Gao and L. Huo, Colloids Surf., B, 2022, 211, 112313 CrossRef CAS PubMed.
- Y. Ma, Y. Wang, D. Xie, Y. Gu, H. Zhang, G. Wang, Y. Zhang, H. Zhao and P. K. Wong, ACS Appl. Mater. Interfaces, 2018, 10, 6541–6551 CrossRef CAS.
- M. Alsaiari, A. Saleem, R. Alsaiari, N. Muhammad, U. Latif, M. Tariq, A. Almohana and A. Rahim, Food Chem., 2022, 369, 130970 CrossRef CAS.
- X. Li, X. Yang, M. Cui, Y. Liu, J. Wang, L. Zhang and G. Zhan, Sci. Total Environ., 2022, 826, 154178 CrossRef CAS PubMed.
Footnote |
| † Electronic supplementary information (ESI) available. See DOI: https://doi.org/10.1039/d3ra03448h |
| This journal is © The Royal Society of Chemistry 2023 |