 Open Access Article
Creative Commons Attribution 3.0 Unported Licence
Fine control for the preparation of ceria nanorods (111)†
Changju Yang,
Xiang Ning,
Shanyong Chen,
Xiaoxia Hou,
Xiaoli Xia,
Zhiyang Zhang ,
Weiping Ding
 and
Luming Peng
 *
*
Key Laboratory of Mesoscopic Chemistry of MOE, School of Chemistry and Chemical Engineering, Nanjing University, Nanjing 210023, China. E-mail: luming@nju.edu.cn
First published on 14th July 2023
Abstract
The morphologies and exposed surfaces of ceria nanocrystals are important factors in determining their performance. In order to establish a structure–property relationship for ceria nanomaterials, it is essential to have materials with well-defined morphologies and specific exposed facets. This is also crucial for acquiring high resolution 17O solid-state NMR spectra. In this study, we explore the synthesis conditions for preparing CeO2 nanorods with exposed (111) facets. The effects of alkali concentration, hydrothermal temperature and time, cerium source and oxidation agent are investigated and optimal synthesis conditions are found. The resulting CeO2 nanorods show very narrow 17O NMR peaks for the oxygen ions in the first, second and third layers, providing a foundation for future research on mechanisms involving ceria materials using 17O solid-state NMR spectroscopy.
Introduction
CeO2, a rare-earth metal oxide with cubic fluorite structure, has many attractive properties and is critical in the chemical industry.1–5 It is particularly useful for providing oxygen in oxygen-deficient environments, generating nonstoichiometric oxide CeO2−x, while this reduced oxide can store oxygen under oxygen-rich conditions.6 Therefore, CeO2 finds multiple applications in redox catalysis, including as three-way catalysts (TWCs),7 in the water gas conversion reaction (WGS),8 oxidation of volatile organic matter,9 hydrogen purification,10 petroleum cracking,11 CO2 hydrogenation,12 and as a catalyst support.13 Its excellent properties can be ascribed to its special geometric structure14 and electronic structure,15 as well as the low activation energy barrier for generating lattice oxygen vacancies.Nanomaterials, which have attracted a lot of research attention recently, are often associated with better catalytic properties. It has been found that the morphologies16 and exposed facets of nanocrystals play a crucial role in controlling the catalytic activity and selectivity.17–20 In order to explore the relationship between structure and catalytic properties in detail, nanomaterials with well-defined morphologies and specific exposed facets are required. Many attempts have been made to prepare CeO2 nanocrystals with specific morphology and facets,21–23 and it is often necessary to control the synthesis conditions, including alkali concentration, hydrothermal temperature and anions in the cerium source.24,25
We have recently developed a new method based on 17O solid-state NMR spectroscopy for distinguishing oxygen ions in different surface layers or different facets in oxide nanomaterials according to the chemical shift.26,27 This method can be used to explore the detailed reaction mechanisms on these materials. The linewidths of the signals are dependent on the distribution of the local environments, such as bond angles and bond length. In order to obtain high resolution data and detailed structural information, the peak widths should be minimized. Therefore, CeO2 nanocrystals with specific morphology and facets are required. In this paper, we explore the template-free hydrothermal synthesis of CeO2 nanomaterials, and prepare CeO2 nanorods exposing mainly (111) facets by controlling the alkaline solution concentration, hydrothermal temperature and time, cerium source and oxidation agent. We show that the CeO2 nanorods prepared under optimized conditions exhibit very narrow linewidths in the 17O NMR spectrum.
Experimental section
Synthesis
CeO2 nanoparticles with different morphologies were synthesized using a hydrothermal method. Solutions of Ce(NH4)2(NO3)6, CeCl3 and Ce(NO3)3 were prepared with a concentration of 0.05 mol L−1 to serve as sources of cerium ions. NaOH solutions with different concentrations (0.1, 1, 3 and 6 mol L−1) were also prepared. Deionized water was used as the solvent in all the above solutions. To synthesize the CeO2 nanoparticles, the solution containing Ce ions was mixed with the NaOH solution at a volume ratio of 1![[thin space (1/6-em)]](https://www.rsc.org/images/entities/char_2009.gif) :
:![[thin space (1/6-em)]](https://www.rsc.org/images/entities/char_2009.gif) 7 under high-speed stirring at room temperature. The resulting mixture was stirred for 30 min and then transferred to a hydrothermal reactor for heating at 100 to 180 °C for 24 h. After the hydrothermal treatment, the product was filtered, washed with deionized water and ethanol until a neutral pH was obtained, and then heated in an oven at 80 °C for 3 h. Finally, the product was calcined at 700 °C for 3 h under an air atmosphere, with the calcination temperature determined using thermogravimetric analysis (TGA) data (Fig. S1†). Further details on the preparation procedures are discussed in the Results and discussion section.
7 under high-speed stirring at room temperature. The resulting mixture was stirred for 30 min and then transferred to a hydrothermal reactor for heating at 100 to 180 °C for 24 h. After the hydrothermal treatment, the product was filtered, washed with deionized water and ethanol until a neutral pH was obtained, and then heated in an oven at 80 °C for 3 h. Finally, the product was calcined at 700 °C for 3 h under an air atmosphere, with the calcination temperature determined using thermogravimetric analysis (TGA) data (Fig. S1†). Further details on the preparation procedures are discussed in the Results and discussion section.
Characterization
X-ray diffraction (XRD) was carried out on a Philips X'pert Pro diffractometer using Kα radiation from a Cu target (λ = 0.15418 nm) with a Ni filter. The operating current and voltage were 40 mA and 40 kV, respectively. The scanning range of 2θ was from 5° to 90°. Transmission electron microscopy (TEM) images of samples were taken on a JEOL-JEM-2010 transmission electron microscope operating at 100 kV. The TGA was carried out on a NETZSCH STA 449C, from room temperature to 700 °C. The BET surface area and pore size distribution were determined from nitrogen isotherm at 77 K on a Micromeritics TriStar II 3020 instrument. X-ray photoelectron spectroscopy (XPS) was performed using a PHI 5000 Versa Probe manufactured by ULVAC-PHI, Japan.17O magic angle spinning (MAS) nuclear magnetic resonance (NMR) experiments were performed on a Bruker Avance III 400 MHz solid-state NMR spectrometer using 4.0 mm MAS probes tuned to 17O at 54.2 MHz. 17O chemical shifts are referenced to H2O at 0.0 ppm. A short excitation pulse of 1.2 μs, corresponding to π/6 pulse for H2O, and a recycle delay of 5 s were used. Prior to NMR experiments, the CeO2 sample was placed in a glass tube, heated at 300 °C and exposed to vacuum for 12 h, before it was exposed to O2 (Sigma-Aldrich, 90% 17O) and further heated at 300 °C for 12 h. The sample was packed in zirconia MAS NMR rotor in a N2-filled glove box and spun at 14 kHz.
Results and discussion
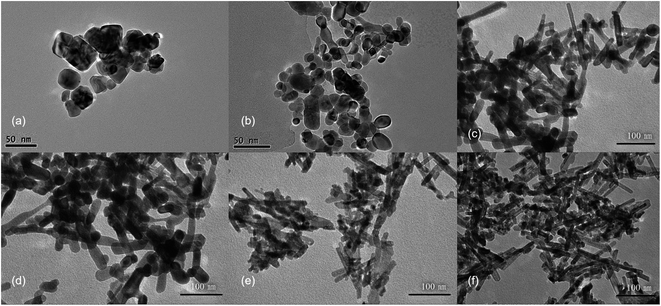
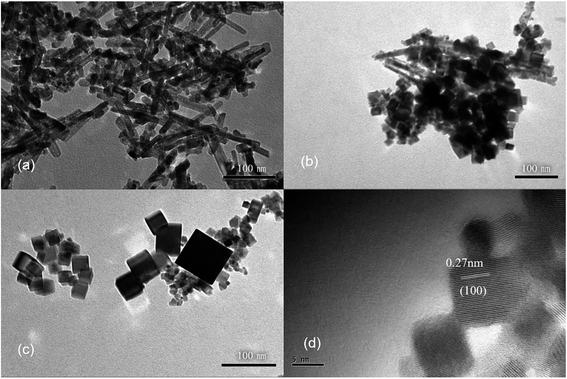
First, CeCl3 solution was poured into NaOH solutions at different concentrations to prepare CeO2 nanostructures. The XRD patterns (Fig. S2†) show characteristic diffraction peaks for CeO2 (JCPDS No. 34-0394). The relatively broad widths of the diffraction peaks, based on the Debye–Scherrer equation, suggests that the particle sizes should be relatively small. In addition, the widths of the diffraction peaks in XRD are similar for different samples, indicating that the sizes of different samples are similar. Transmission electron microscopy (TEM) was used to further characterize the CeO2 nanoparticles (Fig. 1), revealing that morphologies of different products are quite different, despite the similar sizes based on the XRD data. CeO2 samples generated with a low NaOH concentration of 0.1 to 1 mol L−1, are mainly irregular particles with sizes ranging from 30 to 50 nm (Fig. 1a and b). With increasing NaOH concentration (3 to 5 mol L−1), the products become rod-like, however, there is still a considerable proportion of nanoparticles in the product (Fig. 1c–e). When the concentration of the NaOH solution reaches 6 mol L−1, nanorods dominate with an average diameter of 10 nm, while a small number of nanoparticles also exists. These results indicate that a more concentrated alkali solution leads to more rapid dissolution/recrystallization rate of Ce(OH)3, and thus the rod-like morphology of CeO2.28To investigate the effects of hydrothermal temperature on the morphology, the alkali solution with a concentration of 6 mol L−1 was used, and three hydrothermal temperatures (100, 140 and 180 °C) were employed to prepare CeO2 nanostructures. The XRD patterns (Fig. S3†) confirm that the obtained products are pure CeO2. Despite the similarity of the XRD patterns, the TEM images of the three products are very different (Fig. 2). At a low hydrothermal temperature of 100 °C, nanorods with a diameter of 10 nm and some nanoparticles are obtained, while at a higher hydrothermal temperature of 140 °C, many nanocubes with a length of 25–40 nm show up in the products, along with fewer nanorods. Most of products are nanocubes with a slightly larger size of 25–50 nm at a hydrothermal temperature of 180 °C, and the HRTEM image show that these nanocubes mainly exposes (100) surface. Therefore, a low hydrothermal temperature of 100 °C is found to be very important to obtain nanorods exposing (111) facets.
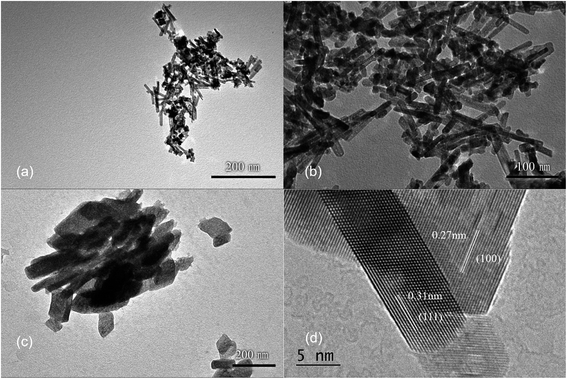
Next, hydrothermal treatment time was further optimized at a hydrothermal temperature of 100 °C using the alkali solution with a concentration of 6 mol L−1. Again, similar XRD patterns are observed for the products obtained with different hydrothermal times of 12, 24 and 36 h, confirming the formation of CeO2 phases (Fig. S4†). With a hydrothermal treatment time of 12 h, the product contains both nanorods and nanoparticles (Fig. 3a). With a longer hydrothermal time of 24 h, the amount of nanoparticles decreases and nanorods dominate, while the products are similar at a longer hydrothermal time of 36 h (Fig. 3b and c). These results suggest that a relatively long hydrothermal time of 24 h is required for the nanorods to form and thus 24 h is chosen as the optimized hydrothermal time.
It has been shown that the morphology of CeO2 nanoparticles may also be related to the Ce salts used present in the synthesis,29 therefore, different cerium sources were also tested toward the synthesis of CeO2 nanorods. Three common cerium compounds, including Ce(NH4)2(NO3)6, CeCl3 and Ce(NO3)3, which have different oxidation states for Ce, were selected for the synthesis. The XRD patterns (Fig. S5†) show that CeO2 phases can be obtained in all three cases. However, different morphologies are observed for the products. The TEM images show that nanorods dominate in the products, when using Ce(NO3)3 or CeCl3 as the cerium source (Fig. 4a and b). The CeO2 nanorods obtained have a diameter of approximately 10 nm in both cases, while the length of the nanorods is 100–200 nm with Ce(NO3)3 as the source and the length decreases to 20–50 nm if CeCl3 is used. However, when using Ce(NO3)3 as the cerium source, a small amount of nanocubes is attached to the nanorods, as shown by HRTEM (Fig. 4d). Because NO3− is more inclined to be adsorbed on (100) surface, it is conducive to the growth of nanocubes.29,30 In contrast, larger nanosheets are produced when Ce(NH4)2(NO3)6 is used as the starting material (Fig. 4c).
The differences observed in the products by using Ce3+ or Ce4+ salts as the source should be related to the formation mechanism of CeO2. Ce(OH)3 is first formed rapidly with Ce3+ salts as the starting materials, while it is further oxidized to form CeO2, which is expected to be slower. No oxidation process is required if Ce(NH4)2(NO3)6 is used as the cerium source, leading to a much faster process.31 Therefore, the slow oxidation in the hydrothermal process is expected to play a key role in the formation of CeO2 in a nanorod morphology.
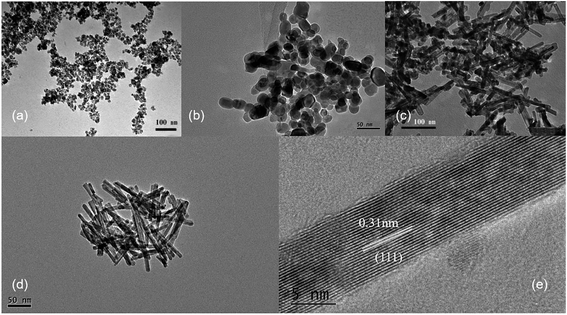
Ce3+ can be oxidized by a variety of methods, such as roasting oxidation, electrolytic oxidation, chemical oxidation and gas oxidation (such as oxygen gas or air).32 Here we investigated the effects using different chemical reagents or oxygen gas concentrations. The XRD patterns of the corresponding samples are shown in Fig. S6,† confirming the formation of CeO2 phases in all four cases. When H2O2 was used as the chemical oxidant, it was added to the suspension generated after quickly mixing CeCl3 and NaOH solution. Granular and relatively uniform nanoparticles with small particle sizes of approximately 15 nm are obtained (Fig. 5a). In order to reduce the oxidation rate, air was used as the oxidant, while a constant-flow pump was used to slowly drop the CeCl3 solution into the NaOH solution under vigorous stirring, in order to control the formation rate of Ce(OH)3 as well as oxidation, and the process was completed in 120 min. Again, the obtained products are granular and do not have specific shapes (Fig. 5b). Sample agglomeration also occurs, forming relatively large particles with a diameter of more than 50 nm, indicating that the reaction time for generating the precursor (Ce(OH)3) as well as the oxidation process is too long. By increasing the rate for dropping CeCl3 solution, the total reaction time can be decreased to 30 min, resulting in nanorod products with a small number of particles (Fig. 5c). By applying N2 atmosphere protection and fixing the reaction time to 30 min, the obtained samples are all rod-shaped (Fig. 5d). The average diameter is as small as 10 nm and the length is about 100–200 nm, which is associated with a large specific surface area (115 m2 g−1). The results suggest that very low oxygen pressure (trace oxygen in nitrogen environment) is one of the keys in preparing CeO2 nanorods.33 The reaction time for forming the precursor (Ce(OH)3), on the other hand, should be limited (i.e., adding CeCl3 solution to NaOH solution within 30 minutes) in order to avoid agglomeration. The HRTEM image of the same sample shown in Fig. 5d exhibits that the exposed surface of is (111), the most energetically favorable facet for CeO2 (Fig. 5e). This nanorod sample with the most uniform morphology exposing (111) facet is named as CeO2-NR(111).
Finally, we used solid-state NMR spectroscopy to study the local environments of oxygen in the CeO2-NR(111) sample, and compared the results to the spectrum of CeO2 nanorods prepared by literature method. To facilitate the comparison, the 17O NMR spectrum of commercially available micron-sized ceria was collected (Fig. 6c),26 which shows a sharp peak at 877 ppm, arising from the 4-coordinated oxygen ions (OCe4) in the bulk part of ceria. The 17O MAS NMR spectrum of CeO2-NR(111) enriched with 17O2 at 300 °C (Fig. 6a) shows four peaks at 1033, 920, 825 and 877 ppm, which can be assigned to the oxygen ions at the first, second, third layers of ceria (111) facets, and OCe4 in the bulk part of the nanostructure, respectively, according to the previous work,26 which confirms the successful preparation of CeO2 nanorods preferentially exposing (111) facets. CeO2 nanorods synthesized according to the method used in our previous 17O NMR paper (CeO2-L) show four peaks at 1033, 920, 825 and 877 ppm in the 17O MAS NMR spectrum (Fig. 6b) and the frequencies are similar to CeO2-NR(111).20,34 However, the peaks of CeO2-L are much broader than CeO2-NR(111) (Table 1), indicating that CeO2-NR(111) has a more ordered surface structure.35 Therefore, CeO2-NR(111) is a better material suitable for 17O NMR studies of ceria nanorods. It is worth mentioning that the additional peaks at 1033, 920 and 825 ppm due to oxygen ions at first, second and third layers are not observed in micron-sized ceria (Fig. 6c), which can be ascribed to the very small surface area and the corresponding low concentrations of these surface sites in this sample.
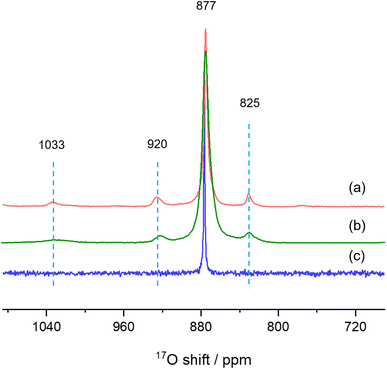 | ||
| Fig. 6 17O MAS NMR spectra of (a) CeO2-NR(111), (b) CeO2-L and (c) bulk ceria commercially available. | ||
| Chemical shift/ppm | FWHM(CeO2-NR(111))/ppm | FWHM(CeO2-L)/ppm |
|---|---|---|
| 831 | 5.3 | 17.1 |
| 877 | 3.8 | 8.2 |
| 926 | 10.9 | 16.6 |
| 1034 | 14.3 | 38.8 |
Conclusion
In this study, we explored the hydrothermal synthesis conditions for preparing CeO2 nanorods that exposes (111) facets with a well-defined structure suitable for 17O solid state NMR investigations. Several important factors affecting the morphology of CeO2 nanostructures were tested, including alkali solution concentration, hydrothermal temperature and time, cerium source and oxidation agent. The CeO2 nanorods prepared with the optimized conditions exhibit much narrower signals in the 17O MAS NMR spectrum, compared to the those prepared using the method from previous work. This study provides a foundation for future investigations into detailed mechanisms of reactions involving CeO2 nanorods (111) using 17O solid state NMR spectroscopy.Author contributions
C. Yang, L. Peng and W. Ding, contributed the design of the experiment and writing of the paper. X. Ning, X. Hou, and X. Xia carried out characterization of the samples. S. Chen and Z. Zhang took the TEM and HRTEM images of the samples. All the authors have given their approval to the final version of the manuscript.Conflicts of interest
The authors declare no competing interests.Acknowledgements
This work was supported by National Key R&D Program of China (2021YFA1502803), the National Natural Science Foundation of China (NSFC) (22272075), NSFC-Royal Society Joint Program (21661130149). Luming Peng thanks the Royal Society and Newton Fund for a Royal Society – Newton Advanced Fellowship. This work was also supported by a Project Funded by the Priority Academic Program Development of Jiangsu Higher Education Institutions.References
- J. Jones, H. Xiong, A. T. DeLaRiva, E. J. Peterson, H. Pham, S. R. Challa, G. Qi, S. Oh, M. H. Wiebenga, X. I. Pereira Hernández, Y. Wang and A. K. Datye, Science, 2016, 353, 150–154 CrossRef CAS.
- N. J. Divins, A. Braga, X. Vendrell, I. Serrano, X. Garcia, L. Soler, I. Lucentini, M. Danielis, A. Mussio, S. Colussi, I. J. Villar-Garcia, C. Escudero, A. Trovarelli and J. Llorca, Nat. Commun., 2022, 13, 5080 CrossRef CAS PubMed.
- W. C. Chueh, Y. Hao, W. Jung and S. M. Haile, Nat. Mater., 2012, 11, 155–161 CrossRef CAS.
- L. Schumacher, J. Weyel and C. Hess, J. Am. Chem. Soc., 2022, 144, 14874–14887 CrossRef CAS PubMed.
- W. C. Chueh, C. Falter, M. Abbott, D. Scipio, P. Furler, S. M. Haile and A. Steinfeld, Science, 2010, 330, 1797–1801 CrossRef CAS PubMed.
- N. V. Skorodumova, S. I. Simak, B. I. Lundqvist, I. A. Abrikosov and B. Johansson, Phys. Rev. Lett., 2002, 89, 166601 CrossRef CAS.
- C. R. Thomas, J. A. Pihl, V. Y. Prikhodko, M. K. Kidder, J. A. Lauterbach and T. J. Toops, Catal. Commun., 2021, 156, 106308 CrossRef CAS.
- T. R. Reina, M. Gonzalez-Castaño, V. Lopez-Flores, L. M. Martínez T, A. Zitolo, S. Ivanova, W. Xu, M. A. Centeno, J. A. Rodriguez and J. A. Odriozola, J. Am. Chem. Soc., 2022, 144, 446–453 CrossRef CAS PubMed.
- M. Ziemba, C. Schilling, M. V. Ganduglia-Pirovano and C. Hess, Acc. Chem. Res., 2021, 54, 2884–2893 CrossRef CAS.
- J. L. Ma, F. Ye, D. R. Ou, L. L. Li and T. Mori, J. Phys. Chem. C, 2012, 116, 25777–25782 CrossRef CAS.
- S.-H. Zhong, G. Lu and X.-Q. Gong, Chin. J. Catal., 2017, 38, 1138–1147 CrossRef CAS.
- K. Chang, H. Zhang, M.-j. Cheng and Q. Lu, ACS Catal., 2019, 10, 613–631 CrossRef.
- N. Acerbi, S. C. E. Tsang, G. Jones, S. Golunski and P. Collier, Angew. Chem., Int. Ed., 2013, 52, 7737–7741 CrossRef CAS PubMed.
- J. Paier, C. Penschke and J. Sauer, Chem. Rev., 2013, 113, 3949–3985 CrossRef CAS.
- Y.-J. Wang, H. Dong, G.-M. Lyu, H.-Y. Zhang, J. Ke, L.-Q. Kang, J.-L. Teng, L.-D. Sun, R. Si, J. Zhang, Y.-J. Liu, Y.-W. Zhang, Y.-H. Huang and C.-H. Yan, Nanoscale, 2015, 7, 13981–13990 RSC.
- F. Dong, Y. Meng, W. Han, H. Zhao and Z. Tang, Sci. Rep., 2019, 9, 12056 CrossRef PubMed.
- E. Aneggi, D. Wiater, C. de Leitenburg, J. Llorca and A. Trovarelli, ACS Catal., 2013, 4, 172–181 CrossRef.
- L. R. Smith, M. A. Sainna, M. Douthwaite, T. E. Davies, N. F. Dummer, D. J. Willock, D. W. Knight, C. R. A. Catlow, S. H. Taylor and G. J. Hutchings, ACS Catal., 2021, 11, 4893–4907 CrossRef CAS PubMed.
- A. K. P. Mann, Z. Wu, F. C. Calaza and S. H. Overbury, ACS Catal., 2014, 4, 2437–2448 CrossRef CAS.
- H. X. Mai, L. D. Sun, Y. W. Zhang, R. Si, W. Feng, H. P. Zhang, H. C. Liu and C. H. Yan, J. Phys. Chem. B, 2005, 109, 24380–24385 CrossRef CAS.
- Y. He, X. Liang and B. Chen, Chem. Commun., 2013, 49, 9000 RSC.
- J. Yang, H. Ding, J. Wang, N. Yigit, J. Xu, G. Rupprechter, M. Zhang and Z. Li, Top. Catal., 2020, 63, 1743–1753 CrossRef CAS.
- S. Wang, L. Zhao, W. Wang, Y. Zhao, G. Zhang, X. Ma and J. Gong, Nanoscale, 2013, 5, 5582 RSC.
- L. Yan, R. Yu, J. Chen and X. Xing, Cryst. Growth Des., 2008, 8, 1474–1477 CrossRef CAS.
- G. Shen, Q. Wang, Z. Wang and Y. Chen, Mater. Lett., 2011, 65, 1211–1214 CrossRef CAS.
- M. Wang, X. P. Wu, S. Zheng, L. Zhao, L. Li, L. Shen, Y. Gao, N. Xue, X. Guo, W. Huang, Z. Gan, F. Blanc, Z. Yu, X. Ke, W. Ding, X. Q. Gong, C. P. Grey and L. Peng, Sci. Adv., 2015, 1, e1400133 CrossRef PubMed.
- Y. Li, X. P. Wu, N. Jiang, M. Lin, L. Shen, H. Sun, Y. Wang, M. Wang, X. Ke, Z. Yu, F. Gao, L. Dong, X. Guo, W. Hou, W. Ding, X. Q. Gong, C. P. Grey and L. Peng, Nat. Commun., 2017, 8, 581 CrossRef PubMed.
- R. Ding, L. Yang, Y. Huang and J. Zhang, J. Synth. Cryst., 2015, 44, 1922–1928 CAS.
- Q. Wu, F. Zhang, P. Xiao, H. Tao, X. Wang, Z. Hu and Y. Lü, J. Phys. Chem. C, 2008, 112, 17076–17080 CrossRef CAS.
- J. Zhang, S. Ohara, M. Umetsu, T. Naka, Y. Hatakeyama and T. Adschiri, Adv. Mater., 2007, 19, 203–206 CrossRef CAS.
- J. J. Ketzial and A. S. Nesaraj, Journal of Ceramic Processing Research, 2011, 12, 74–79 Search PubMed.
- D. Zou, J. Chen, H. Cui, Y. Liu and D. Li, Ind. Eng. Chem. Res., 2014, 53, 13790–13796 CrossRef CAS.
- P. Abellan, T. H. Moser, I. T. Lucas, J. W. Grate, J. E. Evans and N. D. Browning, RSC Adv., 2017, 7, 3831–3837 RSC.
- Y. Gao, R. Li, S. Chen, L. Luo, T. Cao and W. Huang, Phys. Chem. Chem. Phys., 2015, 17, 31862–31871 RSC.
- J. Chen, M. A. Hope, Z. Lin, M. Wang, T. Liu, D. M. Halat, Y. Wen, T. Chen, X. Ke, P. Magusin, W. Ding, X. Xia, X. P. Wu, X. Q. Gong, C. P. Grey and L. Peng, J. Am. Chem. Soc., 2020, 142, 11173–11182 CrossRef CAS.
Footnote |
| † Electronic supplementary information (ESI) available. See DOI: https://doi.org/10.1039/d3ra02817h |
| This journal is © The Royal Society of Chemistry 2023 |

