DOI:
10.1039/D3RA03273F
(Paper)
RSC Adv., 2023,
13, 20674-20683
Comparative studies of upconversion luminescence and optical temperature sensing in Tm3+/Yb3+ codoped LaVO4 and GdVO4 phosphors
Received
17th May 2023
, Accepted 3rd July 2023
First published on 11th July 2023
Abstract
Tm3+/Yb3+ codoped LaVO4 and GdVO4 phosphors are successfully synthesized using solid state reaction methods and then upconversion emission studies are performed. X-ray diffraction has confirmed a pure monoclinic phase of LaVO4 and a tetragonal phase of GdVO4. Upconversion emission through 980 nm laser diode excitation has shown a strong blue band at 475 nm and two weak red bands at 647 and 700 nm originating from 1G4 → 3H6, 1G4 → 3F4 and 3F3 → 3H6 transitions of Tm3+ ions, respectively. Non-thermally coupled levels viz. 3F3 (700 nm) and 1G4 (475 nm) in both the phosphors are used for fluorescence intensity ratio based optical thermometric studies and a comparison is made. The FIR data against temperature were fitted with polynomial and exponential fittings. The results show that polynomial fitting has a higher absolute sensitivity of 21.2 × 10⁻³ K−1 at 653 K for the LaVO4: Tm3+/Yb3+ phosphor than the exponential fitting sensitivity of 19.0 × 10⁻³ K−1 at 653 K, while in the case of the GdVO4: Tm3+/Yb3+ phosphor both fitting functions provided the same value of absolute sensitivity, that is 13.0 × 10⁻³ K−1 at 653 K. A comparison of the sensitivity values shows that the LaVO4: Tm3+/Yb3+ phosphor provides higher sensitivity than the GdVO4: Tm3+/Yb3+phosphor but the latter one is too high in upconversion emission.
1. Introduction
Rare earth doped upconverting phosphors, which convert lower-energy photons to higher-energy photons, have triggered widespread interest in recent decades because of their excellent properties and vast potential applications in solar cells, display devices, light emitting diodes, bio-imaging, optical thermometry etc.1–8 Nevertheless, upconversion (UC) luminescent materials are currently hampered by low emission efficiency which restricts their field applications in several cases. Therefore, it is crucial to find ways to improve their UC efficiency. Several methods for the improvement in upconversion emission efficiency have been proposed so far and the selection of appropriate host, doping of light ions, use of plasmonic particles etc.9–11 are some popular ways for this purpose. For maximum upconversion efficiency a low phonon energy host is generally preferred that decreases nonradiative losses.12–14 In this aspect, fluoride hosts are found to be good but unfortunately they suffer lower chemical and photo-physical stability than oxides.14 Hence, researchers are trying to improve the upconversion emission with oxide hosts.
Among various oxide matrices, lanthanide orthovanadates (LnVO4; Ln: La, Gd, Y) are found crucial for doping of rare earth ions due to their distinct optical, chemical, and electronic properties. These lanthanide orthovanadates generally exist in tetragonal (t-) zircon type structure. The zircon type yttrium orthovanadate (YVO4) and gadolinium orthovanadate (GdVO4) have been studied for upconversion emission and strong upconversion luminescence is noted in these hosts.15,16 The LaVO4 host however, is found to exist in two polymorphs, either tetragonal (t-) zircon type structure or monoclinic (m-) monazite type structure depending upon the reaction methods.14 Lanthanide ions with a larger ionic radius prefer to choose monazite structure because of its higher oxygen coordination number (9).15 On the line of YVO4 and GdVO4 hosts it is expected that LaVO4 can be a good candidate for strong upconversion emission which is also revealed by Shao et al.17 It is feasible to create multi-colored emission by doping with various rare earth (Ln3+) ions, such as red from Eu3+, green from Er3+, and blue from Tm3+ ions. The LaVO4 is substantially less expensive and is based on a resource that is far more abundant than Y. The current objective is to synthesize LaVO4-based phosphor and to compare it with popular GdVO4 host. The thermodynamically stable monazite-type LaVO4 can be prepared via conventional solid–state reaction method. However, problem lies in the preparation of zircon type LaVO4 due to its metastable nature. Many researchers have synthesized zircon type LaVO4 through various synthesis methods. For instance, Oka et al.18 have reported the synthesis of high crystalline zircon type tetragonal LaVO4 using hydrothermal method. Similar observation is made by Jia et al., and according to them monazite and zircon phased LaVO4 nanocrystals may be produced hydrothermally and in a controlled manner using additives like EDTA.19
Among lanthanide ions the thulium Tm3+ ion emits strong upconversion emission spanning from ultravoliate (UV) to near-infrared (NIR) region upon 980 nm excitation. As a result, it is widely used activator ion for upconversion emission. Taking advantage of the efficient energy-transfer from sensitizer and activator, the Yb3+ ion as sensitizer is used with Tm3+ ion. The energy transfer from Yb3+ to other ions is effectively facilitated by the fact that the 2F7/2 → 2F5/2 transition of Yb3+ is strongly resonant with the f–f transitions of common upconverting lanthanide ions including Er3+, Tm3+, and Ho3+.20–24 Furthermore, the energy difference between the excited and the ground states of the Yb3+ ion is roughly 10![[thin space (1/6-em)]](https://www.rsc.org/images/entities/char_2009.gif) 000 cm−1, which corresponds to the low-cost 980 nm laser diode excitation. To the best of our knowledge, the literature does not have any reports on the upconversion and optical thermometric characteristics of either monazite-type or zircon-type LaVO4 codoped with Tm3+/Yb3+ ions.
000 cm−1, which corresponds to the low-cost 980 nm laser diode excitation. To the best of our knowledge, the literature does not have any reports on the upconversion and optical thermometric characteristics of either monazite-type or zircon-type LaVO4 codoped with Tm3+/Yb3+ ions.
Temperature sensing is crucial in a variety of sectors including research, industrial application, medicine, and others. Traditional temperature detection techniques frequently involve contact measurement and these thermometers often fall short of the demands for their applications in a variety of challenging and harsh environments such as in tissue cells.25 Therefore, temperature monitoring technique based on fluorescence intensity ratio (FIR) is regarded as promising due to its non-contact, high sensitivity, and broad detection range benefits.26 Change in FIR with temperature is often caused by repopulation of electrons in thermally coupled levels (TCLs) upon thermal excitation. The energy gap (ΔE) between thermally coupled levels should be in the range 200–2000 cm−1. In principle, a larger energy gap (ΔE) indicates higher sensitivity.27 Consequently, it is a serious issue to increase sensitivity while taking the smaller (ΔE) between TCLs into account. For example, the energy difference between 3F3 and 3H4 excited energy levels of Tm3+ ion is about 1817 cm−1, which is extremely near to the maximum limit range of TCLs. So these levels will give high temperature sensitivity.28,29 Most of the energy level pairs in rare earth ions are non-thermally coupled levels (NTCLs). In actuality, the luminescence produced by NTCLs is also temperature-dependent since it results from the emission bands of two excited states that behave differently as a function of temperature. As a consequence, the FIR between these states is substantially temperature-dependent. NTCLs-based FIR technique, opposed to TCL-based FIR technique, is not restricted by difference in energy levels and may thus have better temperature sensitivity.30,31
Herein, monoclinic LaVO4: Tm3+/Yb3+ and tetragonal GdVO4: Tm3+/Yb3+ phosphors were synthesized via conventional solid–state reaction method for comparison of upconversion emission and non-contact temperature sensitivity in the temperature range 300–653 K under 980 nm laser diode excitation. Non-thermally coupled level 3F3 and 1G4 of Tm3+ ion are utilized for temperature sensing application in both the phosphors. Colour tuning is also studied with the help of energy level and CIE chromaticity diagram.
2. Experimental
2.1. Materials
To synthesize Tm3+/Yb3+ codoped LaVO4 and GdVO4 phosphors, La2O3 (99.99%, Alfa Aesar), Gd2O3 (99.99%, Alfa Aesar), V2O5 (99.99%, Alfa Aesar), Tm2O3 (99.99%, Alfa Aesar), Yb2O3 (99.99%, Alfa Aesar) were taken as initial materials.
2.2. Synthesis
Monazite type LaVO4: Tm3+/Yb3+ and zircon type GdVO4: Tm3+/Yb3+ phosphors were synthesized by high-temperature solid–state reaction technique. For both hosts the concentrations of Tm3+ and Yb3+ were taken as 0.3 mol% and 5 mol%, respectively based on literature.28 The calculated amounts of Gd2O3, La2O3, V2O5, Tm2O3 and Yb2O3 were individually mixed and grinded homogeneously in an agate mortar for 1 h each using acetone as mixing medium. The obtained powder was kept in alumina crucible and then heated at a rate of 5° per min in an electrical furnace set to 1473 K for 8 hours. After cooling to ambient temperature, the materials were crushed to get fine powders for further characterizations.
2.3. Characterizations
Rigaku smartlab X-ray diffractometer with Cu Kα radiation source (λ = 0.15406 nm) was employed to determine the crystal phases of the produced phosphors. Agilent Cary 5000 UV-vis-NIR spectrophotometer in 200–1200 nm wavelength range was utilized to record the absorption spectra of the synthesized samples. A CCD-based spectrometer (Avantes, ULS2048 × 64) was used to record upconversion emission spectra of the prepared samples using 980 nm laser diode as the excitation source. A self-fabricated heating element was used to measure the temperature-dependent upconversion spectra in the temperature range of 300–653 K. To avoid the laser-induced optical heating of the material, the laser power was maintained at 66 mW. All the measurements were performed using the materials in powder form at room temperature.
3. Results and discussion
3.1. X-ray diffraction (XRD) analysis
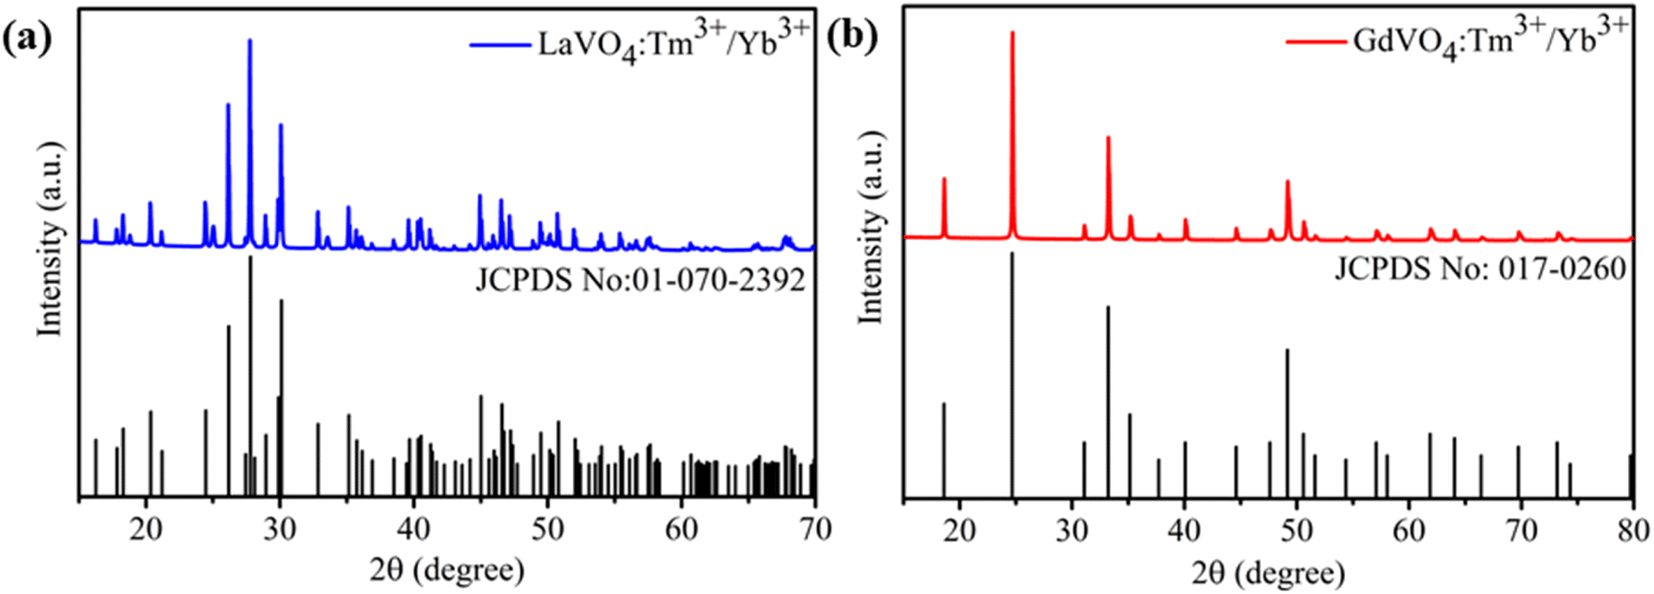
The XRD analysis was carried out to ascertain the phase identity and purity of both the prepared samples and recorded patterns are shown in Fig. 1(a and b). Fig. 1(a) shows the XRD pattern of the LaVO4: Tm3+/Yb3+ while Fig. 1(b) represents XRD pattern of GdVO4: Tm3+/Yb3+ phosphor. The diffraction peaks were well matched with the typical monoclinic phase of LaVO4 (JCPDS No: 01-070-2392) with the space group P21/n (14) and tetragonal phase of GdVO4 (JCPDS No: 017-0260) with space group I41/amd (141).15,32 There were no traces of impurity phases present in the recorded patterns. Here it is interesting to note that both the phosphors were prepared under similar environmental conditions but both have resulted different crystal phases. The GdVO4 sample is in its common crystal phase however, LaVO4 sample is in less common monoclinic phase. The doping position of Tm3+/Yb3+ ions in LaVO4 and GdVO4 hosts can be calculated on the basis of percentage radius variance (Δr), which can be given by;33
where Rh and Rd represents the ionic radii of host and doping ion, respectively. Using above formula, Δr (%) for V5+ (0.54 Å, CN = 6) with Tm3+ (0.88 Å, CN = 6) and Yb3+ (0.868 Å, CN = 6) ions are calculated to be 63% and 60.74% respectively. Whereas, Δr (%) for La3+ (1.032 Å, CN = 6) with Tm3+ (0.88 Å, CN = 6) and Yb3+ (0.868 Å, CN = 6) pairs are estimated to be 14.72% and 15.89% respectively. It is widely assumed that preferred replacement requires a radius variance (Δr) of about 15% between the dopant and host ions. So, this calculation favours the substitution of La3+ with Tm3+/Yb3+ ions. Similarly, for GdVO4: Tm3+/Yb3+ phosphor the Δr (%) for Gd3+ (0.935 Å, CN = 6) with Tm3+ (0.88 Å, CN = 6) and Yb3+ (0.868 Å, CN = 6) ions comes out to be 5.88% and 7.16%, respectively which favours the substitution of Gd3+ ion with Tm3+/Yb3+ pairs.
 |
| | Fig. 1 X-ray diffraction pattern of 0.3 mol% Tm3+/5 mol% Yb3+ codoped (a) monazite type LaVO4 (b) zircon type GdVO4 phosphors. | |
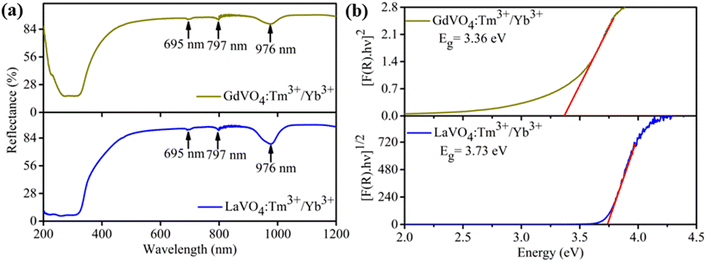
3.2. UV-vis-NIR absorption spectroscopy
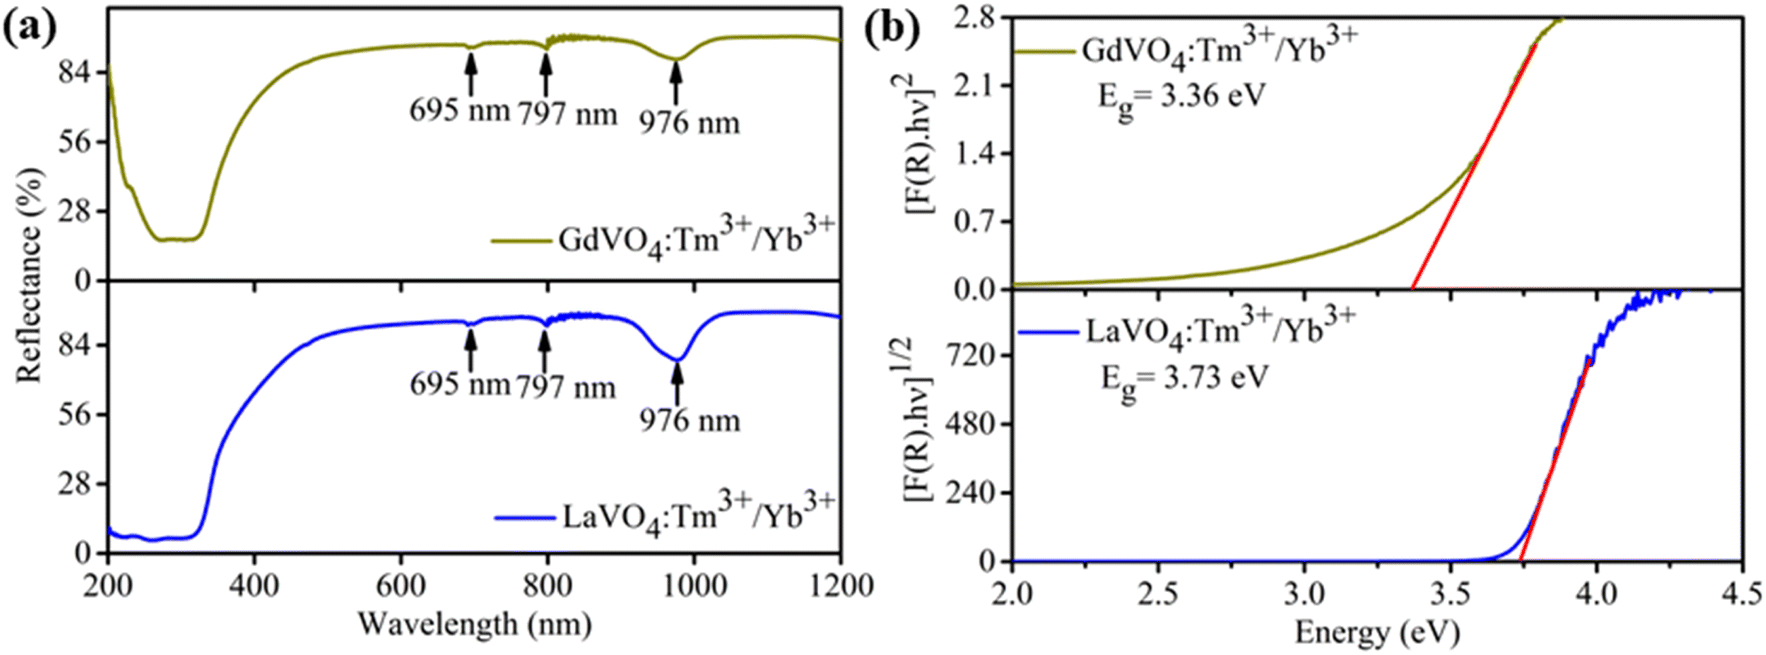
Fig. 2(a) depicts the UV-vis-NIR absorption spectra of 0.3 mol%Tm3+/5 mol% Yb3+: LaVO4 and 0.3 mol%Tm3+/5 mol% Yb3+: GdVO4 phosphors recorded in diffuse reflectance mode in the 200–1200 nm wavelength range. The spectra of both the phosphors show broad absorption bands between 200 and 400 nm, with two peaks centred at 260 and 305 nm. These peaks are arising due to charge transfer state (CTS) transitions from O2− to V+5 ions.34,35. Apart from these bands, both the spectra contain three absorption peaks due to 4f–4f transition of Tm3+ and Yb3+ ions. The band centred at 695 and 797 nm are attributed to 3F3 ← 3H6 and 3H4 ← 3H6 transitions of Tm3+ ion while the broad absorption band at 976 nm is present due to 2F5/2 ← 2F7/2 transition of Yb3+ ion.36
 |
| | Fig. 2 (a) UV-vis-NIR absorption spectra in diffuse reflectance mode of Tm3+/Yb3+ codoped monazite type LaVO4 and zircon type GdVO4 phosphors; (b) Kubelka–Munk plots to estimate the optical band gap energies of the synthesized phosphors. | |
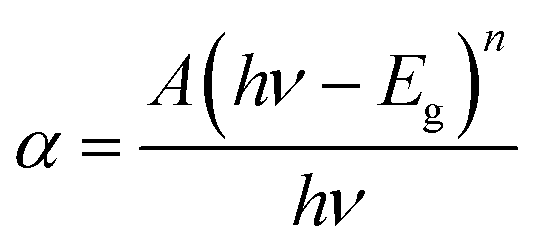
The above absorption spectra are further used to calculate the optical band gap of the samples. With the use of Wood–Tauc (W–T) formula and the Kubelka–Munk (K–M) function, the band gap of phosphor materials may be determined. The (W–T) formula for bandgap energy Eg is given by37
| |
 | (1) |
where
α is the linear absorption coefficient of the material,
Eg,
hν and
A are the optical bandgap energy, incident photon energy and
A is the proportionality constant, respectively. The K–M function is defined as
38| |
 | (2) |
where
K,
S and
R are the absorption coefficient, scattering factor and
R =
Rsample/
Rstandard known as reflectance of material, respectively. The optical band gap energy is estimated by combining
eqn (1) and
(2) which is given by;
| | |
[F(R)hν] = B(hν − Eg)n
| (3) |
where
B is a constant called the band tailoring parameter and
n is a constant that represents the nature of band transition and can have values 1/2, 2, 3/2 or 3 for allowed direct, allowed indirect, forbidden direct and forbidden indirect transitions, respectively. Previous reports indicate that monazite type LaVO
4 is an indirect band gap material while tetragonal GdVO
4 is a direct band gap material.
15,35,39,40 For estimation of band gap values, the plots of [
F(
R)
hν]
1/n versus hν for indirect and direct band gap transitions are shown in
Fig. 2(b). From the graph, the value of
Eg is extracted by extrapolating the linear fitted regions to [
F(
R)
hν]
1/n = 0. By this way, band gap for Tm
3+/Yb
3+ codoped monazite type LaVO
4 is determined to be 3.73 eV, and that of Tm
3+/Yb
3+ codoped zircon type GdVO
4 is estimated to be 3.36 eV. Both the calculated band gap values are in consistent with the reported results.
3.3. Upconversion emission and energy level diagram
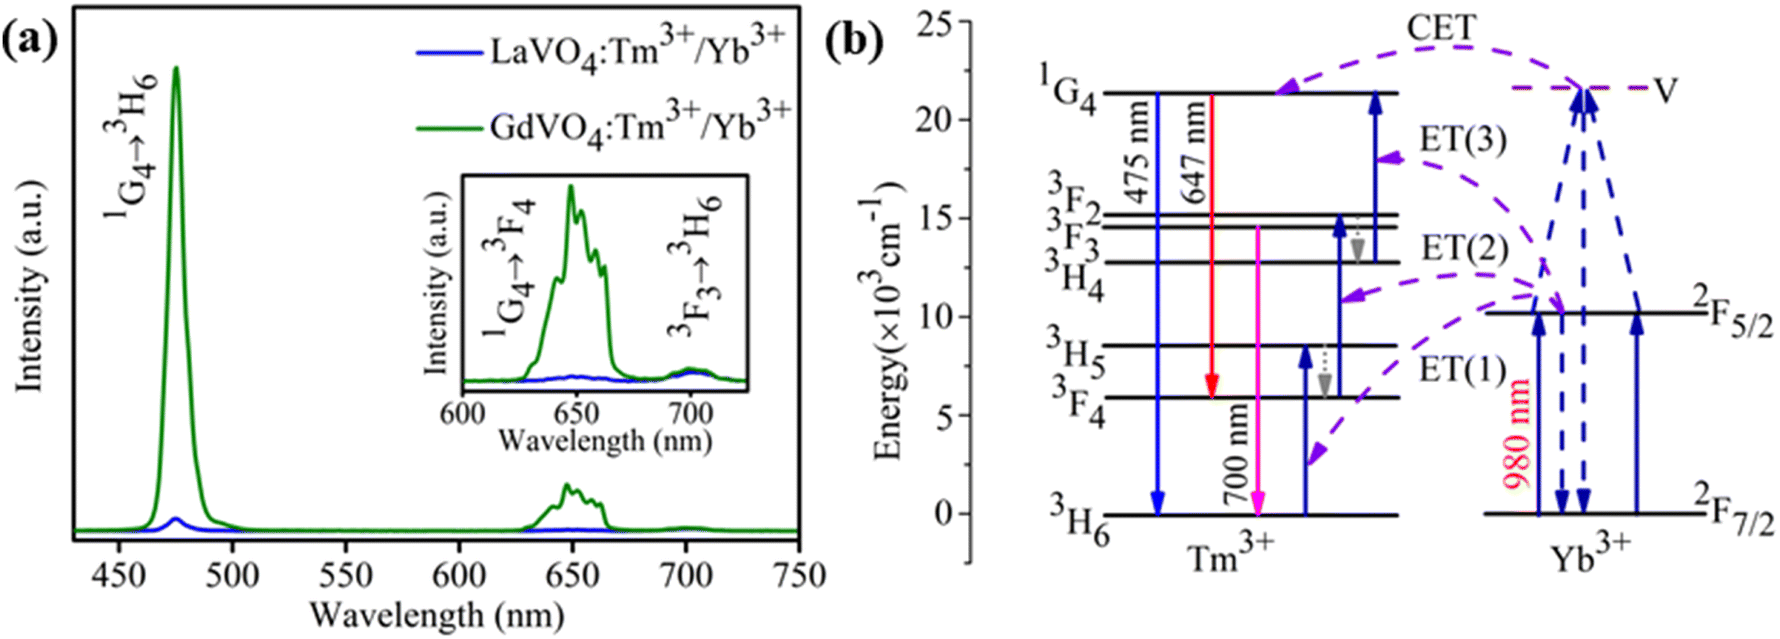
Fig. 3(a) compares the UC emission spectra of 0.3 mol% Tm3+/5 mol% Yb3+: LaVO4 and 0.3 mol% Tm3+/5 mol% Yb3+: GdVO4 phosphors at 66 mW excitation power of 980 nm laser diode. In both the phosphors, three emission bands are observed at 475, 647 and 700 nm wavelengths. These bands are attributed to the 1G4 → 3H6, 1G4 → 3F4 and 3F3 → 3H6 transitions of Tm3+ ion, respectively. It is interesting to see that UC emission intensity of GdVO4 phosphor is around 24 times higher than the LaVO4 phosphor, although both samples were synthesized under similar conditions and contain same concentrations of the dopant ions. Moreover, it was expected that monoclinic phase should show higher emission compared to the tetragonal phase due to lower symmetry in monoclinic phase. The blue emission (475 nm) is found to dominant over red bands (647, 700 nm) in both the phosphors. The inset of Fig. 3(a) shows the enlarged view of the spectra in wavelength range 600–730 nm for better visibility of weak emission bands.
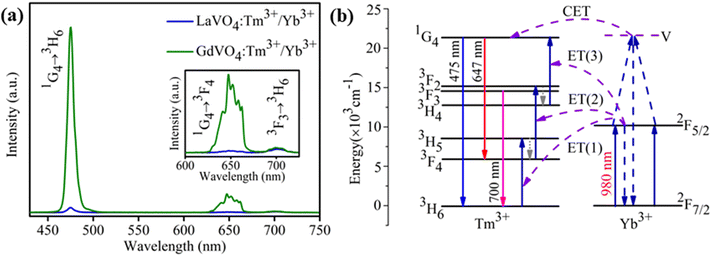 |
| | Fig. 3 (a) Comparison of upconversion emission spectra of 0.3 mol% Tm3+/5 mol% Yb3+ codoped LaVO4 and GdVO4 phosphors under 980 nm laser diode excitation; inset shows the enlarged spectra in 600–730 nm range; (b) energy level diagram of Tm3+ and Yb3+ ions with possible upconversion processes in both the hosts. | |
To better understand the observed UC emission bands in both the phosphors, energy level diagram is illustrated in Fig. 3(b). The Yb3+ ion works as sensitizer for this system as it has higher absorption cross-section for 980 nm excitation. After absorbing 980 nm photon energy Yb3+ ions excite to 2F5/2 level and then transfer the photon energy to nearby Tm3+ ion via various UC processes. After getting energy from Yb3+ through ET(1) process, ground state (3H6) Tm3+ ions are raised to excited state 3H5 followed by non-radiative decay to 3F4 level, while Yb3+ ion goes back to its ground state 2F7/2. The Tm3+ ions in 3F4 level again uplifted to 3F2 excited state by absorbing next 980 nm photon energy transferred via ET(2) process of Yb3+ ion. Tm3+ ions while coming back to 3H4 level non-radiatively, a part of them makes radiative transition from 3F3 to 3H6 by emitting red light of wavelength of 700 nm. Since Yb3+ ions continuously transfer their absorbed energy to Tm3+ ions resulting transition of Tm3+ ions from 3H4 to 1G4 level via ET (3) process. Some part of Tm3+ ions in 1G4 level make radiative emission to 3H6 ground state by emitting blue light at 475 nm while rest part of Tm3+ population in 1G4 state goes radiatively to 3F4 state via emission of 647 nm wavelength. It can be seen that 475 nm and 647 nm UC emission belongs to three photon absorption processes while 700 nm emission is due to two photon process.
3.4. Pump power dependence study
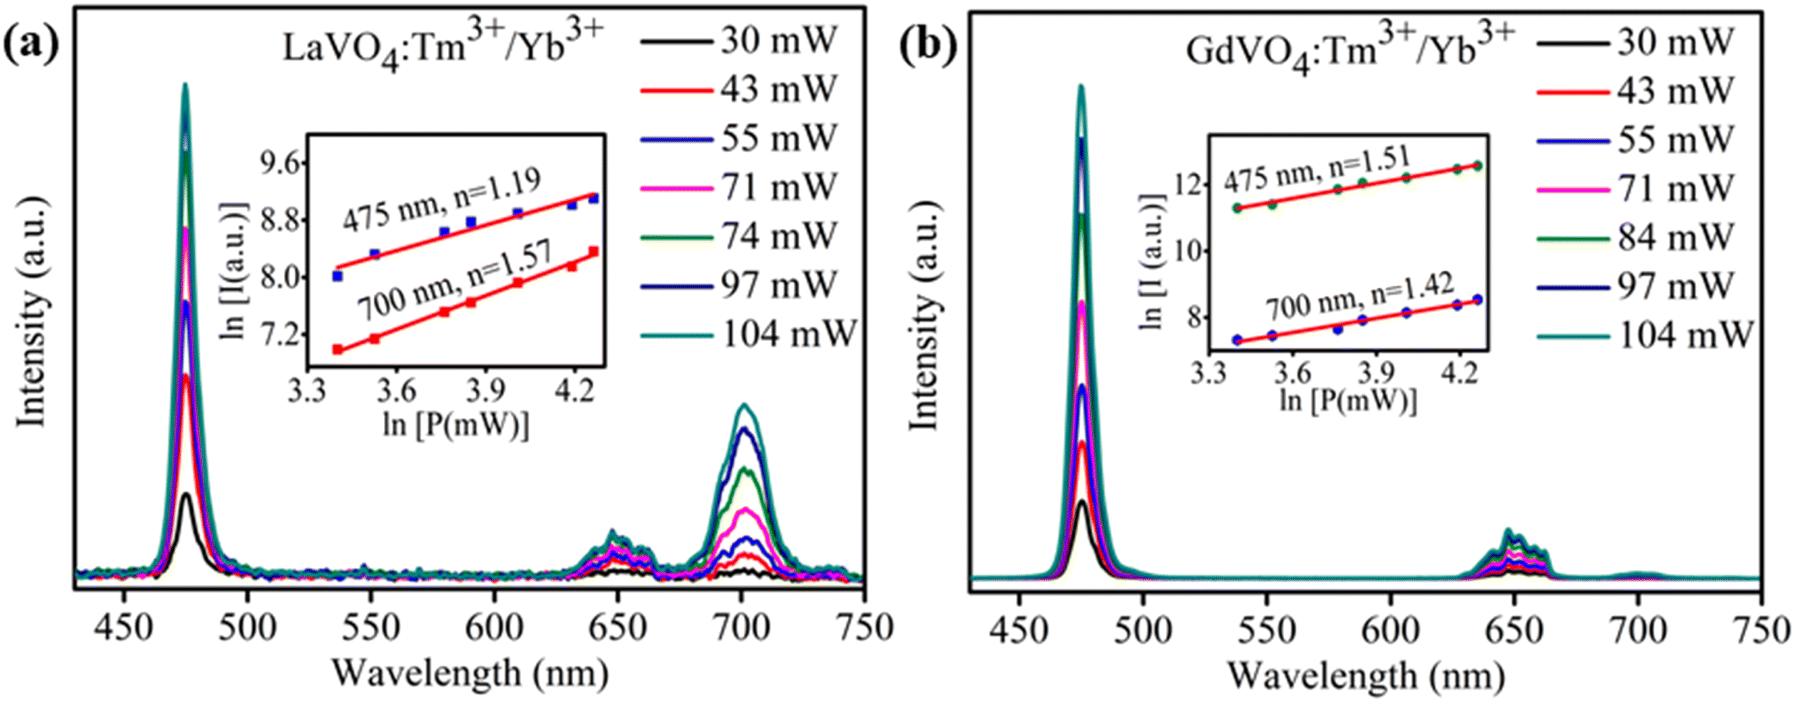
Fig. 4(a and b) shows the UC emission spectra of LaVO4 and GdVO4 based phosphors at various pump powers of 980 nm laser diode, respectively. The UC emission in both the samples increases upon increasing pump power from 30 to 104 mW. Interestingly, the red emission (700 nm) is found to increase rapidly in LaVO4 sample than the GdVO4. For an unsaturated UC process, emission intensity is related to the pump power as;41where I and P are the UC emission intensity and excitation pump power. ‘n’ is the number of NIR photons engaged in populating the emitting levels. Inset of Fig. 4(a and b) shows the ln–ln plot of UC emission intensity versus pump power for 1G4 → 3H6 (475 nm) and 3F3 → 3H6 (700 nm) transitions. It is found that for 475 and 700 nm emissions, the slopes are 1.19 and 1.57, respectively for LaVO4 sample whereas slopes of 1.51 and 1.42 respectively are found in GdVO4 sample. These values are presenting two photon processes for 475 and 700 nm emissions. However, the slope values for 700 nm in both the samples are in good agreement with two photon process as proposed by energy level diagram (Fig. 3(b)). But the observed slope values for 475 nm are less than expected value of ∼3. This may be due to the fact that the cooperative energy transfer (CET) process also takes part in UC emission. As represented in energy level diagram, 1G4 level of Tm3+ ion is populated from a virtual state (V) where two excited Yb3+ ion simultaneously transferred their energy. In this case, only 2 excitation photons are required to emit 475 nm photons. Hence, the slope values for 475 nm emission in both the systems are deviated from expected value of ∼3. Such kind of observations for Tm3+/Yb3+ doped systems are also reported by various researchers.26,41,42
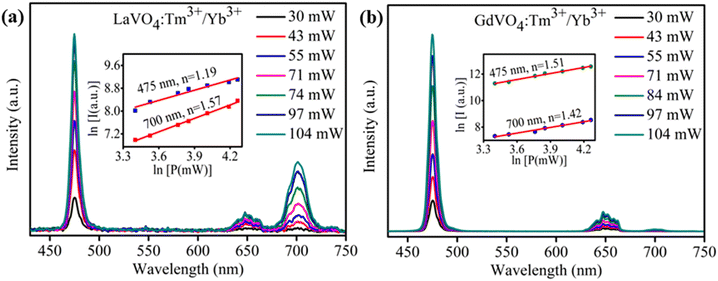 |
| | Fig. 4 Pump power dependent UC spectra of Tm3+/Yb3+ codoped (a) LaVO4 (b) GdVO4 phosphors. Inset of both figures represent the ln–ln plot of UC emission intensity versus excitation power. | |
3.5. Optical thermometry
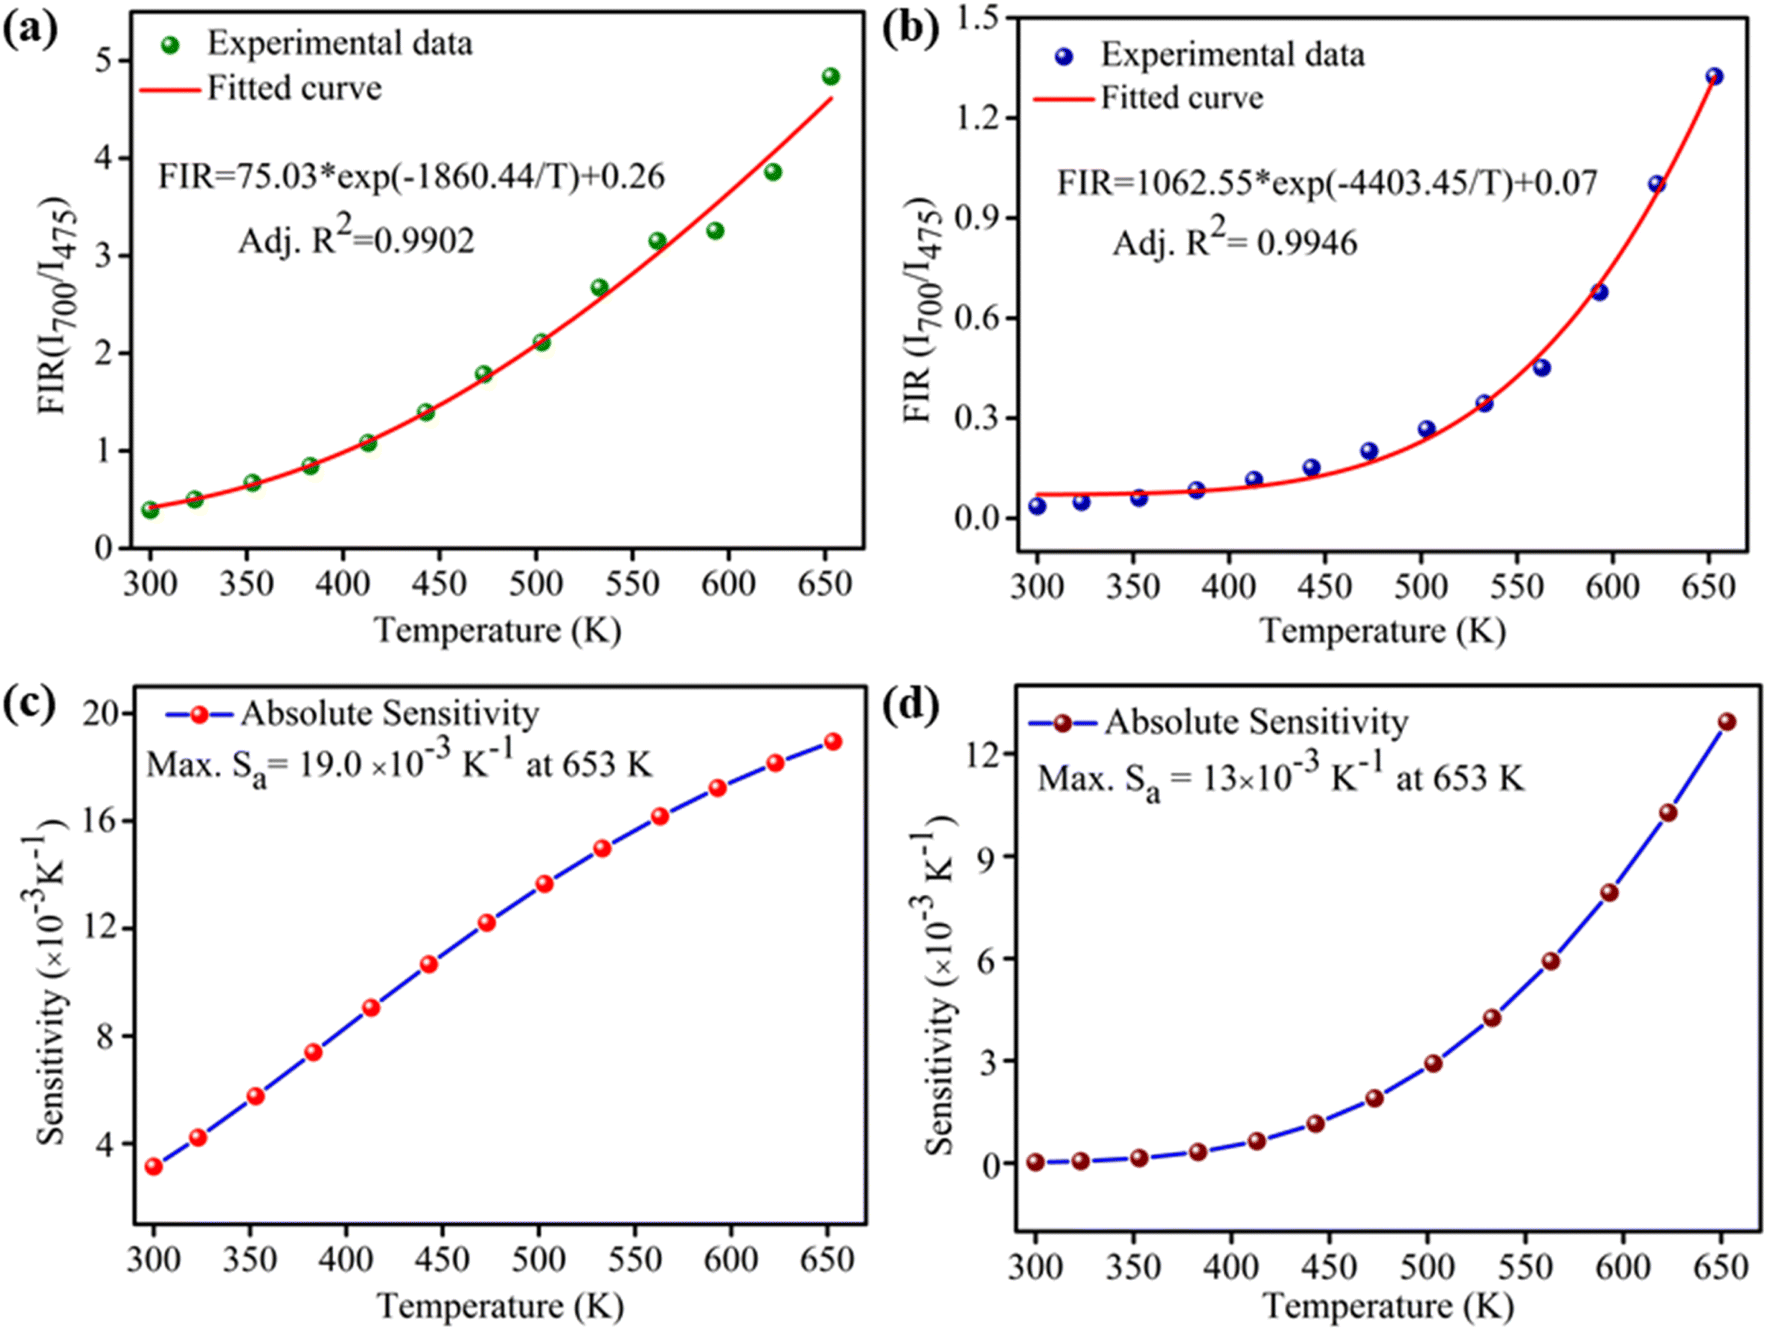
To explore the possibility of synthesized 0.3 mol% Tm3+/5 mol% Yb3+: LaVO4 and 0.3 mol% Tm3+/5 mol% Yb3+: GdVO4 phosphors for optical temperature sensing, the temperature dependent UC spectra were recorded in the temperature range 300–653 K upon 980 nm laser diode excitation, as shown in Fig. 5(a and b). The laser pump power was kept at minimum (∼66 mW) to avoid laser induced heating of the sample. It can be seen that UC emission intensity of 475 nm (1G4 → 3H6) and 647 nm (1G4 → 3F4) bands decreases with increasing temperature, while 700 nm (3F3 → 3H6) emission intensity increases with increasing temperature in both the samples. Since, 3F3 and 3H4 levels are the thermally coupled levels with energy gap of ∼1817 cm−1 (ref. 25) and hence thermal excitation increases the population of 3F3 from 3H4 level with enhancement of 700 nm band at elevated temperatures. Here authors have plotted the intensity ratio of red/blue bands (I700/I475) for both the phosphors against temperature and pump power. For the plot shown in Fig. 5(c and d) the intensity ratio (I700/I475) is found to increase faster for LaVO4 sample than the GdVO4 sample. Due to different intensity response of emission bands with temperature, the non-thermally coupled levels 3F3 and 1G4 (700 and 475 nm) of both the samples were utilized for fluorescence intensity ratio (FIR) based optical thermometry.
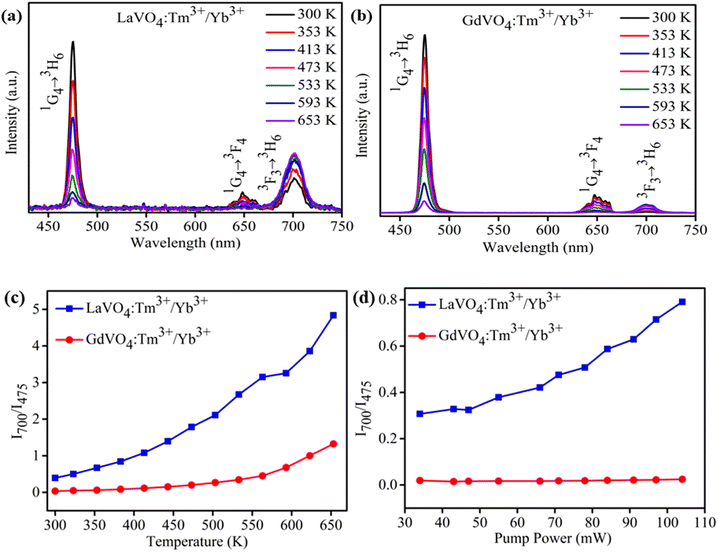 |
| | Fig. 5 (a) Temperature dependent UC spectra upon 980 nm laser excitation in temperature range 300–653 K of (a) Tm3+/Yb3+: LaVO4 (b) Tm3+/Yb3+: GdVO4 phosphors. Variation in the ratio of red/blue emission band (I700/I475) in both the phosphors at varying (c) temperature (d) pump power. | |
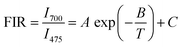
For non-thermally coupled levels (NTCLs), the FIR data can be well fitted through following exponential equation;27,30,43
| |
 | (5) |
where
A,
B and
C are constants whose values can be found by fitting the experimental data.
T denotes the absolute temperature. As illustrated in
Fig. 6(a and b), the best fits of FIR to temperature are FIR = 75.03 × exp(−1860.44/
T) + 0.26 and FIR = 1062.55 × exp(−4403.45/
T) + 0.07 for LaVO
4: Tm
3+/Yb
3+ and GdVO
4: Tm
3+/Yb
3+ samples, respectively. The absolute sensitivity (
Sa) is defined as the rate of change of FIR with temperature and expressed as;
43| |
 | (6) |
 |
| | Fig. 6 Exponential fitting of FIR data of non-thermally coupled levels (3F3 and 1G4) as a function of temperature for (a) Tm3+/Yb3+: LaVO4 (b) Tm3+/Yb3+: GdVO4 phosphors; absolute sensitivity as a function of temperature for (c) Tm3+/Yb3+: LaVO4 (d) Tm3+/Yb3+: GdVO4 phosphors. | |
Fig. 6(c and d) shows the plot of absolute sensitivity as a function of temperature for both the samples. It is observed that the sensitivity increases from room temperature to studied (653 K) temperature. The maximum sensitivity for LaVO4: Tm3+/Yb3+ phosphor is found to be 19.0 × 10⁻³ K−1 at 653 K (Fig. 6(c)) whereas, maximum sensitivity for GdVO4: Tm3+/Yb3+ phosphor is found to 13.0 × 10⁻³ K−1 at 653 K (Fig. 6(d)). However, it seems that sensitivity of GdVO4 will increase above 653 K. The observed value is compared with Tm3+/Yb3+ codoped samples in which TCLs are utilized for temperature sensing measurement as given in Table 1.
Table 1 Comparison of absolute sensitivity of Tm3+ doped luminescent materials
| Samples |
Transitions |
Temperature range (K) |
Sa-max (×10−3 K−1) |
Ref. |
| LaVO4: Tm3+/Yb3+ (exponential fitting) |
3F3 → 3H6 |
300–653 |
19.00 (653 K) |
This work |
| 1G4 → 3H6 |
| LaVO4: Tm3+/Yb3+ (polynomial fitting) |
3F3 → 3H6 |
300–653 |
21.20 (653 K) |
This work |
| 1G4 → 3H6 |
| GdVO4: Tm3+/Yb3+ (exponential fitting) |
3F3 → 3H6 |
300–653 |
13.00 (653 K) |
This work |
| 1G4 → 3H6 |
| GdVO4: Tm3+/Yb3+ (polynomial fitting) |
3F3 → 3H6 |
300–653 |
13.00 (653 K) |
This work |
| 1G4 → 3H6 |
| Bi7F11O5: Tm3+/Yb3+ |
3F3 → 3H6 |
303–573 |
14.00 (303 K) |
46 |
| 3H4 → 3H6 |
| SrWO4: Tm3+/Yb3+ |
3F3 → 3H6 |
308–573 |
6.17 (323 K) |
5 |
| 3H4 → 3H6 |
| BaGd2ZnO5: Tm3+/Yb3+ |
1G4(1) → 3H6 |
313–573 |
5.50 (323 K) |
47 |
| 1G4(2) → 3H6 |
| Na2Y2B2O7: Tm3+/Yb3+ |
1G4(i) → 3H6 |
300–623 |
4.54 (300 K) |
48 |
| 1G4(j) → 3H6 |
| Y2O3: Tm3+/Yb3+ |
1G4(a) → 3H6 |
303–753 |
3.50 (303K) |
26 |
| 1G4(b) → 3H6 |
| ZnWO4: Tm3+/Yb3+/Mg2+ |
1G4(1) → 3H6 |
300–600 |
3.40 (300 K) |
49 |
| 1G4(2) → 3H6 |
| Y2O3: Tm3+/Yb3+/Gd3+ |
1G4(a) → 3H6 |
298–533 |
1.33 (298 K) |
20 |
| 1G4(b) → 3H6 |
| CaZnOS: Tm3+/Yb3+ |
1G4(a) → 3H6 |
303–423 |
1.00 (303 K) |
44 |
| 1G4(b) → 3H6 |
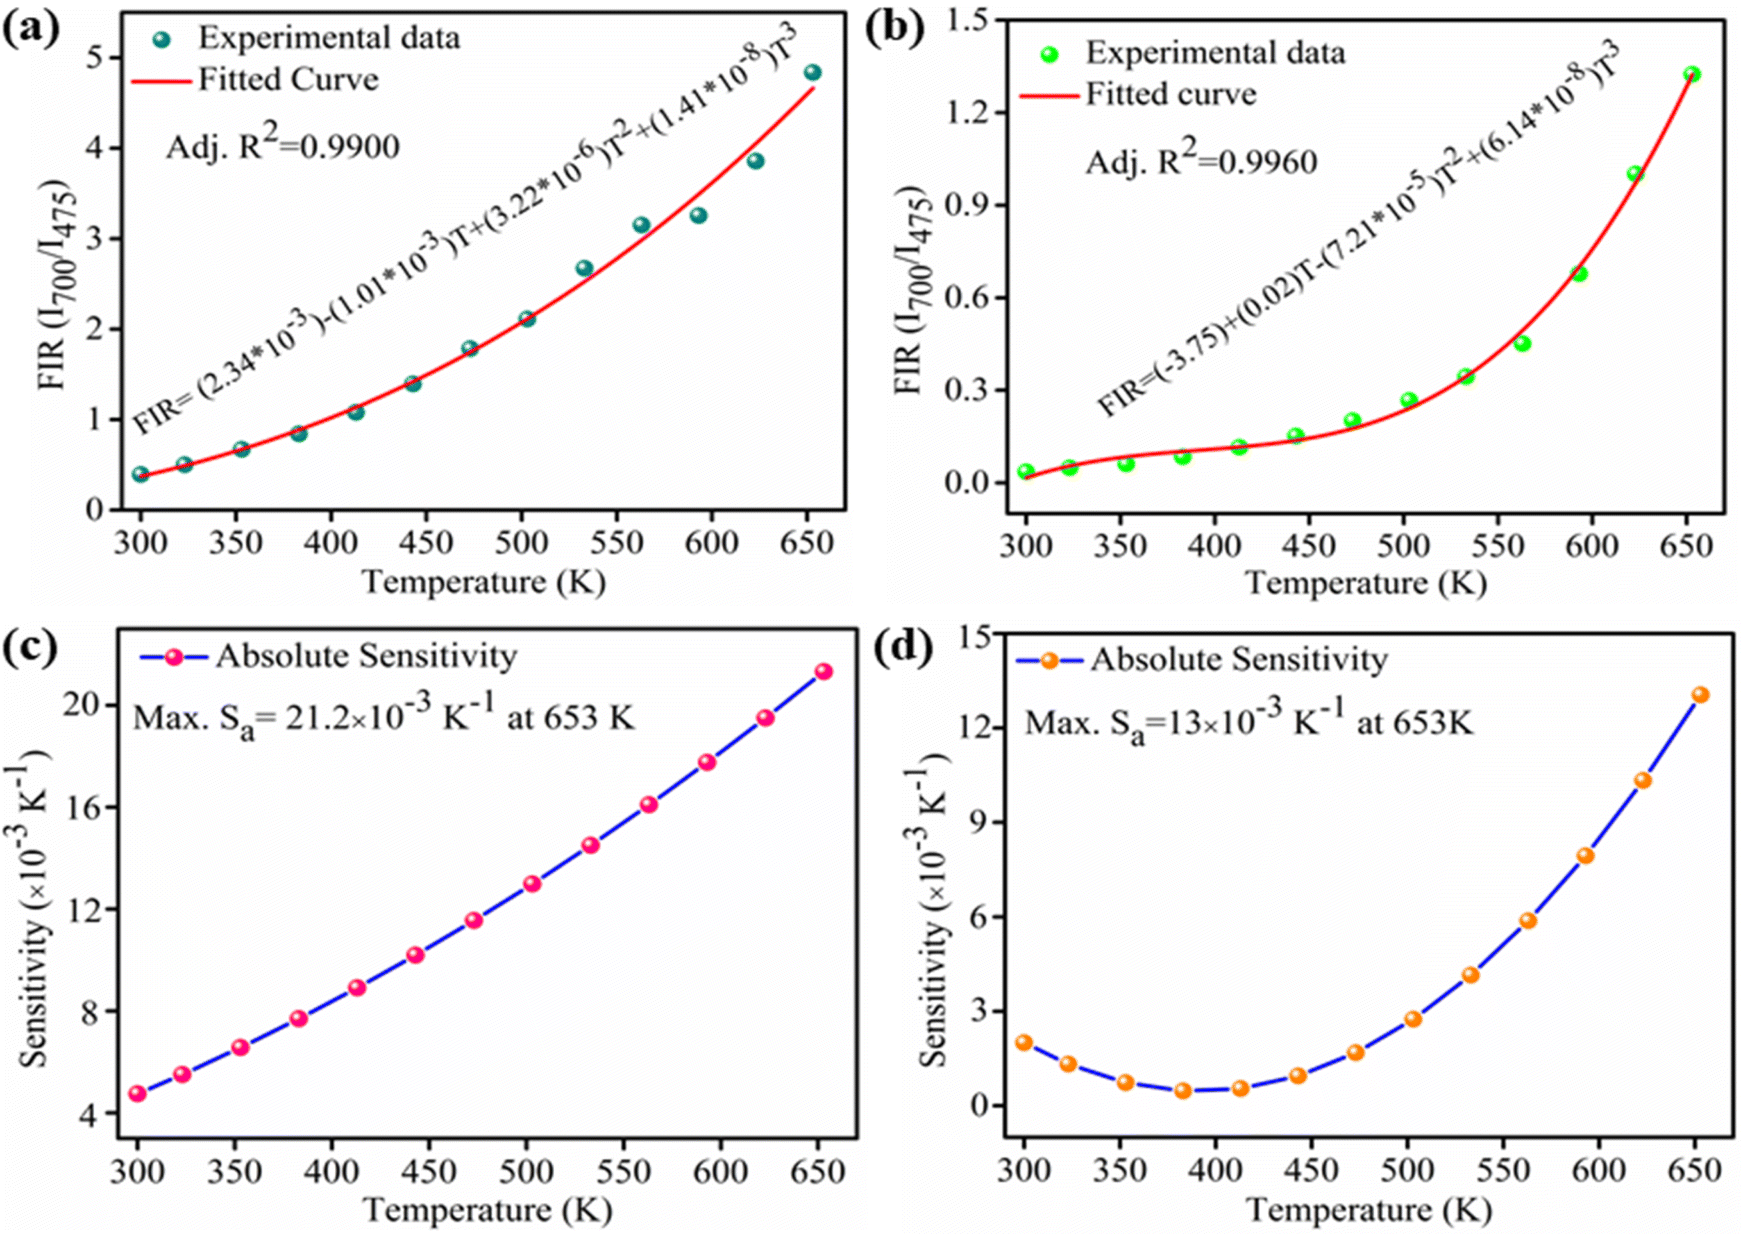
Some authors have also fitted FIR data of NTCLs with help of polynomial equation.44,45 So, to examine the difference between both the fittings, we have fitted the same FIR data with the polynomial equation as given below;
| |
 | (7) |
where
A,
B,
C and
D are the constants. As shown in
Fig. 7(a and b) the FIR
versus temperature data can be well fitted by above polynomial equation. The best fit of FIR to temperature for LaVO
4: Tm
3+/Yb
3+ is FIR= (2.34 × 10
−3) − (1.01 × 10
−3)
T + (3.22 × 10
−6)
T2 + (1.41 × 10
−8)
T3 and for GdVO
4: Tm
3+/Yb
3+ is FIR = (−3.75) + (0.02)
T − (7.21 × 10
−5)
T2 + (6.14 × 10
−8)
T3. The absolute sensitivity using
eqn (7)can be written as,
| |
 | (8) |
 |
| | Fig. 7 Polynomial fitting of FIR data of NTCLs (3F3 and 1G4) as a function of temperature for (a) Tm3+/Yb3+: LaVO4 (b) Tm3+/Yb3+: GdVO4 phosphors; absolute sensitivity as a function of temperature for (c) Tm3+/Yb3+: LaVO4 (d) Tm3+/Yb3+: GdVO4 phosphors. | |
The calculated sensitivity as a function of temperature is shown in Fig. 7(c and d) for both the samples. The maximum absolute sensitivity for LaVO4: Tm3+/Yb3+ phosphor is found to be 21.2 × 10⁻³ K−1 at 653 K (Fig. 7(c)) whereas, absolute sensitivity for GdVO4: Tm3+/Yb3+ phosphor is calculated to be 13.0 × 10⁻³ K−1 at 653 K (Fig. 7(d)). Only slight variation in sensitivity is seen for both the fittings and it can be concluded that both the techniques are equally well.
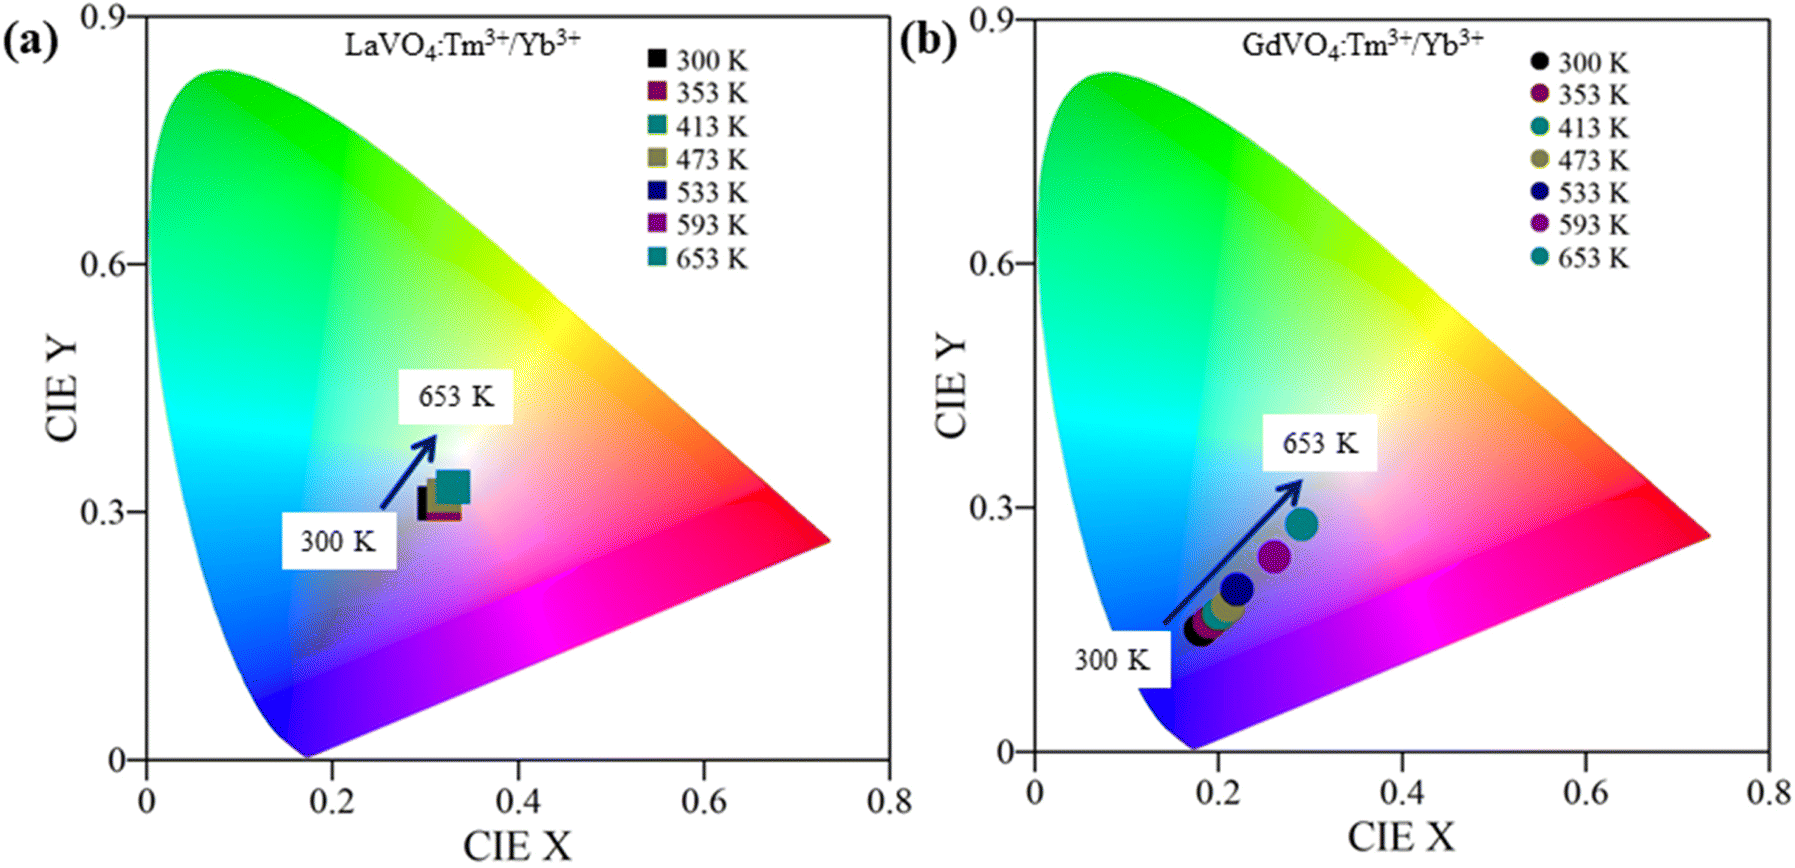
3.6. CIE chromaticity diagram
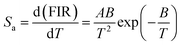
Colour coordinates study of prepared phosphors at various temperatures was done in the temperature range of 300–653 K under 980 nm laser excitation at fixed pump power of 66 mW. The coordinates are shown in CIE plot in Fig. 8(a and b). The colour tuning behaviour is prominent in GdVO4 phosphor. Coordinates of LaVO4: Tm3+/Yb3+ phosphor are only slightly shifted from light blue (0.31, 0.31) to pure white (0.33, 0.33) with increasing temperature as shown in Fig. 8(a). On other hand, GdVO4: Tm3+/Yb3+ phosphor shows deep blue colour (0.18, 0.15) at 300 K and approaches nearly white light (0.29, 0.28) at 653 K, shown in Fig. 8(b).
 |
| | Fig. 8 CIE colour chromaticity diagram of (a) LaVO4: 0.3 mol% Tm3+/5 mol% Yb3+ (b) GdVO4: 0.3 mol% Tm3+/5 mol% Yb3+ phosphors. Colour change is more prominent is GdVO4 phosphor. | |
4. Conclusions
The LaVO4: Tm3+/Yb3+ and GdVO4: Tm3+/Yb3+ upconversion phosphors were successfully synthesized using solid state reaction method. The LaVO4 sample is found in monoclinic crystal phase while GdVO4 is found in tetragonal crystal phase. Upon 980 nm laser diode excitation the GdVO4: Tm3+/Yb3+ has resulted several fold intense blue upconversion emission than the LaVO4: Tm3+/Yb3+ phosphor. The non-thermally coupled levels viz. 3F3 (700 nm) and 1G4 (475 nm) were utilized for optical thermometry in both the phosphors and two different functions were used for fitting the FIR versus temperature data. For LaVO4: Tm3+/Yb3+ phosphor, exponential fitting gives a maximum absolute sensitivity of 19.0 × 10⁻³ K−1 at 653 K while polynomial fitting provides a maximum value of 21.2 × 10⁻³ K−1 at 653 K. Similarly, for GdVO4: Tm3+/Yb3+ phosphor, maximum absolute sensitivity of 13.0 × 10⁻³ K−1 at 653 K is observed using the both kind of fitting functions. It is concluded that LaVO4: Tm3+/Yb3+ phosphor provides higher sensing sensitivity compared to GdVO4: Tm3+/Yb3+ phosphor.
Conflicts of interest
There are no conflicts to declare.
Acknowledgements
Madan M. Upadhyay is thankful to IIT(ISM) Dhanbad for providing financial support in terms of Senior Research Fellowship (SRF). Authors also acknowledge DST-SERB, New Delhi India (Project no: EMR/000228/2017) for the lab facilities.
References
- Y. Du, Y. Wang, Z. Deng, X. Chen, X. Yang, T. Sun, X. Zhang, G. Zhu, S. F. Yu and F. Wang, Adv. Opt. Mater., 2020, 8, 1900968 CrossRef CAS.
- P. Ramasamy, P. Manivasakan and J. Kim, RSC Adv., 2014, 4, 34873–34895 RSC.
- Y. Zhong, I. Rostami, Z. Wang, H. Dai and Z. Hu, Adv. Mater., 2015, 27, 6418–6422 CrossRef CAS PubMed.
- A. Chen, H. Gong, R. Wei, H. Guo and F. Hu, J. Alloys Compd., 2022, 921, 166094 CrossRef CAS.
- H. Song, C. Wang, Q. Han, X. Tang, W. Yan, Y. Chen, J. Jiang and T. Liu, Sens. Actuators, A, 2018, 271, 278–282 CrossRef CAS.
- Y. Li, J. Yang, M. Wang, Y. Zhu, H. Zhu, D. Yan, C. Liu, C. Xu and Y. Liu, J. Lumin., 2022, 118935 CrossRef CAS.
- X. Wu, G. Chen, J. Shen, Z. Li, Y. Zhang and G. Han, Bioconjug. Chem., 2015, 26, 166–175 CrossRef CAS PubMed.
- M. V. DaCosta, S. Doughan, Y. Han and U. J. Krull, Anal. Chim. Acta, 2014, 832, 1–33 CrossRef CAS PubMed.
- Q. Cheng, J. Sui and W. Cai, Nanoscale, 2012, 4, 779–784 RSC.
- S. Sinha, M. K. Mahata and K. Kumar, New J. Chem., 2019, 43, 5960–5971 RSC.
- K. Du, X. Xu, S. Yao, P. Lei, L. Dong, M. Zhang, J. Feng and H. Zhang, CrystEngComm, 2018, 20, 1945–1953 RSC.
- G. Chen, H. Qiu, P. N. Prasad and X. Chen, Chem. Rev., 2014, 114, 5161–5214 CrossRef CAS PubMed.
- V. Tamilmani, A. Kumari, V. K. Rai, B. Unni Nair and K. J. Sreeram, J. Phys. Chem. C, 2017, 121, 4505–4516 CrossRef CAS.
- F. Zhang, G. Li, W. Zhang and Y. L. Yan, Inorg. Chem., 2015, 54, 7325–7334 CrossRef CAS PubMed.
- M. Michalska, J. B. Jasiński, J. Pavlovsky, P. Żurek-Siworska, A. Sikora, P. Gołębiewski, A. Szysiak, V. Matejka and J. Seidlerova, J. Lumin., 2021, 233, 117934 CrossRef CAS.
- W. Yin, L. Zhou, Z. Gu, G. Tian, S. Jin, L. Yan, X. Liu, G. Xing, W. Ren, F. Liu, Z. Pan and Y. Zhao, J. Mater. Chem., 2012, 22, 6974 RSC.
- B. Shao, Q. Zhao, N. Guo, Y. Jia, W. Lv, M. Jiao, W. Lü and H. You, CrystEngComm, 2014, 16, 152–158 RSC.
- Y. Oka, T. Yao and N. Yamamoto, J. Solid State Chem., 2000, 152, 486–491 CrossRef CAS.
- C.-J. Jia, L.-D. Sun, L.-P. You, X.-C. Jiang, F. Luo, Y.-C. Pang and C.-H. Yan, J. Phys. Chem. B, 2005, 109, 3284–3290 CrossRef CAS PubMed.
- M. M. Upadhyay and K. Kumar, J. Rare Earths, 2022 DOI:10.1016/j.jre.2022.07.005.
- S. K. Gupta, M. Abdou, J. P. Zuniga, P. S. Ghosh and Y. Mao, J. Lumin., 2020, 224, 117312 CrossRef CAS.
- P. Tadge, I. R. Martín, S. B. Rai, S. Sapra, T. M. Chen, V. Lavín, R. S. Yadav and S. Ray, J. Lumin., 2022, 252, 119261 CrossRef CAS.
- M. I. Sarkar, N. K. Mishra and K. Kumar, Methods Appl. Fluoresc., 2023, 11, 014002 CrossRef PubMed.
- N. Kumar Mishra, M. M. Upadhyay, S. Kumar and K. Kumar, Spectrochim. Acta, Part A, 2022, 282, 121664 CrossRef CAS PubMed.
- Y. Zhuang, D. Wang and Z. Yang, Opt. Mater., 2022, 126, 112167 CrossRef CAS.
- D. Li, Y. Wang, X. Zhang, K. Yang, L. Liu and Y. Song, Opt. Commun., 2012, 285, 1925–1928 CrossRef CAS.
- X. Tu, J. Xu, M. Li, T. Xie, R. Lei, H. Wang and S. Xu, Mater. Res. Bull., 2019, 112, 77–83 CrossRef CAS.
- H. Zhou, N. An, K. Zhu, J. Qiu, L. Yue, L.-G. Wang and L. Ye, J. Lumin., 2021, 229, 117656 CrossRef CAS.
- W. Ge, M. Xu, J. Shi, J. Zhu and Y. Li, Chem. Eng. J., 2020, 391, 123546 CrossRef CAS.
- H. Lv, P. Du, W. Li and L. Luo, ACS Sustainable Chem. Eng., 2022, 10, 2450–2460 CrossRef CAS.
- K. Shwetabh, M. M. Upadhyay and K. Kumar, RSC Adv., 2023, 13, 9377–9386 RSC.
- J. H. Oh, B. K. Moon, B. C. Choi, J. H. Jeong, J. H. Kim and H. S. Lee, Solid State Sci., 2015, 42, 1–5 CrossRef CAS.
- I. Gupta, D. Singh, S. Singh, P. Kumar, S. Bhagwan and V. Kumar, Chem. Phys. Lett., 2023, 814, 140350 CrossRef CAS.
- E. Rai, R. S. Yadav, D. Kumar, A. K. Singh, V. J. Fulari and S. B. Rai, J. Lumin., 2022, 241, 118519 CrossRef CAS.
- D. J. Jovanović, T. V. Gavrilović, S. D. Dolić, M. Marinović-Cincović, K. Smits and M. D. Dramićanin, Opt. Mater., 2018, 82, 1–6 CrossRef.
- R. S. Yadav, S. J. Dhoble and S. B. Rai, Sens. Actuators, B, 2018, 273, 1425–1434 CrossRef CAS.
- A. Dwivedi, K. Mishra and S. B. Rai, J. Phys. D. Appl. Phys., 2015, 48, 435103 CrossRef.
- S. Sinha, M. K. Mahata, H. C. Swart, A. Kumar and K. Kumar, New J. Chem., 2017, 41, 5362–5372 RSC.
- L. Sun, X. Zhao, Y. Li, P. Li, H. Sun, X. Cheng and W. Fan, J. Appl. Phys., 2010, 108, 093519 CrossRef.
- L. Yang, L. Li, M. Zhao and G. Li, Phys. Chem. Chem. Phys., 2012, 14, 9956 RSC.
- X. Tu, J. Xu, M. Li, T. Xie, R. Lei, H. Wang and S. Xu, Mater. Res. Bull., 2019, 112, 77–83 CrossRef CAS.
- G. Chen, R. Lei, H. Wang, F. Huang, S. Zhao and S. Xu, Opt. Mater., 2018, 77, 233–239 CrossRef CAS.
- D. Chen, S. Liu, Z. Wan and Y. Chen, J. Alloys Compd., 2016, 672, 380–385 CrossRef CAS.
- W. Gao, W. Ge, J. Shi, X. Chen and Y. Li, J. Solid State Chem., 2021, 297, 122063 CrossRef CAS.
- M. Vega, I. R. Martin, E. Cortés-Adasme and J. Llanos, J. Lumin., 2022, 244, 118687 CrossRef CAS.
- T. Wang, Y. Li, T. Liu, Y. Peng, Z. Yin, Z. Yang, J. Qiu and Z. Song, J. Lumin., 2020, 221, 117034 CrossRef CAS.
- Z. Sun, G. Liu, Z. Fu, X. Zhang, Z. Wu and Y. Wei, Curr. Appl. Phys., 2017, 17, 255–261 CrossRef.
- A. K. Soni, R. Dey and V. K. Rai, RSC Adv., 2015, 5, 34999–35009 RSC.
- R. S. Yadav, S. J. Dhoble and S. B. Rai, Sens. Actuators, B, 2018, 273, 1425–1434 CrossRef CAS.
|
| This journal is © The Royal Society of Chemistry 2023 |
Click here to see how this site uses Cookies. View our privacy policy here. 
 Open Access Article
 This Open Access Article is licensed under a Creative Commons Attribution-Non Commercial 3.0 Unported Licence
 *
*