
 Open Access Article
 This Open Access Article is licensed under a Creative Commons Attribution-Non Commercial 3.0 Unported Licence
Enabling fast ionic transport in CeO2–La1−2xBaxBixFeO3 nanocomposite electrolyte for low temperature solid oxide fuel cell application†
Nusrat Shaheen ab,
Zheng Chen*ab,
Muneerah Alomarc,
Tao Suab,
Yumei Nongab,
Nada Althubaitic,
Muhammad Yousafd,
Yuzheng Lue and
Qiang Liu*e
ab,
Zheng Chen*ab,
Muneerah Alomarc,
Tao Suab,
Yumei Nongab,
Nada Althubaitic,
Muhammad Yousafd,
Yuzheng Lue and
Qiang Liu*e
aSchool of Civil Engineering and Architecture, State Key Laboratory of Featured Metal Materials and Life-cycle Safety for Composite Structures, Guangxi University, Nanning 530004, PR China. E-mail: chenzheng@gxu.edu.cn
bKey Laboratory of Disaster Prevention and Structural Safety of China Ministry of Education, School of Civil Engineering and Architecture, Guangxi University, Nanning 530004, China
cDepartment of Physics, College of Sciences, Princess Nourah bint Abdulrahman University, P. O. Box 84428, Riyadh 11671, Saudi Arabia
dEnergy Storage Joint Research Center, School of Energy and Environment, Southeast University, No. 2 Si Pai Lou, Nanjing 210096, China
eCollege of Electronic and Engineering, Nanjing Xiaozhuang University, Nanjing 211171, China. E-mail: qiangliu@njxzu.edu.cn
First published on 10th July 2023
Abstract
Recent studies indicate that electrolyte ionic conductivity plays a pivotal role in reducing the operating temperature of solid oxide fuel cells (SOFCs). In this regard, nanocomposite electrolytes have drawn significant attention owing to their enhanced ionic conductivity and fast ionic transport. In this study, we fabricated CeO2–La1−2xBaxBixFeO3 nanocomposites and tested them as a high-performance electrolyte for low-temperature solid oxide fuel cells (LT-SOFCs). The prepared samples were characterized by their phase structure, surface, and interface property via transmission electron microscopy (TEM), scanning electron microscopy (SEM), and X-ray photoelectron spectroscopy (XPS), followed by being applied in SOFCs to examine their electrochemical performance. In the fuel cells, it was found that the optimal composition 90CeO2–10La1−2xBaxBixFeO3 electrolyte-based SOFC delivered a peak power density of 834 mW cm−2 along with an open circuit voltage (OCV) of 1.04 V at 550 °C. A comparative study revealed that the nanocomposite electrolyte exhibited a total conductivity of 0.11 S cm−1 at 550 °C. Moreover, the rectification curve manifested the formation of the Schottky junction, suppressing the electronic conduction. This study conclusively shows that the addition of La1−2xBaxBixFeO3 (LBBF) into ceria electrolyte is a viable approach for constructing high-performance electrolytes for LT-SOFCs.
1. Introduction
Solid oxide fuel cells (SOFCs) have attracted considerable attention owing to their exceptional properties, such as high energy conversion efficiency, low emissions, and fuel flexibility. However, the high operating temperature required is a major obstacle to SOFC commercialization. It can cause degradation in materials, requires selected materials, and is responsible for unwanted chemical reactions at the electrode and electrolyte interfaces, subsequently affecting long-term device performance.1–4 An insufficient ionic conductivity in electrolytes will lead to a decline in performance when operating at low temperatures. To address this issue, it is crucial to use electrolytes that have high ionic conductivity and allow ions to move quickly at low operating temperatures.5–7 Along with high ionic conductivity, advanced techniques, such as preheating, thermal management strategies, and tailored cell designs, can play a crucial role in accelerating the start-up process of SOFCs. An electrolyte with ionic conductivity in the range of 0.1 S cm−1 is highly required to achieve high power output and stability at low operating temperatures.8 However, in the conventional YSZ electrolyte, when the operating temperature is reduced to 800 °C, the ionic conductivity significantly decreases, consequently restricting the SOFC's performance.9 Typically, YSZ exhibits sufficient oxygen ionic conductivity at ∼1000 °C, but such high operating temperatures have many adverse effects on material selection and cost production. Hence, it is imperative to explore novel electrolytes as a means to address these significant challenges.10 Various approaches and efforts have been reported for developing high-performance electrolytes at low temperatures,8,11,12 including reducing the electrolyte thickness by using advanced fabrication techniques, such as thin film13,14 and material structural and interface modification, to significantly improve the performance at reduced operating temperatures.15,16To overcome the key challenges, a series of electrolytes were developed based on perovskite and fluorite structures with high ionic conductivities below 800 °C. Yttria-stabilized zirconia (YSZ)/SrTiO3 (STO) heterostructures showed enhanced oxygen ion conductivity by about eight orders of magnitude with respect to that expected for YSZ and STO bulk values, whereby the heterostructure could exceptionally promote fast ion mobilities and enhanced ionic conductivity.17 In recent years, various semiconductors have been applied as electrolytes to construct advanced fuel cells, and these cells can efficiently work at operational temperatures below 600 °C.18–20 Kim et al. reported an increment in fuel cell performance of up to 4 orders of magnitude in YDC–YSZ nanocomposite at 350–450 °C,9 while Xiao et al. reported a value of 0.14 S cm−1 along with a peak power density of 892 mW cm−2 at 550 °C in a bulk-heterostructure nanocomposite electrolyte of Ce0.8Sm0.2O2−δ–SrTiO3.6 To further enhance the conductivity of CeO2, a co-doping approach was proposed by Herle et al.,21 whereby Sr-doped and Gd-doped CeO2 and Sr/Mg-doped lanthanum gallate (LSGM) exhibited high ionic conductivity. However, the mixed conductivity of doped CeO2 and material instability in LSGM impose limitations on both materials.22 B.-K. Park et al. reported a power density of 1.02 W cm−2 at 600 °C for the YSZ/GDC bilayer electrolyte by reducing the thickness of the electrolyte to 0.5 μm.23 The ionic conductors Gd0.1Ce0.9O1.95 (GDC) and Sm0.2Ce0.8O2−δ (SDC) are state-of-the-art electrolytes at intermediate temperature.24 However, when operated at low temperatures, both exhibit mixed ionic conduction in reducing condition because of Ce4+ reduction to Ce3+, which can hamper the cell performance and create a short-circuit due to electronic conduction.25 However, upon performing surface modification on doped ceria-based materials, they showed remarkably high ionic conductivities and enhanced fuel cell performances at low temperatures. SDC–BCY (BaCe0.8Y0.2O2) and SDC–LiZnO nanocomposites showed remarkably improved electrochemical performance compared to pure SDC.26,27 Fan et al. reported ionic conductivities > 0.1 S cm−1 for SDC–LixZnO at 300 °C.27
Recent research has shown that fuel cells using semiconductor–ionic conductor materials as electrolytes can perform well due to the enhancement of the ionic conductivity. Furthermore, multiple intriguing approaches have been reported based on heterojunctions, Schottky junction, and energy band engineering in semiconductor–ionic-based electrolytes, whereby the electrolyte can deliver significantly high ionic conductivity and stability.10,28–31 A breakthrough work by Shriram's group reported that perovskite nickelate could be used as electrolyte, and it delivered a peak power density (Pmax) of 225 mW cm−2 and an OCV of 1.03 V at 550 °C, where the nickelate could eliminate electronic conduction via Mott transition.32 Bin et al. reported a peak power density of 1000 mW cm−2 at 550 °C in La0.6Sr0.4Co0.2Fe0.8O3−δ (LSCF) and Sm–Ca co-doped ceria (SCDC).7 Chen et al. achieved the least ASRo of 0.16 Ω cm2 and high ionic conductivities of 0.11–0.26 S cm−1 at 400–500 °C along with a peak power density of 643 mW cm−2 in the BaCo0.4Fe0.4Zr0.1Y0.1O3−δ–ZnO heterostructure.33 By introducing a layered structure, Akbar et al. reported a peak power density of 1006 mW cm−2 at 550 °C.34 Non-doped ceria exhibited remarkably improved electrochemical performance compared to doped ceria. Wang et al. reported that CeO2 exhibited a high ionic conductivity of 0.1 S cm−1 at 550 °C.35 In another work, Xing et al. also showed a higher ionic conductivity of 0.16 S cm−1 at 520 °C in non-doped CeO2.36 The remarkable enhancement of the electrochemical performance of non-doped ceria at low operating temperatures suggests this is a very interesting and facile way to construct smart electrolyte materials.37
La1−2xBaxBixFeO3 (LBBF) is a mixed ionic and electronic conductor. By leveraging its ionic conductivity and electrocatalytic function, a new nanocomposite electrolyte (LBBF–CeO2) was designed for LT-SOFCs. The addition of LBBF into CeO2 maintained its excellent electrocatalytic properties to extend the cathodic ORR kinetics. The LBFF–CeO2 also produced plenty of interface areas between LBBF and CeO2, which could provide ionic transport pathways. Additionally, LBBF ion conduction at the interface significantly functions in hybrid proton and oxygen ion conduction too. As an electron insulator, ceria can block a portion of the electron transport through the membrane combined with Schottky junction formation, further avoiding the short-circuiting problem.
Taking into account the advantages mentioned above, we introduce a potential cathode material La1−2xBaxBixFeO3 (LBBF), into CeO2 and investigated its electrochemical performances at low operating temperatures. The mixed ionic/electronic conductivity of LBBF could not only improves the total conductivity but also enhance the fast ion mobility in the electrolyte as well. The prepared nanocomposite material was characterized in terms of its crystalline structure for phase analyses along with micro and surface structure analysis for assessing the surface and interface properties. The constructed electrolyte was applied in SOFCs for electrochemical and electrocatalytic analysis in H2/air conditions. It was found that the 90CeO2–10LBBF electrolyte exhibited a high power density at 450–550 °C. Additionally, we investigated the suppression of the electronic conduction from LBBF by constructing a Schottky junction in 90CeO2–10LBBF in a reducing atmosphere.
2. Experimental section
2.1 Material synthesis
La1−2xBaxBixFeO3 with (x = 0.1) was prepared using the sol–gel method. Stoichiometric amounts of La(NO3)3 (Sigma-Aldrich, 99.9%), Ba(NO3)2 (Sigma-Aldrich, 99.9%), Bi(NO3)3 (Sigma-Aldrich, 99.9%), and Fe(NO3)3 (Sigma-Aldrich, 99.9%) were dissolved in 300 mL of deionized water for 30 min. Once the nitrates were completely dissolved, citric acid was added to the solution as a chelating agent. The solution was stirred at 80 °C until it formed a gel. During this process, ammonia was also added to control the pH and to maintain it at pH 8. In the next step after the formation of the gel, the precursor was dried at 150 °C for 24 h, followed by calcination at 900 °C for 5 h.CeO2 was prepared using the co-precipitation method, whereby Ce(NO3)2·6H2O was dissolved in deionized water. The precipitation agent Na2CO3 (Sigma 99.9%) was added in a 1![[thin space (1/6-em)]](https://www.rsc.org/images/entities/char_2009.gif) :1 ratio to CeO2 (Aladdin 99.9%). After dissolving Ce(NO3)2·6H2O and Na2CO3 in deionized water, the precipitating agent solution of Na2CO3 was poured into the Ce(NO3)2·6H2O solution, and the solution was continuously stirred for 4 h. The solution was then filtered. The precursor was dried at 150 °C for 20 h and calcined at 850 °C for 4 h. The resultant powder was then ground using an agate mortar to obtain fine CeO2 powder. In the third step, LBBF and CeO2 nanocomposites were mixed by a solid-state reaction method with different weight percentage (wt%) compositions of CeO2–LBBF (90CeO2,10LBBF, 80CeO2,20LBBF, and 70CeO2,30LBBF). Based on the fuel cell performance, it was found that 90CeO2,10LBBF was the optimal composition. Therefore, we performed the major characterizations on the high-performance optimal composition 90CeO2,10LBBF as well as pure CeO2 for comparison.
:1 ratio to CeO2 (Aladdin 99.9%). After dissolving Ce(NO3)2·6H2O and Na2CO3 in deionized water, the precipitating agent solution of Na2CO3 was poured into the Ce(NO3)2·6H2O solution, and the solution was continuously stirred for 4 h. The solution was then filtered. The precursor was dried at 150 °C for 20 h and calcined at 850 °C for 4 h. The resultant powder was then ground using an agate mortar to obtain fine CeO2 powder. In the third step, LBBF and CeO2 nanocomposites were mixed by a solid-state reaction method with different weight percentage (wt%) compositions of CeO2–LBBF (90CeO2,10LBBF, 80CeO2,20LBBF, and 70CeO2,30LBBF). Based on the fuel cell performance, it was found that 90CeO2,10LBBF was the optimal composition. Therefore, we performed the major characterizations on the high-performance optimal composition 90CeO2,10LBBF as well as pure CeO2 for comparison.
2.2. Fuel cell fabrication
SOFCs based on CeO2–LBBF electrolytes with different weight ratios were fabricated using the dry pressing method. A symmetrical electrode Ni0.8Co0.15Al0.05LiO2−δ (NCAL) coated on Ni foam was used as a symmetrical electrode. Owing to the HOR and ORR catalytic functionality, NCAL is considered a potential triple charge conductor electrode in semiconductor-based LT-SOFCs.11,38,39 A slurry of NCAL was formed by mixing the NCAL powder with terpineol. The resulting slurry was then pasted onto Ni foam and dried in the oven at 150 °C for 25 min to form Ni-NCAL. Using the symmetrical Ni-NCAL electrode and CeO2–LBBF electrolyte with different weight percentage compositions (90:10, 80:20: and 70:30), the fuel cell devices were pressed with a pressure of 250 MPa for 2 min. The obtained pellet configured as Ni-NCAL/CeO2–LBBF/NCAL-Ni had a 13 mm diameter with an active area of 0.64 cm−2.
2.3. Characterization of the materials and the electrochemical measurements
Phase analysis of the prepared powders was conducted using X-ray diffraction (XRD, Germany, Bruker) with a Cu Kα (λ = 1.54060 Å) source over the 2θ range of 10–80° with a current of 40 mA and voltage of 40 kV. Transmission electron microscopy (TEM) analysis was performed using an FEI Titan Themis 200 field emission microscope embedded with an energy-dispersive X-ray spectrometry unit (EDS, Bruker Super-X). The morphology of CeO2–LBBF was analyzed using scanning electron microscopy (SEM). X-Ray photoelectron spectroscopy (XPS, Escalab 250 Xi, Thermo Fisher Scientific, UK) was employed to investigate the surface properties of the nanocomposite electrolyte. To measure the direct current (DC) conductivity of the prepared materials in a hydrogen atmosphere, a Keithley 2400 digital multimeter was utilized. The I–V (current–voltage) and I–P (current–power) performances were tested using an IT8511 system (Electrical Co., Ltd., China). These measurements were performed at different temperatures under H2 and air conditions. In the experiments, H2 was used as the fuel, while air served as the oxidant. The flow rate of the H2 and air was fixed at 110–130 mL min−1 during the I–V/I–P and EIS analysis. Electrochemical impedance spectroscopy was conducted using a Gamry Reference 3000 system (Gamry Instruments, USA).3. Results and discussion
3.1 Crystalline structure and morphology
Fig. 1a shows the crystal structures of CeO2, LBBF, and CeO2–LBBF. The XRD patterns showed distinct diffraction peaks corresponding to CeO2 with a fluorite structure and LBBF with an orthorhombic structure. The diffraction peaks of CeO2 and LBBF could be well indexed to the JCPDS cards 00-034-0394 and 00-034-1493. The 90CeO2–10LBBF sample exhibited a composite structure consisting of both CeO2 and LBBF phases. No additional impurities were observed during the blending and sintering processes, as confirmed by XRD analysis. This indicates that the powder underwent significant chemical changes during the preparation. Inclusive surface morphology micrographs were obtained by SEM, and are shown in Fig. 1b–d, representing CeO2, LBBF, and 90CeO2–10LBBF. Fig. 1b shows pure micrograph images of CeO2, while Fig. 1c and d demonstrate LBBF and CeO2–LBBF. As can be seen from the SEM images, the particles were homogeneously distributed without any significant morphological changes except for a few agglomerations. Such a uniform distribution inferred no chemical reaction took place during the material synthesis. The composite 90CeO2–10LBBF showed an average particle size ranging from 20 to 50 nm, as determined by measurements made using ImageJ software. The average particle size of LBBF alone was measured to be between 30 and 60 nm. The non-uniform SEM shape observed in the samples with different particle sizes could be attributed to the variations in the material preparation processes, which might not have been strictly controlled.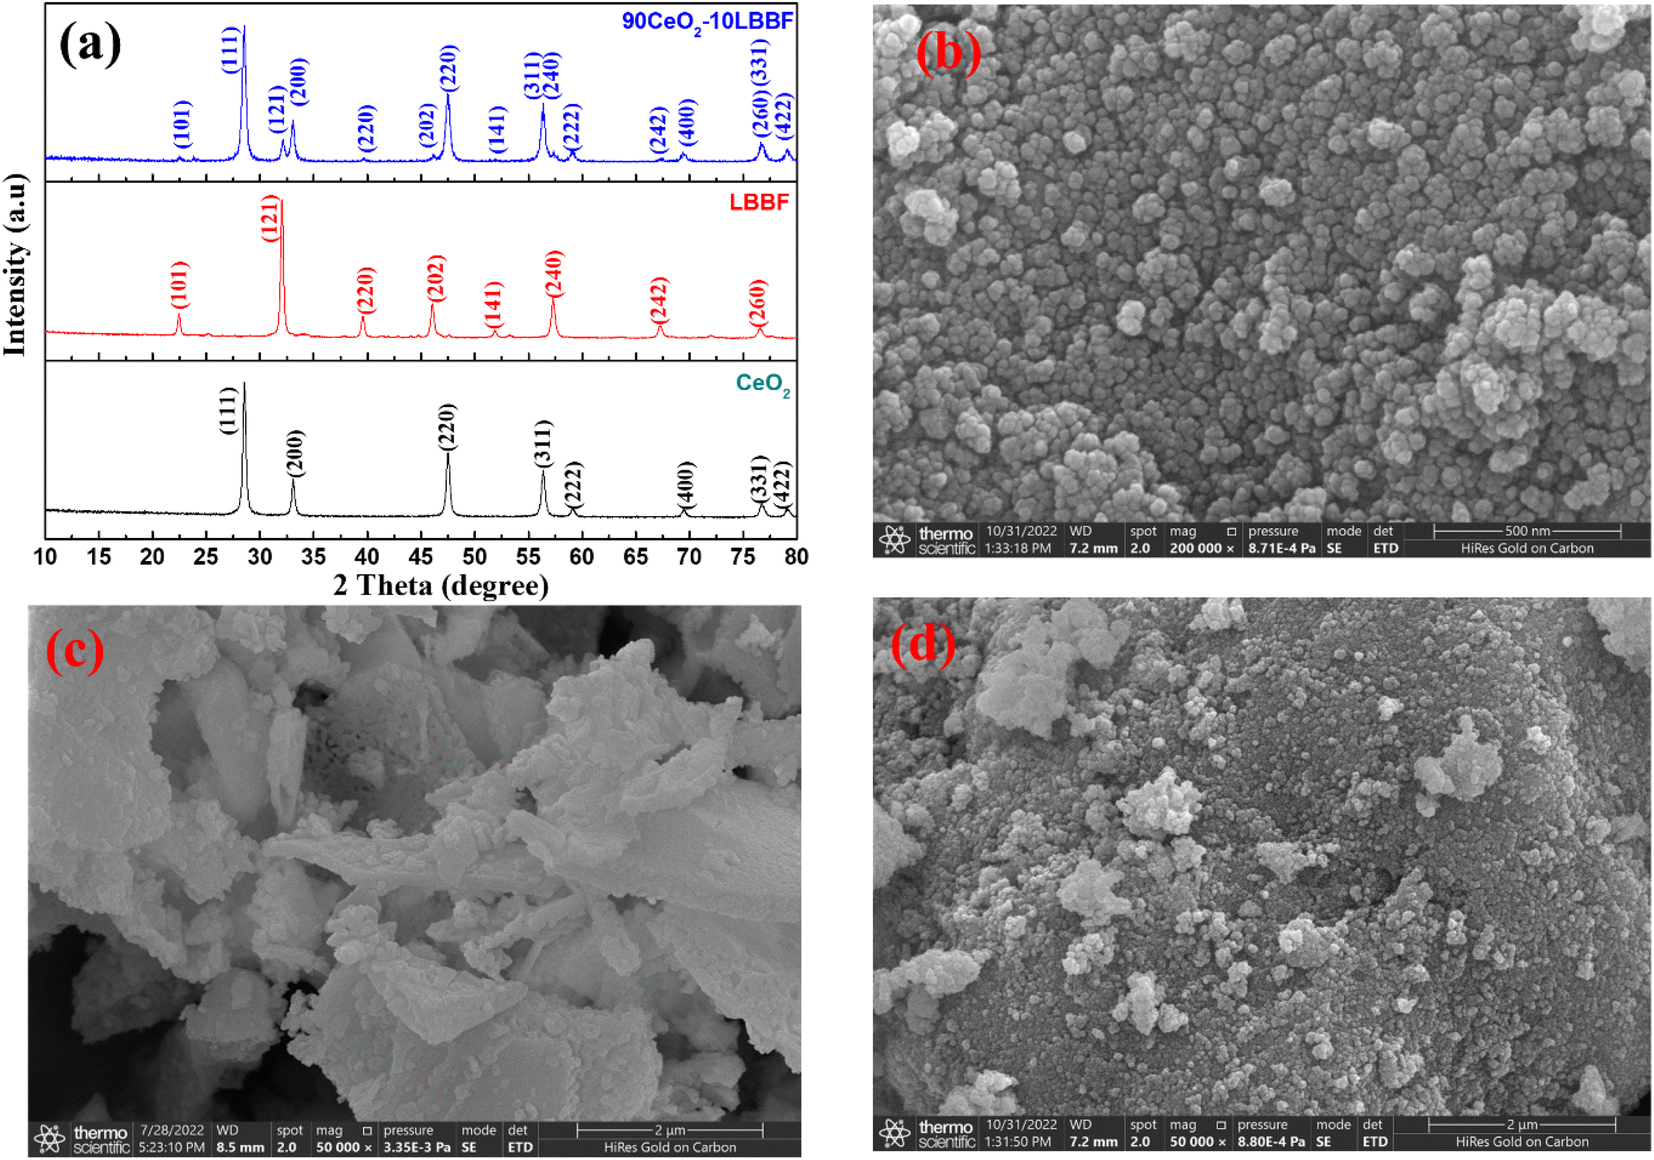 | ||
| Fig. 1 (a) XRD patterns of CeO2, LBBF, and 90CeO2–10LBBF. SEM images of (b) CeO2, (c) LBBF, and (d) CeO2–LBBF powder. | ||
The microstructure of 90CeO2–10LBBF inspected by HR-TEM is shown in Fig. 2. The grains presented well-defined crystalline lattice fringes with d-spacings of 0.19 and 0.31 nm, corresponding to the (202) planes of LBBF and (111) planes of CeO2. Fig. 2b, c and d, e portray the typical grains of LBBF and CeO2. The interlayered d-spacings for CeO2 and LBBF in the HR-TEM images were measured using Gatan Digital Micrograph software. The measured d-spacings of specified crystal planes assessed by the inverse fast Fourier-transform (IFFT) patterns, as shown in Fig. 2c (LBBF) and Fig. 2e (CeO2), well accorded with the XRD results. Details of the particle morphology and distribution investigated along with elemental mapping for 90CeO2–10LBBF measured by HR-TEM are shown in Fig. S1–S3.† The HR-TEM images shown in Fig. S2† show the even distribution of the elements. As the energy-dispersive spectrometry (EDS) results demonstrated, the elements (Ce, La, Ba, Bi, Fe, and O) were homogeneously distributed. The corresponding elemental mapping graph further verified the presence of the respective elements. The particle sizes of 90CeO2–10LBBF calculated from the HR-TEM image (Fig. S1†) showed the size was in the 20–50 nm range. The particle size variation was because the sample synthesis was not synthesized in a highly controlled and sophisticated environment. An equal distribution of elements can improve the performance and provide more available surface area for the reaction. This can improve the electrolyte's fast ionic mobilities, subsequently improving a device's power density.6,34
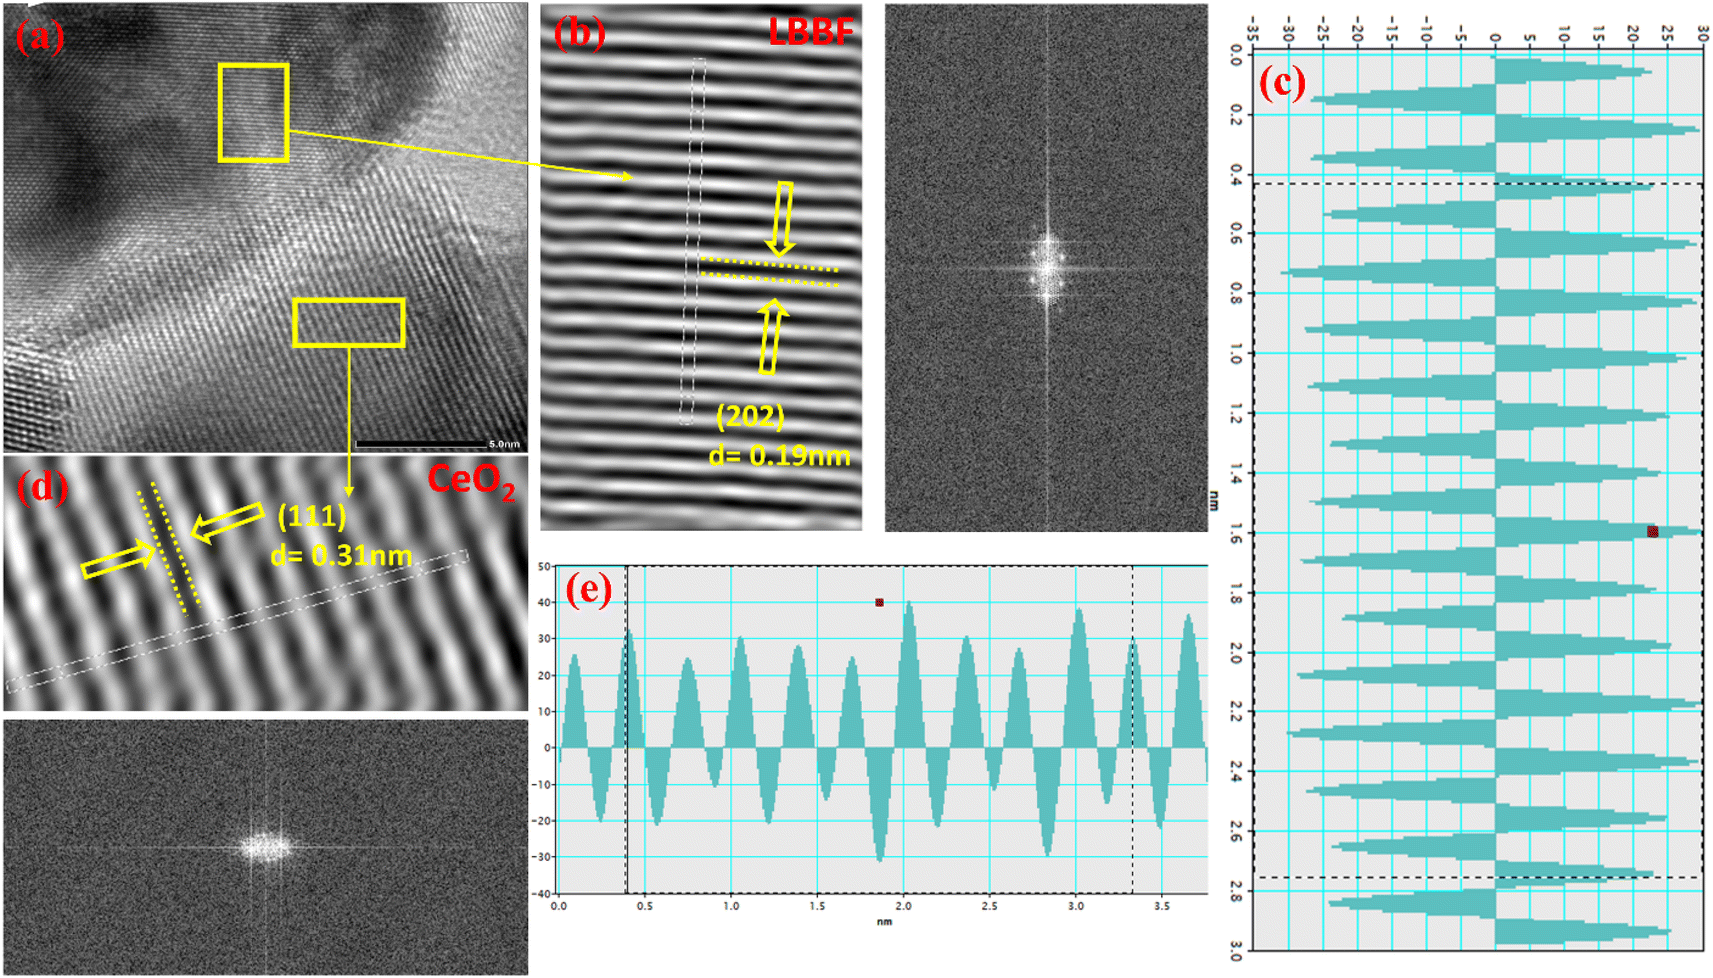 | ||
| Fig. 2 HR-TEM images of (a) 90CeO2–10LBBF grain, (b and c) LBBF, (d and e) CeO2, and the well-defined crystalline lattice along with the diffraction patterns of the crystal planes and profile of the inverse fast Fourier transform (IFFT) with the d-spacing distance. | ||
Furthermore, SEM analysis of the 90CeO2–10LBBF sample was conducted to investigate the distribution of particles within the nanocomposite. EDS is a powerful analytical technique used for chemical characterization and for investigating elemental distribution. The result is shown in Fig. 3. In the EDS analysis of the 90CeO2–10LBBF powder, it can be observed that the elemental Ce, La, Bi, Ba, Fe, and O were uniformly distributed. This suggests a uniform dispersion of LBBF and CeO2 elements in the composite electrolyte of 90CeO2–10LBBF, further verifying the even distribution of elements in the nanocomposite powder. Furthermore, no extra additional peaks in the mapping graph were observed, indicating the powder did not undergo a chemical reaction that created impurities in the sample. The even distribution observed in the elemental mapping graph is advantageous as it promotes the formation of numerous hetero-interfaces. This, in turn, contributes to the creation of disordered oxygen planes within the material, leading to improved ionic conductivity and enhanced cell performance.34,35
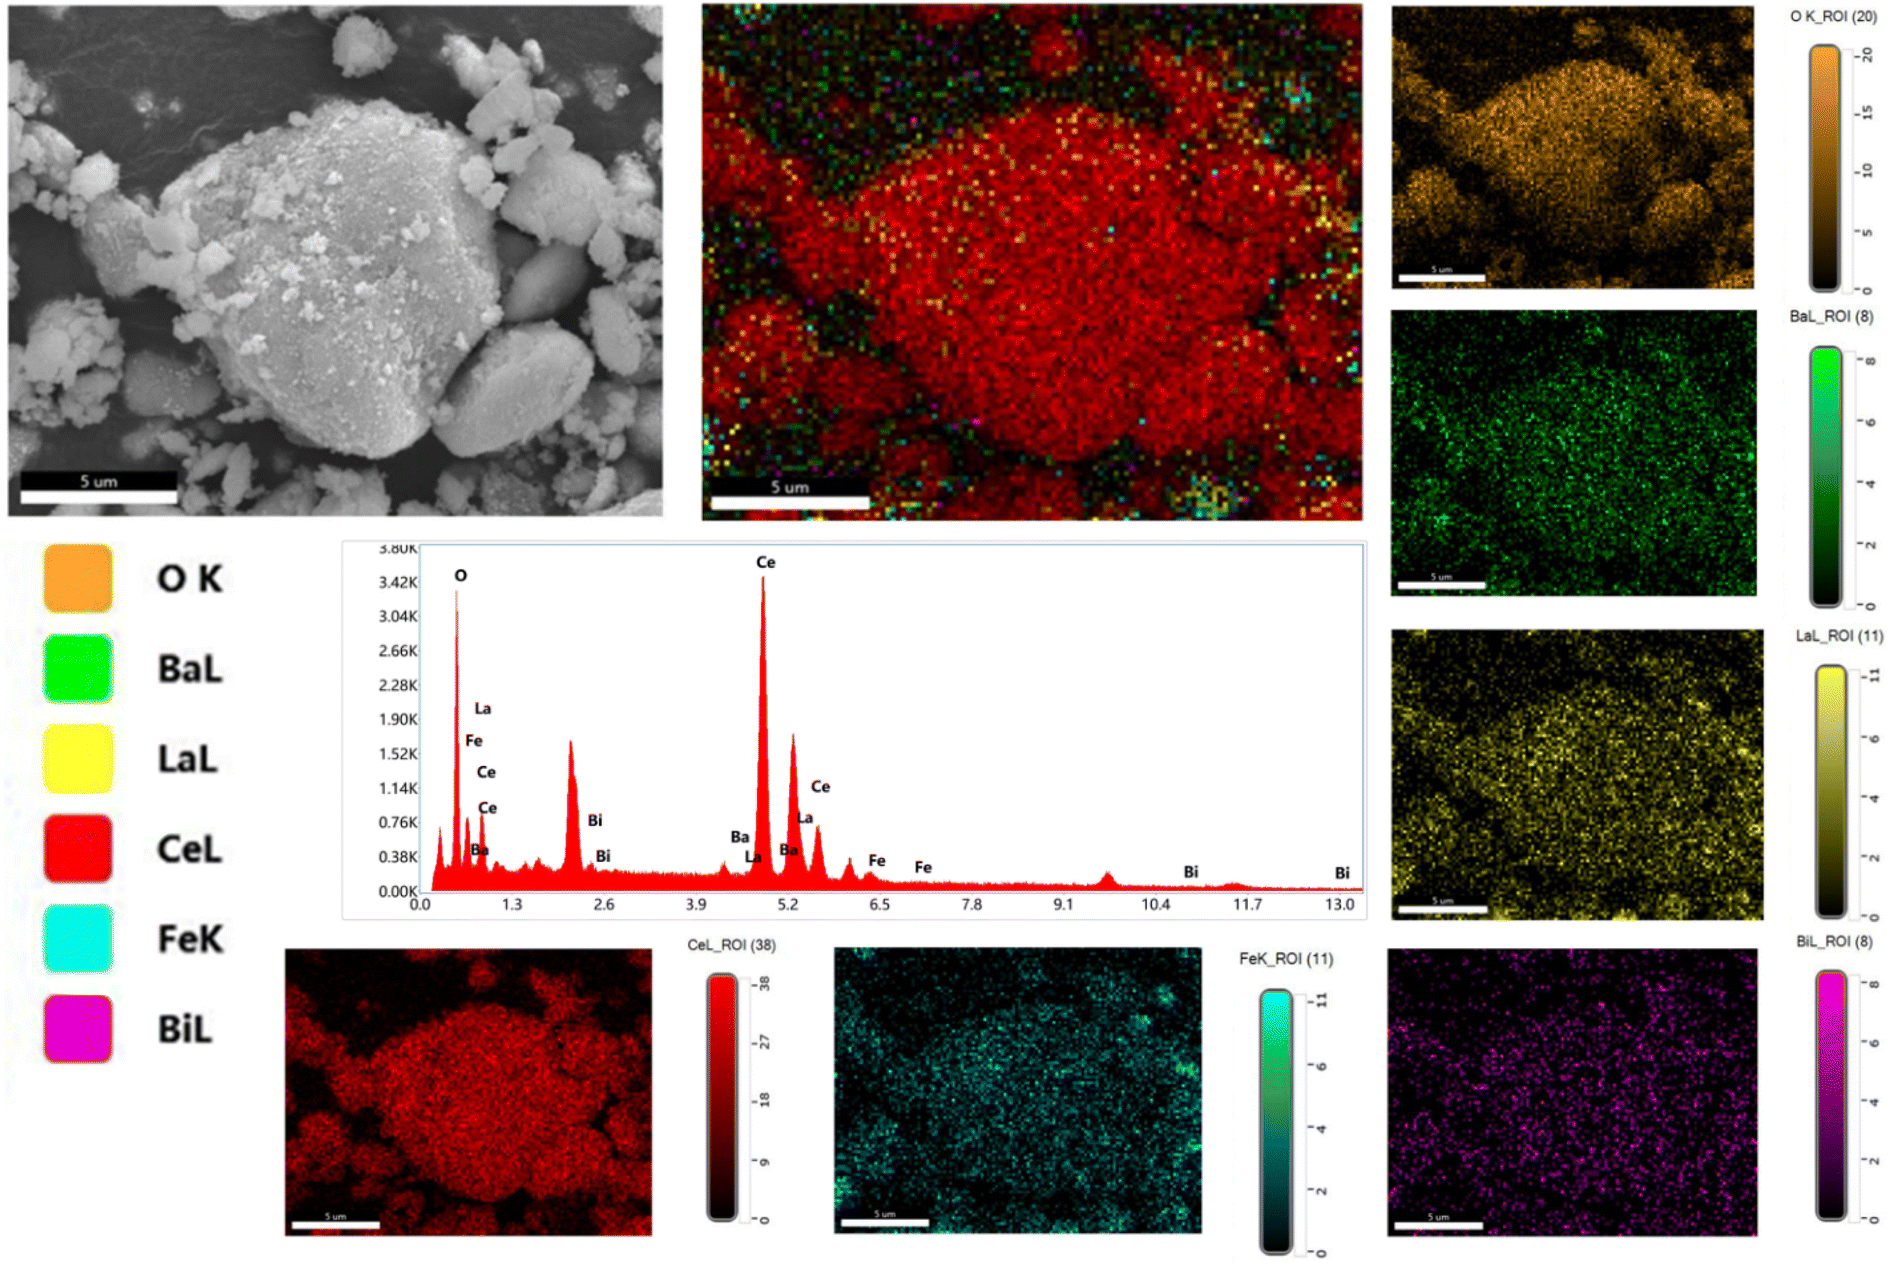 | ||
| Fig. 3 Elemental dispersive spectroscopy (EDS) results along with the EDS elemental mapping graph of 90CeO2–10LBBF electrolyte. | ||
3.2 XPS analysis
The XRD and HR-TEM characterizations conducted previously confirmed the presence of a pure crystal phase and provided insights into the surface morphology of the nanocomposite electrolyte. X-Ray photoelectron spectroscopy was next performed to investigate the surface properties of the material. XPS analysis plays a crucial role in the detailed examination of surface properties, including the formation of desirable oxygen vacancies. Fig. 4a–c show the XPS survey spectra of LBBF, CeO2, and 90CeO2–10LBBF, respectively. The XPS spectrum of CeO2 displayed characteristic peaks corresponding to Ce and O. Similarly, the XPS spectrum of LBBF exhibited characteristic peaks attributed to La, Bi, Ba, Fe, and O, confirming the presence of these elements in the material. In the case of the nanocomposite 90CeO2–10LBBF, characteristic peaks of Ce, La, Bi, Ba, Fe, and O were observed. Gaussian functions and Shirley background were employed to deconvolute the O 1s core level spectra of LBBF, CeO2, and 90CeO2–10LBBF. The O 1s peak was deconvoluted into lattice oxygen (Oα) and surface oxygen defects (Oδ).36,38,39 The peaks with binding energies of 528.5–529.5 eV and 530.5–531.5 eV could be allocated to the lattice oxygen (Oα) and surface oxide defects (Oδ), respectively.40 It was found that the nanocomposite 90CeO2–10LBBF had 8% higher surface oxygen defects than the pure CeO2. Increments in surface oxide defects (Oδ) is a sign of the enhanced oxygen vacancies in the 90CeO2–10LBBF electrolyte. Enhanced oxygen vacancies can improve the power output of SOFCs by enhancing the transport of oxygen ions, promoting the catalytic activity of the cell, which will significantly help improve the electrochemical performance.32,35,41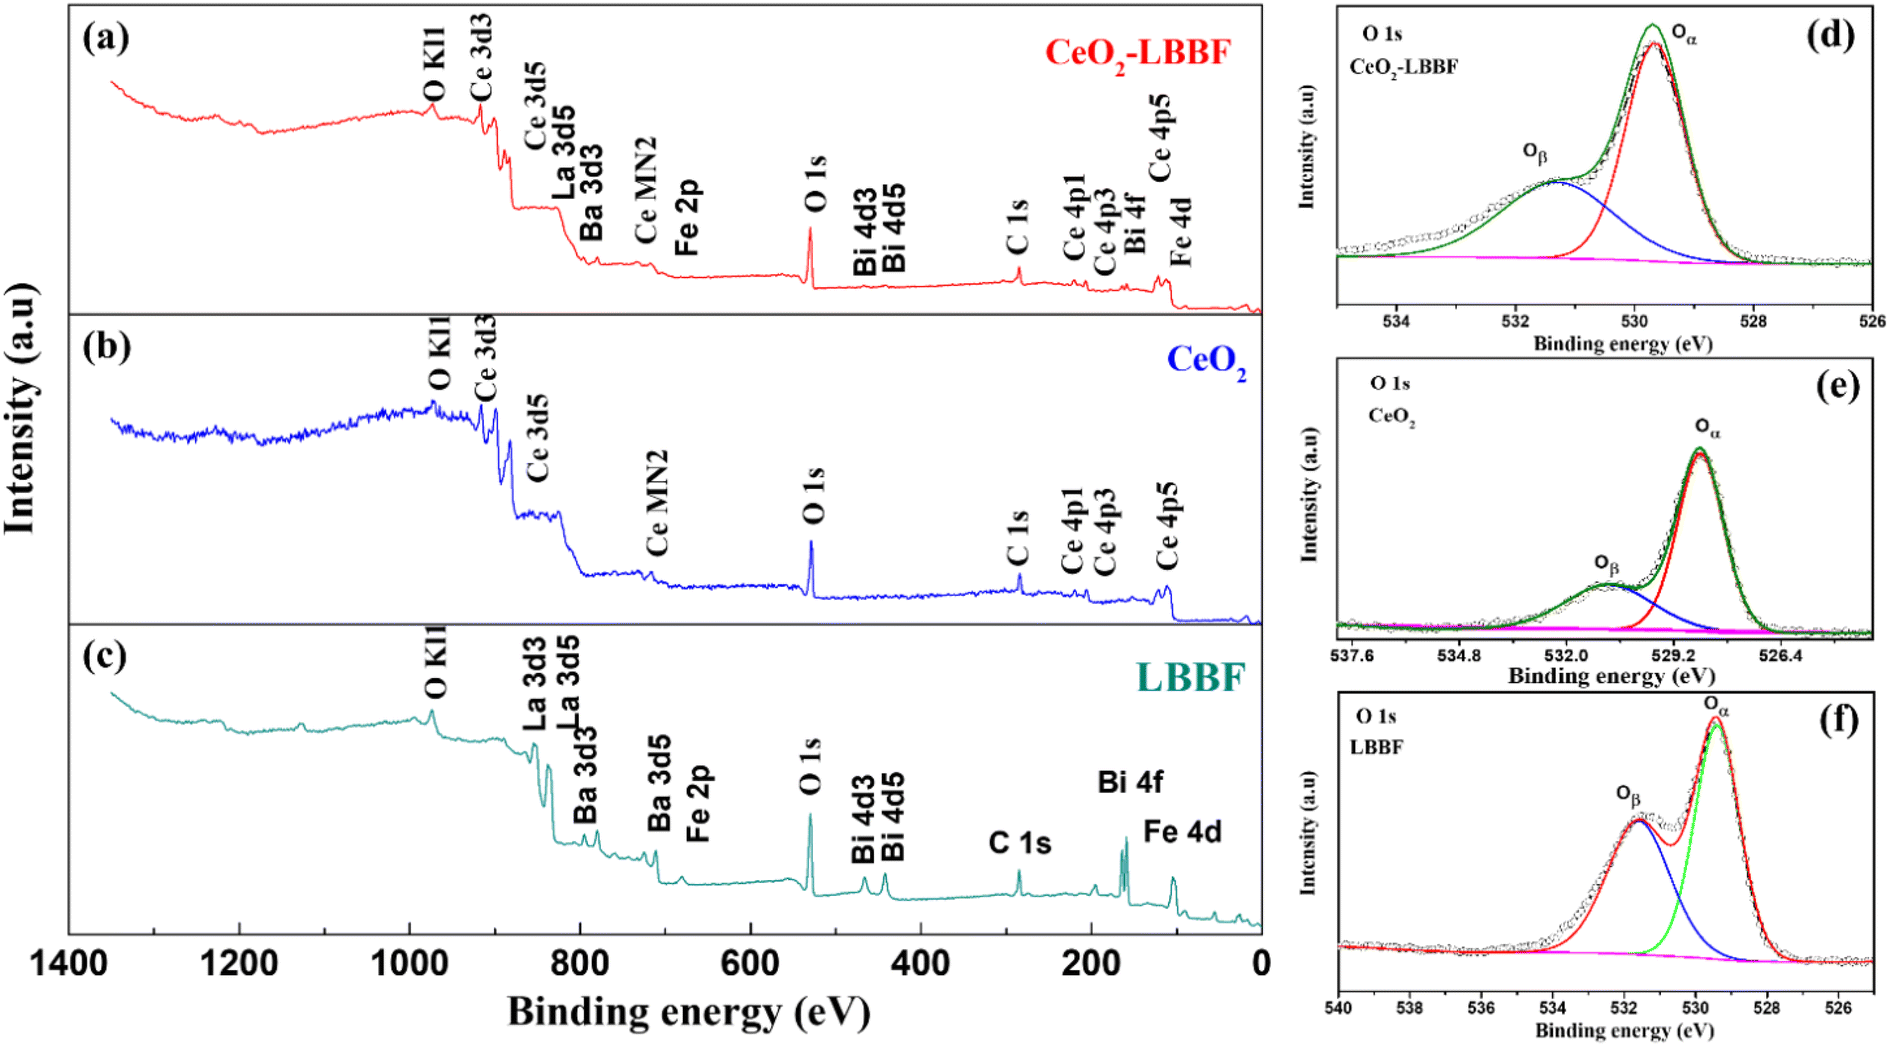 | ||
| Fig. 4 (a–c) XPS patterns of CeO2, LBBF, and 90CeO2–10LBBF. (d–f) O 1s spectra of CeO2, LBBF, and 90CeO2–10LBBF. | ||
CeO2 can undergo reduction from Ce4+ to Ce3+ in a reducing atmosphere. The reduction process creates a short-circuit in the sample, which can significantly affect the electrochemical performance of the material.42–44 To investigate the effect of LBBF in preventing the reduction of Ce4+ to Ce3+, XPS analysis of 90CeO2–10LBBF and CeO2 powder was performed before and after the fuel cell performance. The Ce 3d core level chemical spectra were deconvoluted using Gaussian multiple peaks fitting, as depicted in Fig. 5. The Ce 3d region peaks corresponded to the 3d5/2 and 3d3/2 spin-orbits. The four peaks U, Uo, V, and Vo could be assigned to Ce3+, while all the other peaks were attributed to tetravalent Ce4+.14,15,24 Upon calculating the relative ratio of Ce4+ to Ce3+ for both the powder before and after fuel cell performance, it was found that the ratio of Ce3+ remained the same in the powder. The calculated Ce3+ ratio before the fuel cell performance was 8.79%, while for 90CeO2–10LBBF powder after the fuel cell performance, the ratio was near 8.95%. The change was thus negligible, depicting that the presence of LBBF prevented the reduction of Ce4+ in a reducing environment. The ratio of Ce3+ in the pure CeO2 powder was 10.59%, and after the fuel cell performance, it increased to 12.81%. This observation indicated that pure ceria undergoes reduction to Ce3+ in a reducing atmosphere, leading to an increase in the concentration of Ce3+ species. The presence of Ce3+ can contribute to electronic conduction within the material, potentially impacting its overall electrochemical performance.
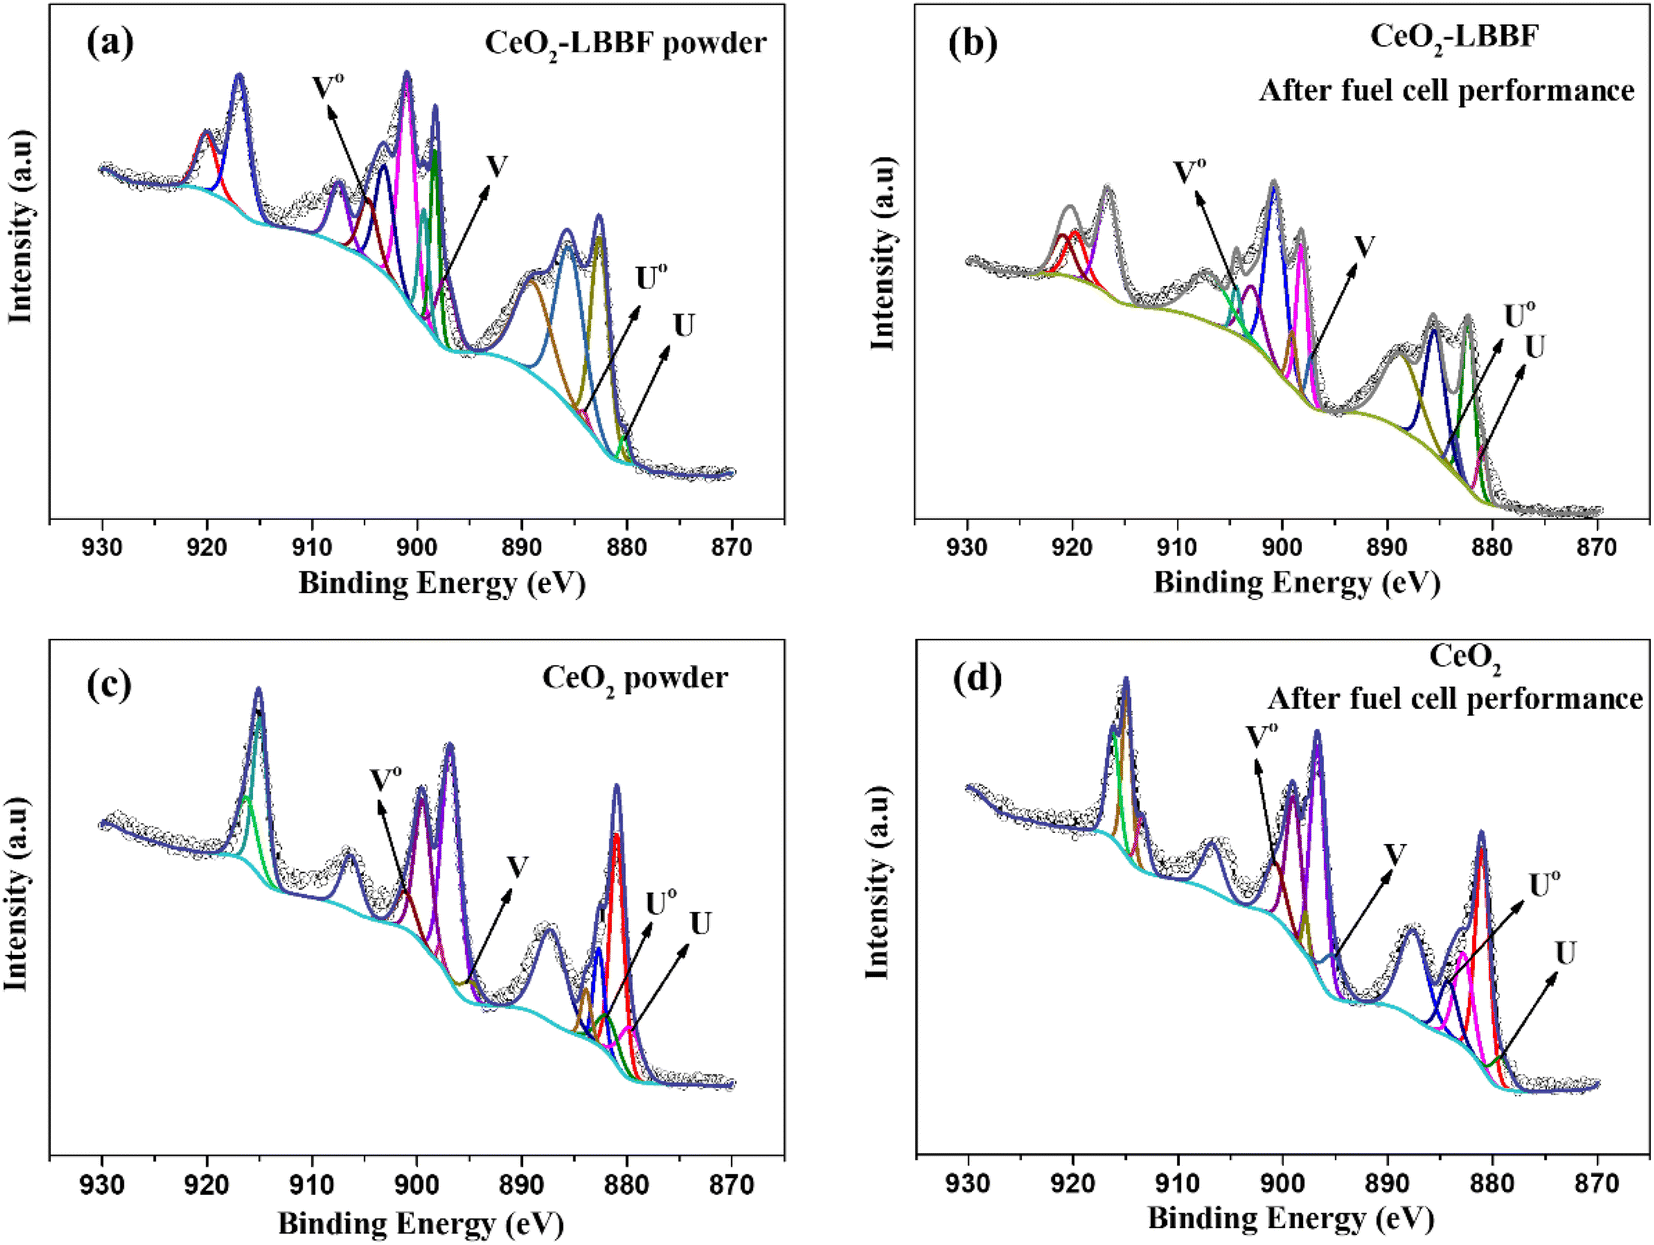 | ||
| Fig. 5 (a) Ce 3d core level chemical spectra of 90CeO2–10LBBF powder. (b) Ce 3d core level chemical spectra of 90CeO2–10LBBF powder after fuel cell performance. (c) Ce 3d core level chemical spectra of CeO2 powder. (d) Ce 3d core level chemical spectra of CeO2 powder after fuel cell performance. | ||
3.3 DC conductivity analysis of CeO2 and 90CeO2–10LBBF
A prerequisite for attaining improved performance at low operating temperatures is the presence of an electrolyte with an ionic conductivity near around 0.1 S cm−1. This threshold of conductivity is essential to facilitate the efficient and rapid transport of ions within the electrolyte matrix. By ensuring an elevated level of ionic conductivity, the electrochemical device can effectively operate and exhibit enhanced functionality even under lower temperature conditions. The augmented ion diffusion facilitated by higher ionic conductivity contributes to a superior overall performance and efficiency, particularly in the realm of solid oxide fuel cells and related applications.17,45,46 Different strategies can be applied to enhance the ionic conductivity by surface and structural modification.11,46 Among these strategies, the formation of heterostructures between a semiconductor and an oxide ionic conductor has been proven to be particularly effective for achieving high ionic conductivity at low operating temperatures.11 For DC conductivity, CeO2–LBBF powder was compressed uniaxially under a static pressure load of 250 MPa for 3 min to form a pellet. After that the pellet was sintered at 700 °C for 2 h and then both sides of the pellet were pasted with Pt as the current collector. The pellet was then fixed in a testing device and the DC conductivity was measured by connecting a Keithley 2400 digital multimeter to the testing device. The conductivity was measured in a hydrogen atmosphere. The thickness of the pellet was 1 mm with an active area of 0.64 cm2.Fig. 6 shows the total conductivity of 90CeO2–10LBBF and pure CeO2 measured in a H2 atmosphere as the sum of the high proton and electron conductivity. As can be seen, pure CeO2 delivered a conductivity of 0.052 S cm−1. In the H2 atmosphere, CeO2 was possibly reduced to induce electronic conduction while forming a CeO2−δ@CeO2 core–shell structure to introduce proton transport, as reported in previous studies.35,36 Upon introducing LBBF into CeO2, the conductivity increased to 0.11 S cm−1, showing the significant enhancement in the conductivity of 90CeO2–10LBBF. Such high conductivity improves the performance of the electrolyte in LT-SOFCs by facilitating the movement of charge carriers. The improved conductivity is supposed to result from the increased fast ion mobilities in 90CeO2–10LBBF electrolytes and the increased number of oxygen vacancies, as observed in the XPS O 1s spectra. The significant enhancement of conductivity in the nanocomposite electrolyte holds great promise for substantially improving the electrochemical performance of devices. By achieving higher conductivity, the nanocomposite electrolyte enables more efficient ion transport, facilitating faster reaction kinetics and reducing the ohmic losses within the system. This enhancement in conductivity can lead to an improved power output, enhanced overall efficiency, and enhanced stability of a device
 | ||
| Fig. 6 DC conductivities of CeO2 and 90CeO2–10LBBF samples. | ||
3.4 Electrochemical performances
Fuel cell measurements were performed to evaluate the electrochemical performance of the composite electrolyte. Triple charge conducting (H+/O2−/e−) Ni0.8Co0.15Al0.5LiOx (NCAL) was chosen as a symmetrical electrode owing to its fast catalytic hydrogen oxidation reaction (HOR) and oxygen reduction reaction (ORR).47–49 The Ni-NCAL/90CeO2–10LBBF/NCAL-Ni configuration was operated within a temperature range of 550–450 °C, and its performance was evaluated based on the open circuit voltages (OCVs) and maximum power densities (Pmax). The configured SOFC devices were preheated for 1 h at 550 °C before supplying the fuel and oxidant for mechanical stability. After that, hydrogen was fed on the anode as fuel, and oxygen was added on the cathode as the oxidant. The fuel cell performance was measured when the cell sustained a stable open circuit voltage (OCV). Upon performing the electrochemical performance tests, it was found that the optimal ratio 90CeO2–10LBBF was the best-performing sample among all the other ratios, and delivered a peak power density of 834–326 mW cm−2 at 550–450 °C, while pure CeO2 delivered 533 mW cm−2 at 550 °C; the composite cell thus delivered 301 mW cm−2 more power than pure CeO2. As shown in Fig. 7a, fuel cells with different weight ratios of CeO2 to LBBF, specifically 80CeO2–20LBBF and 70CeO2–30LBBF compositions, exhibited peak power densities of 642 and 443 mW cm−2, respectively, at an operating temperature of 550 °C. As observed in Fig. 7a, the fuel cell performance began to decline when the LBBF ratio was increased by 30%. This decrease in performance could be primarily attributed to the higher electronic conduction introduced by the increased LBBF content. The enhanced electronic conduction led to short-circuiting within the device, hindering the desired ionic transport and compromising the overall efficiency of the fuel cell. The performance of the cell in the nanocomposites 90CeO2–10LBBF electrolyte at 550 °C was much higher than for the previous pure or doped CeO2.50–55 This improvement was mainly due to the improved ionic conductivity and enhanced number of oxygen vacancies, which play key roles in improving the electrochemical performances of the electrolyte; as a result, fast ionic transport takes place. With such a promising power output, the configured SOFC also delivered a high OCV > 1 V at 450–550 °C, showing no risk of a short-circuit in the device. Furthermore, upon performing stability tests for CeO2 and 90CeO2–10LBBF, as shown in Fig. S4,† it was found that the 90CeO2–10LBBF electrolyte-based SOFC was persistently stable for 24 h at 550 °C under a stationary current density of 130 mA cm−2. The cell voltage could sustain a value of around 0.8 V for 24 h, which verified the stability of the electrolyte, while pure ceria's OCV decreased to 3 eV within 10 h. The cross-sectional SEM image of the best-performing SOFC device is presented in Fig. S5.† The electrolyte was well compacted with the electrode, portraying better mechanical strength. Such a compact contact of the electrode and electrolyte could not only improve the mechanical contact but also help in improving the device performance.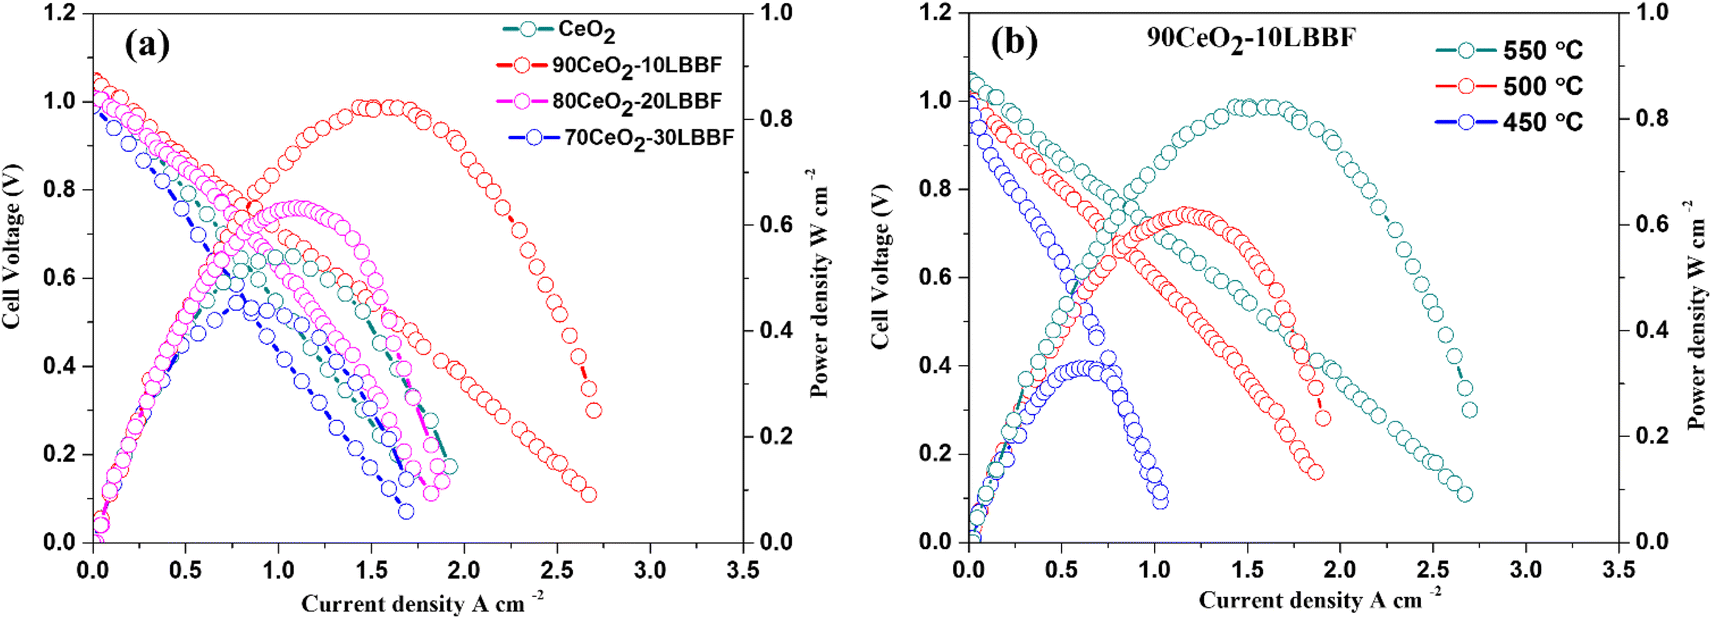 | ||
| Fig. 7 (a) Electrochemical performance of different 90CeO2–10LBBF, 80CeO2–20LBBF, 70CeO2–30LBBF, and pure CeO2 samples at 550 °C. (b) Electrochemical performances of 90CeO2–10LBBF at 550–450 °C. | ||
3.5 Electrochemical impedance spectra analysis
Electrochemical impedance spectroscopy (EIS) was conducted to examine the electrochemical properties of both CeO2 and 90CeO2–10LBBF-based SOFCs. The EIS spectra were measured under conditions similar to those of the fuel cell atmosphere. The EIS spectra were measured in the domain of 0.01 MHz to 1 MHz with an applied 10 mV AC signal. The equivalent circuit Ro R1 CPE1 R2 CPE2 was employed to obtain the Nyquist curves fitting, where Ro represents the ohmic resistance, referring to the electrolyte's ohmic resistance, while the sum of R1 and R2 represents the electrode polarization resistance.56 Upon performing EIS in fuel cell conditions, it was found that the best-performing cell with the wt% ratio of 90CeO2–10LBBF delivered the least ohmic and electrode polarization resistance among all the other compositions, as shown in Fig. 8a, whereby 90CeO2–10LBBF delivered an ohmic resistance of 0.13. Ω cm2 along with electrode polarization resistance of 0.42 Ω cm2 at 550 °C. The lower values of resistance observed in the EIS spectra further support the favorable electrochemical behavior and efficiency of the 90CeO2–10LBBF composite electrolyte in the fuel cell system. While pure CeO2, 80CeO2–20LBBF, and 70CeO2–30LBBF delivered ohmic resistances of 0.25, 0.21, and 0.27 Ω cm2 at 550 °C, respectively. The least ohmic resistance reflects the high ionic conductivity in the optimal composition, resulting in fast catalytic reactions. Along with the ohmic resistance, the electrode polarization resistance was also decreased in 90CeO2–10LBBF, depicting a better compatibility between the electrolyte and cathode, which can assist in enhancing fast ORR catalytic functionalities. Further, when decreasing the operating temperature to 450 °C, the ohmic resistance increased to 0.29 Ω cm2, and also, the device delivered the least electrode polarization resistance of 0.63 Ω cm2. The fast catalytic functionalities and the least ohmic resistance displayed by the EIS spectra further verified the improved electrocatalytic activity and efficient charge transfer kinetics at the electrode–electrolyte interface, contributing to an enhanced performance at lower temperatures.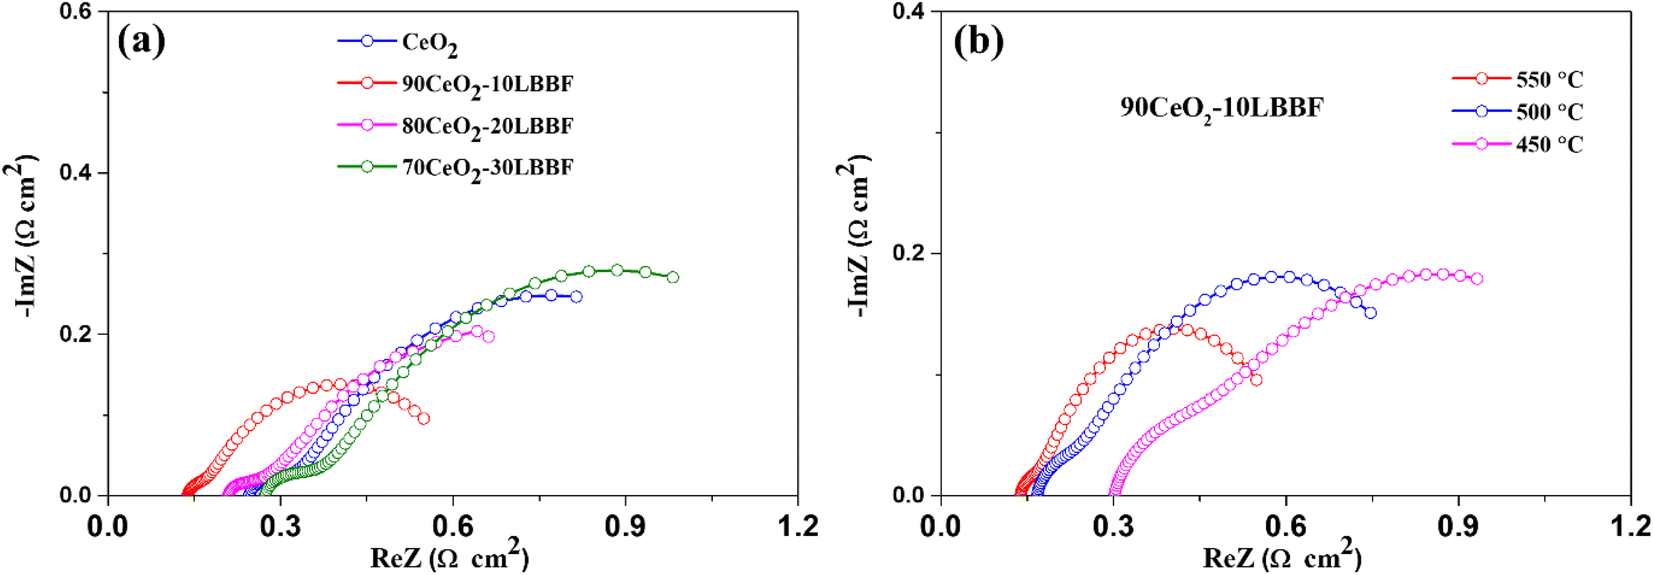 | ||
| Fig. 8 (a) EIS spectra of 90CeO2–10LBBF, 80CeO2–20LBBF, 70CeO2–30LBBF, and pure CeO2 at 550 °C. (b) EIS spectra of 90CeO2–10LBBF at 550–450 °C. | ||
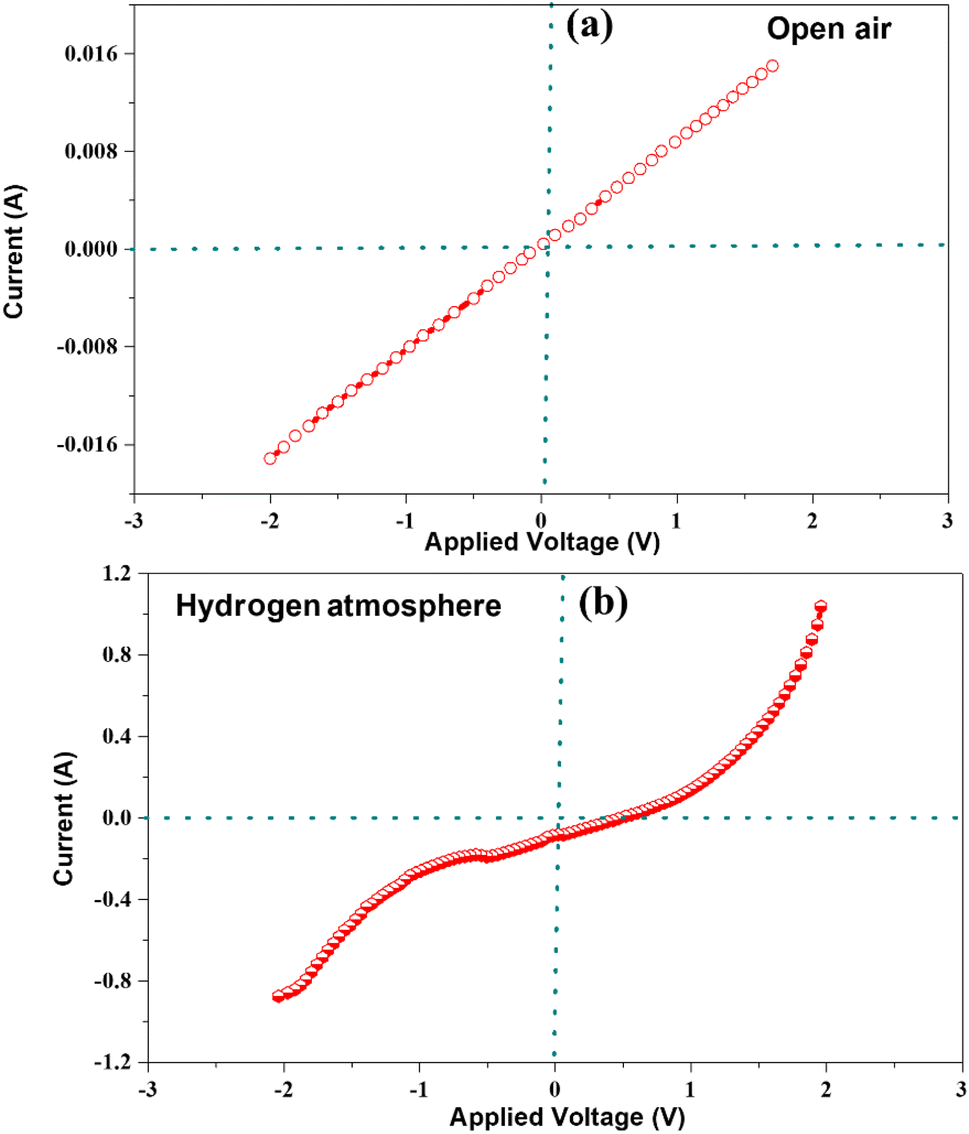
The comprehensive characterization and experimental results presented in this study provide strong evidence to support the significant enhancement in cell performance resulting from the incorporation of LBBF into CeO2. The improved performance could be attributed to the high ionic conductivity exhibited by the nanocomposite electrolyte. The suppression of electronic conduction in the nanocomposite 90CeO2–10LBBF electrolyte was further investigated by conducting Schottky junction tests, as depicted in Fig. 9. This test aims to examine the behavior of the junction formed between the electrolyte and the anode. Schottky junction experiments were performed for a half cell of Ni-NCAL/90CeO2–10LBBF, where Ni-NCAL reduces to Ni/Co metal when hydrogen is supplied on the anode. By applying swept voltage in the range of −2 to 2 V, the nature of the I–V curve was measured in the open air and H2 atmosphere. In open air, the I–V curve showed an ohmic behavior, as shown in Fig. 9a, while in the H2 environment, the I–V curve exhibited an apparent rectification behavior, conforming to the formation of the Schottky junction as shown in Fig. 9b, which suppresses electronic conduction. As a result, the cell did not undergo short-circuiting.11,31,39 These results further verified the reason for obtaining high OCVs while ensuring good fuel cell performance.
 | ||
| Fig. 9 Current response as a function of bias voltage for 90CeO2–10LBBF at 550 °C: (a) before and (b) after providing H2. | ||
4. Conclusions
In summary, this study focused on investigating the electrochemical performance of CeO2–LBBF electrolyte at low operating temperatures (ranging from 550 °C to 450 °C) through the incorporation of LBBF into the oxide ion conductor CeO2. Various characterization techniques, including XRD, HR-TEM, SEM, XPS, and EIS, were employed to analyze the crystal structure, surface morphology, elemental composition, and electrochemical properties of the nanocomposite electrolyte. XRD, HR-TEM, and SEM demonstrated that the CeO2–LBBF nanocomposite electrolyte exhibited a pure crystal phase with well-defined lattice fringes and a homogeneous distribution of Ce, La, Bi, Ba, Fe, and O elements. The obvious increment of surface oxygen vacancies in CeO2–LBBF electrolyte revealed enhanced oxygen vacancies, substantially improving fast ion transportation. Upon performing DC conductivity tests, it was found that the 90CeO2–10LBBF nanocomposite delivered a total conductivity of 0.11 S cm−1 compared to pure CeO2, which exhibited a value of 0.054 S cm−1. Upon employing the electrolyte in SOFCs, it delivered peak power densities of 834–326 mW cm−2 at 500–450 °C. High OCVs >1 V indicate that there was no short-circuit in the electrolyte. The lower ohmic and electrode polarization compared to the pure CeO2 and other compositions verified that 90CeO2–LBBF is a high-performing electrolyte. Furthermore, the rectification curve verified the formation of the Schottky junction, which subsequently could prevent electronic conduction in the reducing atmosphere. Based on the above results, it can be perceived that surface modification is an efficient strategy to develop high-performance electrolytes for LT-SOFCs and CeO2–LBBF that can be considered as efficient alternative electrolytes.Conflicts of interest
The authors declare that they have no known competing financial interests or personal relationships that could have appeared to influence the work reported in this paper.Acknowledgements
This study is financially supported by the National Natural Science Foundation of People's Republic of China (Grant No. U2006224) and Guangxi Natural Science Foundation, China (2022GXNSFFA035035). This work is funded by Princess Nourah bint Abdulrahman University Researchers Supporting Project number (PNURSP2023R398), Princess Nourah bint Abdulrahman University, Riyadh, Saudi Arabia.References
- L. Tan, X. Dong, C. Chen, Z. Gong and M. Wang, Energy Convers. Manage., 2021, 245, 114539 CrossRef
.
- D. Ding, M. Liu, Z. Liu, X. Li, K. Blinn, X. Zhu and M. Liu, Adv. Energy Mater., 2013, 3, 1149–1154 CrossRef CAS
- A. S. Deepi, S. Dharani Priya, A. Samson Nesaraj and A. I. Selvakumar, Int. J. Green Energy, 2022, 19, 1600–1612 CrossRef CAS
- J. Peng, J. Huang, X. Wu, Y. Xu, H. Chen and X. Li, J. Power Sources, 2021, 505, 230058 CrossRef CAS
- A. G. Jolley, R. Jayathilake and E. D. Wachsman, Ionics, 2019, 25, 3531–3536 CrossRef CAS
- Y. Cai, Y. Chen, M. Akbar, B. Jin, Z. Tu, N. Mushtaq, B. Wang, X. Qu, C. Xia and Y. Huang, Nano-Micro Lett., 2021, 13, 1–14 CrossRef CAS PubMed
- B. Zhu, B. Wang, Y. Wang, R. Raza, W. Tan, J.-S. Kim, P. A. Van Aken and P. Lund, Nano Energy, 2017, 37, 195–202 CrossRef CAS
- Z. Tu, Y. Tian, M. Liu, B. Jin, M. Akbar, N. Mushtaq, X. Wang, W. Dong, B. Wang and C. Xia, Nanomaterials, 2021, 11, 1–17 CrossRef
- Y. B. Kim, J. S. Park, T. M. Gür and F. B. Prinz, J. Power Sources, 2011, 196, 10550–10555 CrossRef CAS
- N. Mushtaq, Y. Lu, C. Xia, W. Dong, B. Wang, M. A. K. Y. Shah, S. Rauf, M. Akbar, E. Hu, R. Raza, M. I. Asghar, P. D. Lund and B. Zhu, Appl. Catal., B, 2021, 298, 120503 CrossRef CAS
- E. Hu, Z. Jiang, L. Fan, M. Singh, F. Wang, R. Raza, M. Sajid, J. Wang, J.-S. Kim and B. Zhu, iScience, 2021, 24, 102191 CrossRef CAS PubMed
- L. Agun, H. A. Rahman, S. Ahmad and A. Muchtar, Adv. Mater. Res., 2014, 893, 732–737 Search PubMed
- J. H. Park, S. M. Han, B.-K. Kim, J.-H. Lee, K. J. Yoon, H. Kim, H.-I. Ji and J.-W. Son, Electrochim. Acta, 2019, 296, 1055–1063 CrossRef CAS
- K. Bae, D. Y. Jang, H. J. Choi, D. Kim, J. Hong, B. K. Kim, J. H. Lee, J. W. Son and J. H. Shim, Nat. Commun., 2017, 8, 1–9 CrossRef CAS
- R. Raza, B. Zhu, A. Rafique, M. R. Naqvi and P. Lund, Mater. Today Energy, 2020, 15, 100373 CrossRef
- Z. Bi, Y. Dong, M. Cheng and B. Yi, J. Power Sources, 2006, 161, 34–39 CrossRef CAS
- A. Cavallaro, M. Burriel, J. Roqueta, A. Apostolidis, A. Bernardi, A. Tarancón, R. Srinivasan, S. N. Cook, H. L. Fraser and J. A. Kilner, Solid State Ionics, 2010, 181, 592–601 CrossRef CAS
- B. Wang, Y. Cai, C. Xia, J.-S. Kim, Y. Liu, W. Dong, H. Wang, M. Afzal, J. Li and R. Raza, Electrochim. Acta, 2017, 248, 496–504 CrossRef CAS
- W. Zhang, Y. Cai, B. Wang, C. Xia, W. Dong, J. Li and B. Zhu, Int. J. Hydrogen Energy, 2016, 41, 15346–15353 CrossRef CAS
- M. Yousaf, M. Akbar, M. A. K. Yousaf Shah, A. Noor, Y. Lu, M. Niaz Akhtar, N. Mushtaq, E. Hu, S Yan and B. Zhu, Ceram. Int., 2022, 48(19), 28142–28153 CrossRef CAS
- J. van Herle, D. Seneviratne and A. J. McEvoy, J. Eur. Ceram. Soc., 1999, 19, 837–841 CrossRef CAS
- J. B. Goodenough, Nature, 2000, 404, 821–823 CrossRef CAS PubMed
- B.-K. Park and S. A. Barnett, J. Mater. Chem. A, 2020, 8, 11626–11631 RSC
- S. Molin, M. Gazda and P. Jasinski, J. Rare Earths, 2009, 27, 655–660 CrossRef
- S. Shen, Y. Yang, L. Guo and H. Liu, J. Power Sources, 2014, 256, 43–51 CrossRef CAS
- J. Yu, N. Tian, Y. Deng, G. Li, L. Liu, L. Cheng, P. Gao, Q. Pan, Y. Wang and X. Chen, Sci. China: Chem., 2015, 58, 473–477 CrossRef CAS
- L. Fan, Y. Ma, X. Wang, M. Singh and B. Zhu, J. Mater. Chem. A, 2014, 2, 5399–5407 RSC
- M. A. K. Y. Shah, Y. Lu, N. Mushtaq, M. Yousaf, M. Akbar, S. Rauf, Y. Dong, P. D. Lund, B. Zhu and M. I. Asghar, J. Membr. Sci., 2023, 668, 121264 CrossRef CAS
- B. Zhu, L. Fan, N. Mushtaq, R. Raza, M. Sajid, Y. Wu, W. Lin, J.-S. Kim, P. D. Lund and S. Yun, Electrochem. Energy Rev., 2021, 1–36 Search PubMed
- N. Mushtaq, C. Xia, W. Dong, B. Wang, R. Raza, A. Ali, M. Afzal and B. Zhu, ACS Appl. Mater. Interfaces, 2019, 11(42), 38737–38745 CrossRef CAS PubMed
- B. Zhu, P. D. Lund, R. Raza, Y. Ma, L. Fan, M. Afzal, J. Patakangas, Y. He, Y. Zhao, W. Tan, Q.-A. Huang, J. Zhang and H. Wang, Adv. Energy Mater., 2015, 5, 1401895 CrossRef
- Y. Zhou, X. Guan, H. Zhou, K. Ramadoss, S. Adam, H. Liu, S. Lee, J. Shi, M. Tsuchiya and D. D. Fong, Nature, 2016, 534, 231–234 CrossRef CAS PubMed
- C. Xia, Y. Mi, B. Wang, B. Lin, G. Chen and B. Zhu, Nat. Commun., 2019, 10, 1–9 CrossRef CAS
- M. Akbar, G. Qu, W. Yang, J. Gao, M. Yousaf, N. Mushtaq, X. Wang, W. Dong, B. Wang and C. Xia, J. Alloys Compd., 2022, 166565 CrossRef CAS
- B. Wang, B. Zhu, S. Yun, W. Zhang, C. Xia, M. Afzal, Y. Cai, Y. Liu, Y. Wang and H. Wang, NPG Asia Mater., 2019, 11, 51 CrossRef
- Y. Xing, Y. Wu, L. Li, Q. Shi, J. Shi, S. Yun, M. Akbar, B. Wang, J.-S. Kim and B. Zhu, ACS Energy Lett., 2019, 4, 2601–2607 CrossRef CAS
- S. H. I. Qingle, H. Zhang, L. I. Tianjing, Y. U. Fangli, H. O. U. Haijun and H. A. N. Pengde, J. Rare Earths, 2015, 33, 304–309 CrossRef
- Y. Liu, L. Fan, Y. Cai, W. Zhang, B. Wang and B. Zhu, ACS Appl. Mater. Interfaces, 2017, 9, 23614–23623 CrossRef CAS PubMed
- Y. Cai, Y. Chen, M. Akbar, B. Jin, Z. Tu, N. Mushtaq, B. Wang, X. Qu, C. Xia and Y. Huang, Nano-Micro Lett., 2021, 13, 1–14 CAS
- S. U. Tekale, V. P. Pagore, S. S. Kauthale and R. P. Pawar, Chin. Chem. Lett., 2014, 25, 1149–1152 CrossRef CAS
- R. Ren, Z. Wang, X. Meng, X. Wang, C. Xu, J. Qiao, W. Sun and K. Sun, ACS Appl. Energy Mater., 2020, 3, 4914–4922 CrossRef CAS
- L. Li, B. Zhu, J. Zhang, C. Yan and Y. Wu, Int. J. Hydrogen Energy, 2018, 43, 12909–12916 CrossRef CAS
- J. Wright and A. V. Virkar, J. Power Sources, 2011, 196, 6118–6124 CrossRef CAS
- J. Gulicovski, S. Nenadović, L. Kljajević, M. Mirković, M. Nišavić, M. Kragović and M. Stojmenović, Polymers, 2020, 12, 248 CrossRef CAS PubMed
- S. Paydar, M. H. Shariat and S. Javadpour, Int. J. Hydrogen Energy, 2016, 41, 23145–23155 CrossRef CAS
- J. Garcia-Barriocanal, A. Rivera-Calzada, M. Varela, Z. Sefrioui, E. Iborra, C. Leon, S. J. Pennycook and J. Santamaria, Science, 2008, 321, 676–680 CrossRef CAS PubMed
- C. Xia, Y. Mi, B. Wang, B. Lin, G. Chen and B. Zhu, Nat. Commun., 2019, 10, 1–9 CrossRef CAS PubMed
- B. Wang, Y. Cai, C. Xia, Y. Liu, A. Muhammad, H. Wang and B. Zhu, Electrochem. Commun., 2016, 73, 15–19 CrossRef CAS
- M. Akbar, J. Bin, Z. Tu, J. Gao, M. Yousaf, N. Mushtaq, X. Wang, W. Dong, B. Wang, Y. Cai and C. Xia, Electrochim. Acta, 2021, 393, 139067 CrossRef CAS
- J. Zheng, H. Zhu, W. Li, Z. Ma, X. Ou, Y. Fan, Y. Guo, X. Wang and Y. Ling, Int. J.
Hydrogen Energy, 2021, 46, 13318–13329 CrossRef CAS
- T. Mori, J. Drennan, J.-H. Lee, J.-G. Li and T. Ikegami, Solid State Ionics, 2002, 154, 461–466 CrossRef
- S.-F. Wang, Y.-L. Liao, Y.-F. Hsu and P. Jasinski, J. Power Sources, 2022, 546, 231995 CrossRef CAS
- X. Peng, Y. Tian, Y. Liu, W. Wang, J. Li, B. Chi, J. Pu and J. Li, Int. J. Hydrogen Energy, 2020, 45, 14461–14469 CrossRef CAS
- G. Chen, W. Sun, Y. Luo, Y. He, X. Zhang, B. Zhu, W. Li, X. Liu, Y. Ding and Y. Li, ACS Appl. Mater. Interfaces, 2019, 11, 10642–10650 CrossRef CAS PubMed
- X. Zhou and F. Zhou, Int. J. Hydrogen Energy, 2021, 46, 9988–9995 CrossRef CAS
- Y. Meng, W. Zhang, Z. He, C. Liu, J. Gao, M. Akbar, R. Guo, S. Zhou, Y. Ji and X. Wang, Int. J. Hydrogen Energy, 2021, 46, 9874–9881 CrossRef CAS
Footnote |
| † Electronic supplementary information (ESI) available. See DOI: https://doi.org/10.1039/d3ra01698f |
| This journal is © The Royal Society of Chemistry 2023 |