 Open Access Article
Creative Commons Attribution 3.0 Unported Licence
Optimizing the luminescence efficiency of an europium (Eu3+) doped SrY2O4 phosphor for flexible display and lighting applications
Neeraj Vermaa,
Marta Michalska-Domańska *b,
Tirath Rama,
Jagjeet Kaura,
Abhishek Kumar Misraa,
Vikas Dubey
 *c,
Neha Dubeya,
Kanchan Tiwarid and
M. C. Rao*e
aDepartment of Physics, Government Vishwanath Yadav Tamaskar Post Graduate Autonomous College, Durg, Chhattisgarh, India
bMilitary University of Technology in Warsaw, Warsaw, Mazovia, Poland. E-mail: marta.michalska@wat.edu.pl
cDepartment of Physics, Bhilai Institute of Technology, Raipur, Chhattisgarh, India. E-mail: jsvikasdubey@gmail.com
dGovernment Nagarjuna Post Graduate College of Science, Raipur, Chhattisgarh, India
eDepartment of Physics, Andhra Loyola College, Vijayawada, Andhra Pradesh, India. E-mail: raomc72@gmail.com
First published on 5th July 2023
Abstract
This research paper reports the synthesis and luminescence study of an Eu3+ activated SrY2O4 phosphor prepared by a modified solid-state reaction method with varying concentrations of Eu3+ ions (0.1–2.5 mol%). X-ray diffraction (XRD) revealed the orthorhombic structure and Fourier transform infrared spectroscopy (FTIR) methods were used to analyse the produced phosphors. Photoluminescence emission and excitation spectra were recorded for varying concentrations of Eu3+ ions, and an optimum concentration of 2.0 mol% was found to produce the highest intensity. Under 254 nm excitation the emission peaks were found to be at 580 nm, 590 nm, 611 nm and 619 nm, corresponding to transitions at 5D0 → 7F0, 5D0 → 7F1, and 5D0 → 7F2 respectively. Because of Eu3+ inherent luminosity, these emission peaks indicate radiative transitions between excited states of ions, making them useful for developing white light-emitting phosphors for optoelectronic and flexible display applications. The 1931 CIE (x, y) chromaticity coordinates were calculated from the photoluminescence emission spectra and found to be near white light emission, indicating the potential application of the prepared phosphor for light emitting diodes (white component). TL glow curve analysis was also performed for various concentrations of doping ions and UV exposure times, and a single broad peak was observed at 187 °C. Using the computerised glow curve deconvolution (CGCD) method, kinetic parameters were computed.
1. Introduction
The rosy fantasy of a life that can be controlled with the press of a button and more automation would make the daily lives of humans easier. The current trend of innovation and research has made it easier for people to explore new areas of science and technology. Smart materials are one of the aspects of this new frontier. Smart materials are any substances that are capable of detecting or responding to outside stimuli. There are many other types of stimuli that may be used, including environmental, optical, chemical, electrical, thermal, biological, physical, etc.1–4 Since the reduction in the size of display systems, luminescent materials have attracted a lot of research attention.5–7 Applications for smart luminescent materials are widespread, ranging from polymeric optical fibers and LEDs to displays, self-emitting devices, and light sensors.8–12 Achieving durability and adaptability of the electronics and materials used in flexible electronic devices without compromising performance is a critical challenge for smart materials.13–18 This obstacle is readily overcome with the use of nanotechnology. The usefulness of several micro- and nanoparticles as smart materials has been reported.19–22 Because of this, the intrinsic luminescence feature is the main focus of this study. This property has the potential to be employed in an intelligent (smart) material regarding applications of flexible display.Europium (Eu3+) doped SrY2O4 is a well-known luminescence material because it exhibits strong and long-lasting red luminescence under ultraviolet or blue light excitation. The luminescence properties of this material are due to the presence of Eu3+ ions, which are known for their unique electronic transitions. There are several reasons why Eu3+ doped SrY2O4 is a good luminescence material:
(1) Quantum yield: the quantum yield refers to the efficiency of a phosphor in converting absorbed energy into emitted light. Eu3+-doped SrY2O4 phosphor has a relatively high quantum yield, typically ranging from 60% to 80%. However, it's important to note that the quantum yield can vary depending on the specific manufacturing process and conditions.
(2) Color purity:
• Eu3+-doped SrY2O4: this phosphor typically exhibits a red emission providing good color purity.
• Y2O3:Eu: this phosphor is known for its red emission, offering high color purity.
• Y2O2S:Eu: this phosphor generally produces a yellowish-red emission, which also has good color purity.
(3) Cost: the cost of phosphor materials can vary based on several factors, including the availability of raw materials and the complexity of the manufacturing process. Eu3+-doped SrY2O4 phosphor is relatively more expensive compared to some other commonly used phosphors such as cerium-doped yttrium aluminum garnet (YAG:Ce) or various sulfide-based phosphors. The higher cost can be attributed to the specific composition and synthesis methods required to produce SrY2O4:Eu3+ phosphor.
(4) Stability and lifetime: phosphor stability and lifetime are crucial factors to consider in practical applications. Eu3+-doped SrY2O4 phosphor exhibits good thermal and chemical stability, allowing it to withstand the harsh conditions typically encountered in solid-state lighting devices. Additionally, it offers a long operational lifetime, ensuring sustained performance over extended periods.
(5) Excitation wavelength: another important aspect is the excitation wavelength required to activate the phosphor material. Eu3+-doped SrY2O4 phosphor typically requires ultraviolet (UV) or near-UV excitation in the range from 250 to 350 nm. This wavelength range can be achieved using various light sources, including UV LEDs and mercury lamps.
(6) Luminescent properties:
• Eu3+-doped SrY2O4: this phosphor has a relatively high luminescence efficiency, long decay time, and good thermal stability, making it suitable for various applications such as lighting and displays.
• Y2O3:Eu: phosphor is known for its high luminescence efficiency and good thermal stability, making it commonly used in red-emitting devices.
• Y2O2S:Eu: phosphor also has high luminescence efficiency and good thermal stability. It is often used in yellowish-red-emitting devices.
(7) Application specifics:
• Eu3+-doped SrY2O4: due to its blue-green emission, this phosphor is often used in applications requiring a specific color range, such as white LEDs and plasma displays.
• Y2O3:Eu: phosphor finds extensive use in red-emitting devices like fluorescent lamps, plasma displays, and cathode ray tubes (CRTs).
• Y2O2S:Eu: phosphor is commonly employed in yellowish-red-emitting devices like white LEDs, plasma displays, and CRTs.
Metal oxides with rare earth ion doping have mostly been used for their luminous characteristics. Rare earth ion-doped alkali earth metallic yttrates (MY2O4, M = Ba, Ca, and Sr) have been seen to exhibit prominent optical emission. According to reports, SrY2O4:RE3+ (RE = Dy, Eu, Tb, Gd, Sm, Ce, and Er) may be made using a variety of techniques, including solution combustion, sol–gel, citrate sol–gel, polyol, oil emulsion, aldo-keto gel, and co-precipitation.23 The red optical emission of europium makes it one of the intriguing and flexible lanthanides, making it a prime candidate for luminescence applications. SrY2O4:Eu3+ (SYO:Eu) has a structure similar to CaFe2O4 and exhibits magnificent down-conversion luminescence. At a wavelength of 611 nm, the very powerful emission line produced by the Eu3+ long-lived transition 5D0 → 7F2 may be seen. With the excitation of 254 nm (UV region), europium ions are useful for light emitting phosphor and flexible display applications.24–36 In this paper, we describe how to easily make new Eu3+ doped SrY2O4 phosphors, which may be utilized to improve the attractive performance of intelligent (smart) materials for flexible displaying applications. SYO:Eu phosphors emit red light when exposed to UV radiation.
2. Experimental
The preparation of the SrY2O4 doped with Eu3+ specimen involves a solid-state reaction method. The necessary starting materials, including SrCO3, Y2O3, Eu2O3, and H3BO3, Here are the steps for synthesis and characterization of Eu3+ doped SrY2O4 phosphor:• Preparation of starting materials: SrCO3, Y2O3, and Eu2O3 are weighed and mixed in stoichiometric amounts to obtain the desired composition of SrY2O4:Eu3+.
• Mixing and grinding: the mixture of powders is then ground together in an agate mortar and pestle for 2 hours to ensure a homogenous mixture.
• Calcination: once the mixing was complete, the resulting powder was placed into a furnace and heated to a temperature of 1000 °C for duration of 1 hour.
• Sintering: after calcination the mixture of powders grind for 1 hour in an agate mortar and pestle and the homogenized powder mixture is then calcined in air at a temperature of 1250 °C for 3 hours to form the desired SrY2O4:Eu3+ phosphor. Higher temperature was needed to ensure that the reaction was complete and that the product was fully formed.
The resulting specimen, SrY2O4 doped with Eu3+, was then allowed to cool to room temperature. The specimen was characterized using various techniques to confirm the desired properties, such as its crystal structure, morphology, and luminescent properties.
3. Results and discussion
3.1 X-ray analysis
XRD is a widely used technique that involves shining a beam of X-rays onto a sample and measuring the angle and intensity of the diffracted X-rays. The sample's crystal structure and content may be determined from the ensuing XRD pattern. The XRD pattern of Eu3+ doped SrY2O4 phosphors typically shows characteristic peaks corresponding to the crystalline phases present in the sample. The main phase is SrY2O4, which exhibits aorthorhombic crystal structure. The XRD peaks of SrY2O4 are sharp and well-defined, indicating a high degree of crystallinity and phase purity. The positions and intensities of the peaks can be used to calculate the lattice parameters and crystal structure of the material.The XRD pattern of the sample is shown in Fig. 1 where aorthorhombic structure is displayed. These values match those of the International Centre for Diffraction Data (JCPDS) card No. 032-1272. The crystallite size of the phosphor was calculated using the Scherer equation. The average crystallite size of the phosphor was found to be 34.068 nm (Table 1).
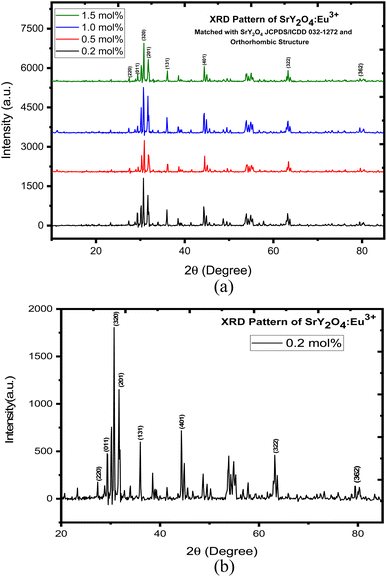 | ||
| Fig. 1 (a) XRD pattern of SrY2O4:Eu3+ phosphor. (b) XRD pattern of SrY2O4:Eu3+phosphor for 0.2 mol%. | ||
| hkl | Peak position (2θ) | FWHM | Crystallite size D (nm) | Average size D (nm) |
|---|---|---|---|---|
| 220 | 23.21705 | 1.38028 | 5.876894136 | 34.06808 |
| *011 | 27.24806 | 0.13642 | 59.93173053 | |
| 320 | 30.67829 | 0.2346 | 35.12083109 | |
| 201 | 31.62791 | 0.2148 | 38.44694105 | |
| 131 | 35.83333 | 0.13504 | 61.83951978 | |
| 401 | 44.26357 | 0.19296 | 44.45405375 | |
| 322 | 63.17829 | 0.52107 | 17.90162841 | |
| 362 | 79.24419 | 1.14963 | 8.973048289 |
3.2 FTIR analysis
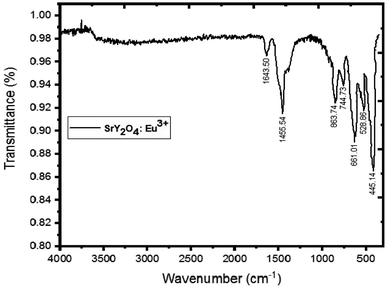
Fig. 2 displays the SrY2O4:Eu3+ (2%) phosphor's FTIR spectrum. Strong, sharp peaks may be seen in this spectrum between 445–863 cm−1, which are indicative of Y–O vibrations. An IR peak with a wavelength of 1455–1643 cm−1 is produced when Sr–O is present.37 The production of SrY2O4 phosphor is confirmed by all of these observed peaks taken together (Table 2).| hkl | Peak position (2θ) | FWHM | Crystallite size D (nm) | Average size D (nm) |
|---|---|---|---|---|
| 220 | 23.34254 | 0.9755 | 8.317365003 | 33.4503 |
| *011 | 27.31909 | 0.13849 | 59.04481715 | |
| 320 | 30.8561 | 0.29096 | 28.32989183 | |
| 201 | 31.86547 | 0.26985 | 30.62172567 | |
| 131 | 36.14804 | 0.15282 | 54.69350767 | |
| 401 | 44.49721 | 0.18065 | 47.52278414 | |
| 322 | 63.39878 | 0.3074 | 30.38083641 | |
| 362 | 79.58315 | 1.1897 | 8.692154104 |
| hkl | Peak position (2θ) | FWHM | Crystallite size D (nm) | Average size D (nm) |
|---|---|---|---|---|
| 220 | 23.33911 | 0.6755 | 12.01116121 | 34.7837 |
| *011 | 27.39439 | 0.1938 | 42.20033311 | |
| 320 | 30.7273 | 0.30141 | 27.33922054 | |
| 201 | 31.70426 | 0.28279 | 29.2088247 | |
| 131 | 36.01264 | 0.17439 | 47.91012036 | |
| 401 | 44.35684 | 0.17304 | 49.58794225 | |
| 322 | 63.23297 | 0.58242 | 16.02063895 | |
| 362 | 79.48164 | 0.19139 | 53.9915117 |
3.3 Scanning electron microscopy (SEM)
Scanning Electron Microscopy (SEM) is a powerful characterization tool that is used to examine the morphology and surface features of europium (Eu3+) doped SrY2O4 phosphors. The technique involves focusing a beam of electrons onto the surface of the sample, causing it to emit secondary electrons that are then collected and analyzed by detectors (Table 4).| hkl | Peak position (2θ) | FWHM | Crystallite size D (nm) | Average size D (nm) |
|---|---|---|---|---|
| 220 | 23.35613 | 0.38574 | 21.03434538 | 32.0282 |
| *011 | 27.56954 | 0.1934 | 42.30342242 | |
| 320 | 30.80483 | 0.28707 | 28.71023965 | |
| 201 | 31.80803 | 0.25283 | 32.67844571 | |
| 131 | 36.17191 | 0.17999 | 46.4405259 | |
| 401 | 44.47332 | 0.19451 | 44.13273883 | |
| 322 | 63.33333 | 0.42113 | 22.16839805 | |
| 362 | 79.5098 | 0.551 | 18.75779935 |
When SEM is used to study Eu3+ doped SrY2O4 phosphors, it provides high-resolution images of the particle size, shape, and distribution (Fig. 3). The technique can also be used to observe any morphological changes that occur as a result of the synthesis method or thermal treatment. SEM imaging can reveal the surface features of the phosphor particles, such as cracks, pores, or other defects, which can affect the luminescence properties of the material (Table 5).
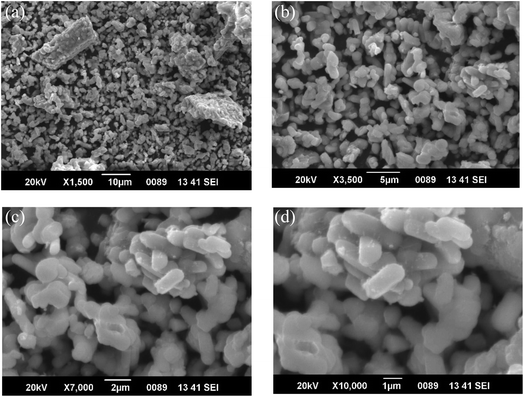 | ||
| Fig. 3 SEM images of SrY2O4:Eu3+ (2.0 mol%) (a) ×1.5k 10 μm (b) ×3.5k 5 μm (c) ×7k 2 μm (d) ×10k 1 μm. | ||
| S. no | Concentration (mol%) | Average crystallite size D (nm) |
|---|---|---|
| 1 | 0.2 | 34.068 |
| 2 | 0.5 | 33.4503 |
| 3 | 1 | 34.7837 |
| 4 | 1.5 | 32.0282 |
3.4 Energy dispersive X-ray spectroscopy (EDX)
Energy Dispersive X-ray Spectroscopy (EDX) analysis is a valuable tool for studying the elemental composition of Eu3+ doped SrY2O4 phosphors and can provide important insights into the materials' luminescence properties. By optimizing the elemental composition and concentration of the phosphor, using this technique we can enhance the luminescence efficiency and stability of the material, which can have important implications for applications such as lighting and sensing.It is an analysis of the components of produced phosphor. Fig. 4a displays quantitative representations of the sample's Y, Sr, O, and Eu elements. The data supports the conclusion that SrY2O4:Eu3+ phosphor can be synthesized. The qualitative analysis of the process of creating the components is shown in Fig. 4b.
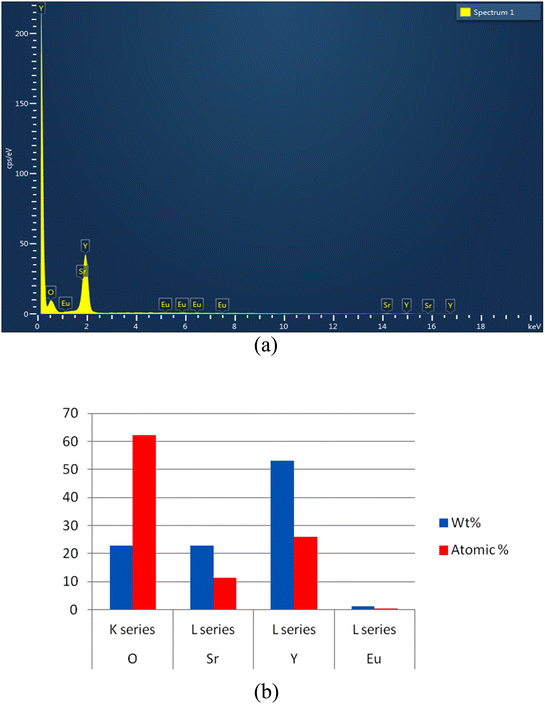 | ||
| Fig. 4 (a) EDX pattern of prepared phosphor Eu3+ (2.0 mol%) doped SrY2O4. (b) Quantitative EDX of Eu3+ doped SrY2O4 phosphor (2.0 mol%). | ||
3.5 Photoluminescence (PL) observation
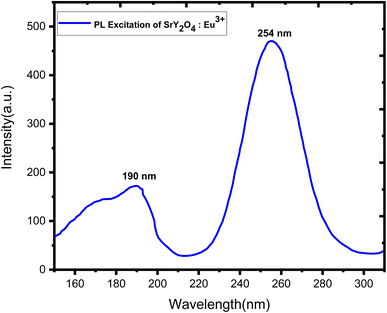
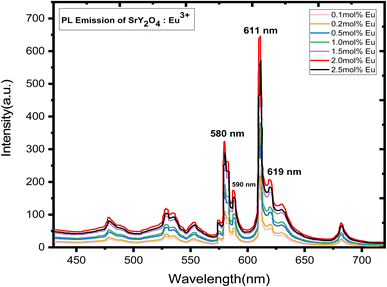
Doping with Eu3+ ions improved the emission spectra of the host SrY2O4 phosphor, which has no luminescence.23 The SrY2O4 phosphor doped with Eu3+ PL excitation spectra are shown in Fig. 5. Excitation spectra were captured at an emission wavelength of 613 nm. It has a wide spectrum between 190 and 254 nanometers. Eu3+ doped SrY2O4 phosphor's PL emission spectrum, measured at 254 nm, shows the typical emissions at 580, 590, 611, and 619 nm. Fig. 6. The emission spectra of Eu3+ are produced by transitions between 5D0 → 7FJ (J = 0, 1, 2).38 The brightest emission band can be seen at 611 nm, which is associated with the electric dipole transition 5D0 → 7F2 (ref. 23–25). The 5D0 → 7F0 and 5D0 → 7F1 magnetic dipole transitions60 give rise to the 580 nm and 590 nm bands, respectively. Due to similar ionic radii, the emergence of the 5D0 → 7F1 transition supports the substitution of Eu3+ ions at Y3+ sites.39 The minor separation of the 5D0 → 7F1 and 5D0 → 7F2 transition lines in the emission spectra of the SrY2O4:Eu3+ phosphor amply demonstrates the considerable influence of the host composition, crystal structure, and coordination environment on luminescence qualities.40 Fig. 6 shows how the concentration of the dopant affects the intensity of the emission. The intensity continues to rise as the Eu3+ ion concentration rises from 0.1 to 2.0 mol%. However, the concentration quenching event causes the intensity to dramatically falldown for 2.5 mol% of the time. Intensity is reduced by quenching, which happens when Eu3+ ions move in closer proximity to one another and interact with one another to transfer charge. Eu3+ doped SrY2O4 phosphors using 2.0 mol% had the highest emission intensity, making it suitable for various light-emitting applications (Table 6).| S. no | Concentration (mol%) | Absorption of photons | Emission of photons | Quantum yield |
|---|---|---|---|---|
| 1 | 0.1 | 22![[thin space (1/6-em)]](https://www.rsc.org/images/entities/char_2009.gif) 988.91862 988.91862 |
5870.677682 | 0.242601398 |
| 2 | 0.2 | 7114.49341 | 0.29400116 | |
| 3 | 0.5 | 10![[thin space (1/6-em)]](https://www.rsc.org/images/entities/char_2009.gif) 769.65826 769.65826 |
0.445048135 | |
| 4 | 1 | 12![[thin space (1/6-em)]](https://www.rsc.org/images/entities/char_2009.gif) 347.99237 347.99237 |
0.51027162 | |
| 5 | 1.5 | 16![[thin space (1/6-em)]](https://www.rsc.org/images/entities/char_2009.gif) 981.28813 981.28813 |
0.701739129 | |
| 6 | 2 | 23![[thin space (1/6-em)]](https://www.rsc.org/images/entities/char_2009.gif) 090.70313 090.70313 |
0.954206169 | |
| 7 | 2.5 | 18![[thin space (1/6-em)]](https://www.rsc.org/images/entities/char_2009.gif) 523.81395 523.81395 |
0.765482863 |
The fluorescence quantum yield (ϕF) is a measure of the efficiency of fluorescence, representing the ratio of absorbed photons to emitted photons through fluorescence. It quantifies the likelihood of the excited state being deactivated through fluorescence rather than non-radiative mechanisms. The comparative method developed by Williams et al. is considered the most reliable approach for determining (ϕF). This method involves utilizing well-characterized standard samples with known (ϕF) values, enabling accurate measurement and comparison of fluorescence efficiencies.62
The fluorescence quantum yield (ϕF) is a parameter that measures the efficiency of fluorescence by comparing the number of absorbed photons to the number of emitted photons. To determine ϕF, one common approach involves analyzing the integrated areas of the absorption and emission spectra. The integrated area represents the number of absorbed photons and the number of emitted photons, respectively. By comparing these values, the fluorescence quantum yield can be accurately calculated (Table 7).
| Compound | Solvent | Literature quantum yield | Emission range/nm | Reference 63–74 |
|---|---|---|---|---|
| Cresyl violet | Methanol | 0.54 | 600–650 | J. Phys. Chem., 1979, 83, 696 |
| Rhodamine 101 | Ethanol + 0.01% HCI | 1.00 | 600–650 | J. Phys. Chem., 1980, 84, 1871 |
| Quinine sulfate | 0.1 M H2SO4 | 0.54 | 400–600 | J. Phys. Chem., 1961, 65, 229 |
| Fluorescein | 0.1 M NaOH | 0.79 | 500–600 | J. Am. Chem. Soc., 1945, 1099 |
| Norharmane | 0.1 M H2SO4 | 0.58 | 400–550 | J. Lumin., 1992, 51, 269–74 |
| Harmane | 0.1 M H2SO4 | 0.83 | 400–550 | J. Lumin., 1992, 51, 269–74 |
| Harmine | 0.1 M H2SO4 | 0.45 | 400–550 | J. Lumin., 1992, 51, 269–74 |
| 2-Methylharmane | 0.1 M H2SO4 | 0.45 | 400–550 | J. Lumin., 1992, 51, 269–74 |
| Chlorophyll A | Ether | 0.32 | 600–750 | Trans. Faraday Soc., 1957, 53, 646–55 |
| Zinc phthalocyanine | 1% pyridine in toluene | 0.30 | 660–750 | J. Chem. Phys., 1971, 55, 4131 |
| Benzene | Cyclohexane | 0.05 | 270–300 | J. Phys. Chem., 1968, 72, 325 |
| Tryptophan | Water, pH 7.2, 25C | 0.14 | 300–380 | J. Phys. Chem., 1970, 74, 4480 |
| 2-Aminopyridine | 0.1 M H2SO4 | 0.60 | 315–480 | J. Phys. Chem., 1968, 72, 2680 |
| Anthracene | Ethanol | 0.27 | 360–480 | J. Phys. Chem., 1961, 65, 229 |
| 9,10-Diphenyl anthracene | Cyclohexane | 0.90 | 400–500 | J. Phys. Chem., 1983, 87, 83 |
3.6 Commission international de I'Eclairage (CIE) coordinates
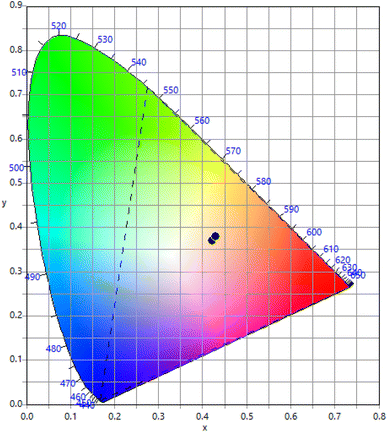
The Commission International de I'Eclairage (CIE) coordinates are a standard way to describe the colour of light emitted by these phosphors. The CIE colour space is a three-dimensional space that describes all possible colours based on three parameters: X, Y, and Z. The X, Y, and Z coordinates represent the relative amounts of red, green, and blue light needed to create a specific colour. The CIE colour space is a useful tool for describing the colour of light emitted by luminescent materials like Eu3+ doped SrY2O4 phosphors. The CIE coordinates of Eu3+ doped SrY2O4 phosphors can be determined using photoluminescence spectroscopy. The emitted light is collected and passed through a monochromator to separate the light into its component wavelengths. The intensity of the light at each wavelength is measured, and the CIE coordinates are calculated based on the spectral distribution of the emitted light. Eu3+ doped SrY2O4 phosphors typically exhibit a near white region luminescence (Fig. 7), with CIE coordinates of according to Table 8. The exact CIE coordinates can vary depending on the specific composition and synthesis conditions of the phosphor.| Concentration | x | y | u′ | v′ | CCT | CRI |
|---|---|---|---|---|---|---|
| 0.1 | 0.4301 | 0.3801 | 0.2568 | 0.5105 | 2912 | 85 |
| 0.2 | 0.43 | 0.3789 | 0.2572 | 0.51 | 2904 | 85 |
| 0.5 | 0.4297 | 0.3797 | 0.2567 | 0.5103 | 2916 | 85 |
| 1 | 0.4306 | 0.3802 | 0.257 | 0.5106 | 2906 | 85 |
| 1.5 | 0.4294 | 0.3793 | 0.2566 | 0.51 | 2919 | 85 |
| 2 | 0.4226 | 0.3692 | 0.2567 | 0.5046 | 2951 | 85 |
| 2.5 | 0.4295 | 0.3791 | 0.2568 | 0.51 | 2915 | 85 |
3.7 TL glow curve analysis
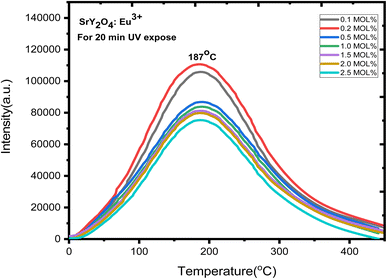
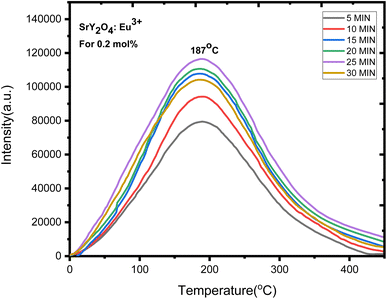
Europium (Eu3+) doped SrY2O4 phosphors exhibit thermoluminescence (TL) properties, which make them useful for radiation dosimetry, medical radiation dosimetry, environmental monitoring, and space radiation dosimetry applications. TL refers to the phenomenon where a material emits light when heated after being exposed to ionizing radiation. The intensity and shape of the TL glow curve, which is the plot of the emitted light intensity as a function of temperature, can provide information about the energy and type of radiation absorbed by the material.Europium-doped SrY2O4 phosphor has a linear response to a 20 minutes UV exposure, as seen by the TL glow curve (Fig. 8). Thermoluminescence (TL) intensity rises with increasing europium concentration (Fig. 8 inset), and its wide peak centers about 187 °C (where the trapped electrons are released from the lattice defects), making it an excellent peak for a thermoluminescence dosimeter. Up to 0.2 mol%, the TL intensity rises; beyond that, it falls as a result of the concentration quenching phenomena (Fig. 9a). The TL glow curve for an optimum concentration of 0.2 mol% is shown in Fig. 10, which displays a linear wide peak with varying UV exposure durations at a fixed rate of heating of 2.5 °C per s. The concentration quenching effect causes TL intensity to drop after the 25 minutes UV treatment for 0.2 mol% (Fig. 11a). Fitting the curve for the optimal concentration of 0.2 mol% using the CGCD method yields an excellent theoretical and experimental fit.
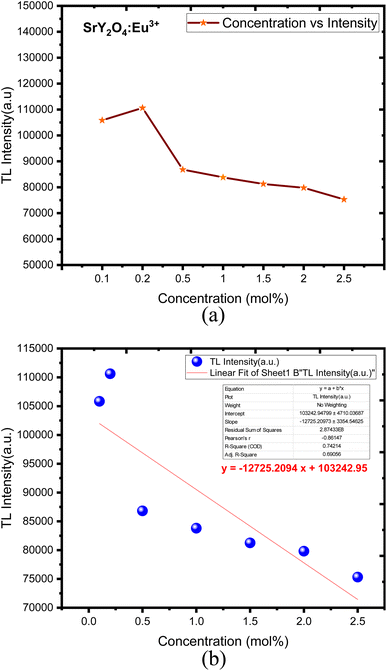 | ||
| Fig. 9 (a) SrY2O4:Eu3+ concentration vs. intensity. (b) Linear fit with a mean error bar of SrY2O4:Eu3+ for (0.1–2.5) mol%. | ||
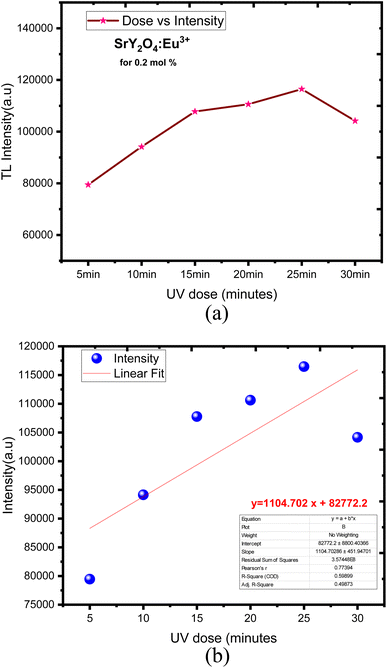 | ||
| Fig. 11 (a) SrY2O4:Eu3+ dose vs. intensity. (b) Linear fit with a mean error bar of SrY2O4:Eu3+ for (5–30 min) UV dose. | ||
Fig. 9b showed the linear fit corresponding to its mean error with respect to concentration response. The obtained TL phosphor exhibits a linear fit for different concentration over from 0.1 to 2.5 mol%. TL intensity was decreased linearly when the dose was increased, obtaining a determination coefficient R2 = 0.74214.75
Fig. 11b showed the linear fit corresponding to its mean error with respect to dose response. The obtained TL phosphor exhibits a linear fit for different concentration over from 5 to 30 min UV dose exposed. TL intensity was increased linearly when the dose was increased, obtaining a determination coefficient R2 = 0.59899.75
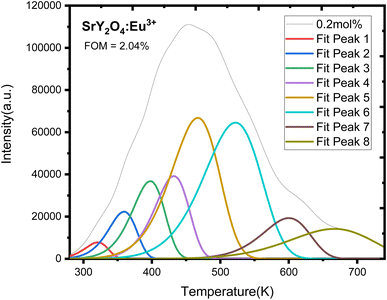 | ||
| Fig. 12 CGCD pattern of UV induced SrY2O4:Eu3+ doped phosphor for optimized UV dose and 0.2 mol% concentration. | ||
Evidently, there are eight wide peaks in the CGCD pattern (Fig. 12), and kinetic parameters are computed for each of those eight peaks in Table 3. After 20 minutes of UV irradiation at varying concentrations of europium ions, the recorded glow curves of the manufactured phosphors reveal a broad peak, suggesting that they are composite in nature. Therefore, the kinetic parameters were deconvoluted and calculated using the CGCD technique. The glow curves of the greatest intensity peak, 0.2 mol% europium ion irradiated with UV for 20 min, were deconvoluted using the CGCD technique using the Glow fit software. The Halperin and Barner formulas provide the mathematical foundation for this computer software. These equations explain the movement of charges between the different energy levels that occur during the process of trap emptying caused by thermal heating. This software calculated the trap level kinetic parameters for each deconvoluted peak. The experimental glow curves were used to fit the theoretically produced glow curves, and the accuracy of the fit was assessed by computing the figure of merit (FOM) associated with each fitting. When FOM values were less than 5%, it was determined that the fits were satisfactory. Current research puts FOM at 2.04%, confirming excellent agreement between theoretically derived and actually observed glow curves.52,53 Fig. 12 displays the fitted TL glow curves, and Table 3 provides a summary of the CGCD-method-calculated values for the frequency factors (s) and trap depths (E) of captured charges.
The location of trapping levels inside the forbidden gap is referred to as trap depth or activation energy (E), and it plays a significant role in the loss of dosimetry information that had been preserved in the materials after irradiation. The order of kinetics (b) is the process by which detrapped charge carriers recombine with their equivalents. When the trap is modeled as a potential well, the number of times an electron collides with the wall multiplied by the wall reflection coefficient gives us the frequency factor (s). As a result, the trapping parameters of a thermoluminescent material are the foundation for an accurate dosimetry investigation.54–61
Here, the information about the trap level obtained from the kinetic parameters (Table 9) shows that almost one electron is trapped there because of the value of (shape factor) 0.435 and it shows the general order kinetics (b) and the needed energy to escape one electron from the trap level is high (0.50–0.86 eV), i.e. activation energy (E), which shows the formation of traps is high and stable. The rate of escaping electrons per second, which falls between 2.12 × 10⁹ and 3.66 × 10⁹ S−1, is likewise fairly high.
| T1 (K) | Tm (K) | T2 (K) | τ | δ | ω | μ = δ/ω | Activation energy (eV) | Frequency factor s−1 |
|---|---|---|---|---|---|---|---|---|
| 298 | 321 | 338 | 23 | 17 | 40 | 0.425 | 0.5 | 2.12 × 10⁹ |
| 332 | 359 | 380 | 27 | 21 | 48 | 0.4375 | 0.5175 | 2.26 × 10⁹ |
| 366 | 398 | 422 | 32 | 24 | 56 | 0.4285714 | 0.5458 | 2.33 × 10⁹ |
| 398 | 432 | 458 | 34 | 26 | 60 | 0.4333333 | 0.6118 | 2.65 × 10⁹ |
| 420 | 467 | 504 | 47 | 37 | 84 | 0.4404762 | 0.5011 | 2.20 × 10⁹ |
| 466 | 522 | 566 | 56 | 44 | 100 | 0.44 | 0.523 | 2.30 × 10⁹ |
| 552 | 600 | 636 | 48 | 36 | 84 | 0.4285714 | 0.8559 | 3.66 × 10⁹ |
| 587 | 666 | 731 | 79 | 65 | 144 | 0.4513889 | 0.5823 | 2.62 × 10⁹ |
3.8 Conclusion
The present study provides valuable insights into the properties of SrY2O4:Eu3+phosphors, as summarized in the following conclusions:(1) XRD analysis confirmed the existence of a single orthorhombic crystalline phase in the newly synthesized SrY2O4:Eu3+ phosphor, with nanocrystalline behavior.
(2) The SrY2O4:Eu3+ phosphors exhibited a fine surface morphology with a spherical shape which is confirmed by SEM imaging.
(3) FTIR spectra revealed specific vibration modes of Y–O, Sr–O, and the production of SrY2O4 phosphor is confirmed by all of these observed peaks taken together.
(4) Photoluminescence excitation spectra showed a broad excitation centered at 254 nm, with well-resolved emission peaks 580 nm, 590 nm, 611 nm and 619 nm corresponding to transitions at 5D0 → 7F0, 5D0 → 7F1, and5D0 → 7F2, respectively.
(5) The emission color of SrY2O4:Eu3+ phosphors was in the near white light region, as shown in the CIE 1931 graph, and exhibited good color tenability. These can act as a white light-emitting phosphor for optoelectronic and flexible display applications.
(6) The TL glow curve demonstrated that the thermoluminescence intensity of SrY2O4:Eu3+ phosphors increased with increasing UV exposure time and peaked at 187 °C, indicating a good thermoluminescence dosimeter peak.
(7) The CGCD methodology provided a successful theoretical and experimental fit, with kinetic parameters computed for SrY2O4:Eu3+ phosphor and itshows general order kinetics (b) (Table 9).
Eu3+ doped SrY2O4 is a good luminescence material due to its high quantum efficiency, narrow emission bands, long luminescence lifetime, and high stability, making it a versatile material for various applications in optoelectronics, such as solid-state lighting and flat panel displays.
Conflicts of interest
There are no conflicts to declare.Acknowledgements
I am grateful to all of those with whom I have had the pleasure to work during research. My supervisor Dr Jageet Kaur saluja and Dr Vikas Dubey has provided me extensive personal and professional guidance and taught me a great deal about both scientific research and life in general.References
- D. C. Celikel, Smart E-Textile Materials, in Advanced functional materials, ed. N. Tasaltin, P. S. Nnamchi and S. Saud, IntechOpen, London, 2020, pp. 1–16, DOI:10.5772/intechopen.92439.
- L. Liu, W. Xu, Y. Ding, S. Agarwal, A. Greiner and G. Duan, A review of smart electrospunfibers toward textiles, Comput. Commun., 2020, 22, 100506, DOI:10.1016/j.coco.2020.100506.
- M. Ghahremani Honarvar and M. Latifi, Overview of wearable electronics and smart textiles, J. Text. Inst., 2017, 108(4), 631–652, DOI:10.1080/00405000.2016.1177870.
- M. Chen, Y. Ma, J. Song, C. F. Lai and B. Hu, Smart clothing: connecting human with clouds and big data for sustainable health monitoring, Mob. Netw. Appl., 2016, 21(5), 825–845, DOI:10.1007/s11036-016-0745-1.
- A. Bratovcic, Different applications of nanomaterials and their impact on the environment, Int. J. Mater. Sci. Eng., 2019, 5(1), 1–7, DOI:10.14445/23948884/IJMSE-V5I1P101.
- P. Kumar, S. Singh and B. K. Gupta, Future prospects of luminescent nanomaterial based security inks: from synthesis to anti-counterfeiting applications, Nanoscale, 2016, 8(30), 14297–14340, 10.1039/C5NR06965C.
- J. Yu, M. Luo, Z. Lv, S. Huang, H. H. Hsu, C. C. Kuo and Y. Zhou, Recent advances in optical and optoelectronic data storage based on luminescent nanomaterials, Nanoscale, 2020, 12(46), 23391–23423, 10.1039/D0NR06719A.
- S. Kwon, Y. H. Hwang, M. Nam, H. Chae, H. S. Lee, Y. Jeon and K. C. Choi, Recent progress of fiber shaped lighting devices for smart display applications—a fibertronic perspective, Adv. Mater., 2020, 32(5), 1903488, DOI:10.1002/adma.201903488.
- M. Cinquino, C. T. Prontera, M. Pugliese, R. Giannuzzi, D. Taurino, G. Gigli and V. Maiorano, Light-emitting textiles: device architectures, working principles, and applications, Micromachines, 2021, 12(6), 652, DOI:10.3390/mi12060652.
- X. Shi, Y. Zuo, P. Zhai, J. Shen, Y. Yang, Z. Gao and H. Peng, Large-area display textiles integrated with functional systems, Nature, 2021, 591(7849), 240–245, DOI:10.1038/s41586-021-03295-8.
- M. Haque, Nano fabrics in the 21st century: a review, Asian J. Nanosci. Mater., 2019, 2(2), 131–148, DOI:10.26655/ajnanomat.2019.3.2.
- Z. Gong, Z. Xiang, X. OuYang, J. Zhang, N. Lau, J. Zhou and C. C. Chan, Wearable fiber optic technology based on smart textile: a review, Materials, 2019, 12(20), 3311, DOI:10.3390/ma12203311.
- C. W. Kan and Y. L. Lam, Future trend in wearable electronics in the textile industry, Appl. Sci., 2021, 11(9), 3914, DOI:10.3390/app11093914.
- A. Angelucci, M. Cavicchioli, I. A. Cintorrino, G. Lauricella, C. Rossi, S. Strati and A. Aliverti, Smart textiles and sensorized garments for physiological monitoring: a review of available solutions and techniques, Sensors, 2021, 21(3), 814, DOI:10.3390/s21030814.
- X. Hu, Y. Dou, J. Li and Z. Liu, Buckled structures: fabrication and applications in wearable electronics, Small, 2019, 15(32), 1804805, DOI:10.1002/smll.201804805.
- Q. Zhang, Y. L. Wang, Y. Xia, P. F. Zhang, T. V. Kirk, X. D. Chen and X. D, Textile-only capacitive sensors for facile fabric integration without compromise of wearability, Adv. Mater. Technol., 2019, 4(10), 1900485, DOI:10.1002/admt.201900485.
- A. A. Simegnaw, B. Malengier, G. Rotich, M. G. Tadesse and L. Van Langenhove, Review on the integration of microelectronics for E-Textile, Materials, 2021, 14(17), 5113, DOI:10.3390/ma14175113.
- E. A. Hassan, M. A. Ahmed, S. Zhu and O. K. Alebeid, Fibre-based wearable electronic technology for personal protective clothing, in Protective textiles from natural resources, Woodhead Publishing, 2022, pp. 511–547, DOI:10.1016/B978-0-323-90477-3.00019-5.
- A. A. Basheer, Advances in the smart materials applications in the aerospace industries, Aircr. Eng. Aerosp. Technol., 2020, 92(7), 1027–1035, DOI:10.1108/AEAT-02-2020-0040.
- A. Raza, U. Hayat, T. Rasheed, M. Bilal and H. M. Iqbal, “Smart” materials-based near-infrared light-responsive drug delivery systems for cancer treatment: a review, J. Mater. Sci. Technol., 2019, 8(1), 1497–1509, DOI:10.1016/j.jmrt.2018.03.007.
- C. Mendes-Felipe, J. Oliveira, I. Etxebarria, J. L. Vilas-Vilela and S. Lanceros-Mendez, State-of-the-art and future challenges of UV curable polymer-based smart materials for printing technologies, Adv. Mater. Technol., 2019, 4(3), 1800618, DOI:10.1002/admt.201800618.
- Z. Li, F. Yang and Y. Yin, Smart materials by nanoscale magnetic assembly, Adv. Funct. Mater., 2020, 30(2), 1903467, DOI:10.1002/adfm.201903467.
- R. Priya, S. Kaur, U. Sharma, O. P. Pandey and S. J. Dhoble, A review on recent progress in rare earth and transition metals activated SrY2O4 phosphors, J. Mater. Sci.: Mater. Electron., 2020, 31(16), 13011–13027, DOI:10.1007/s10854-020-03930-6.
- S. P. Ghorpade, R. H. Krishna, R. M. Melavanki, V. Dubey and N. R. Patil, Effect of Eu3+ on optical and energy bandgap of SrY2O4 nanophosphors for FED applications, Optik, 2020, 208, 164533, DOI:10.1016/j.ijleo.2020.164533.
- D. R. Taikar, Synthesis and luminescence property of SrY2O4: M (M= Eu3+, Tb3+, Sm3+ Tb3+, Sm3+, Ce3+, Bi3+) phosphors, J. Lumin., 2018, 204, 24–29, DOI:10.1016/j.jlumin.2018.07.040.
- E. Pavitra, G. S. R. Raju, W. Park and J. S. Yu, Concentration and penetration depth dependent tunable emissions from Eu3+ co-doped SrY2O4:Dy3+ nanocrystalline phosphor, New J. Chem., 2014, 38(1), 163–169, 10.1039/C3NJ00987D.
- R. K. Tamrakar and K. Upadhyay, Combustion synthesis and luminescence behaviour of the Tb3+ doped SrY2O4 phosphor, J. Electron. Mater., 2018, 47(1), 651–654, DOI:10.1007/s11664-017-5825-x.
- S. P. Ghorpade, N. Kottam, R. Melavanki and N. R. Patil, Photoluminescence, TGA/DSC and photocatalytic activity studies of Dy3+ doped SrY2O4 nanophosphors, RSC Adv., 2020, 10(36), 21049–21056, 10.1039/D0RA03094E.
- V. Singh, K. Swapna, S. Kaur, A. S. Rao and J. L. Rao, Narrow-band UVB-emitting Gddoped SrY2O4 phosphors, J. Electron. Mater., 2020, 49(5), 3025–3030, DOI:10.1007/s11664-020-08032-x.
- R. Wei, Z. Zheng, Y. Shi, X. Peng, H. Wang, X. Tian and H. Guo, Tunable emission with excellent thermal stability in single-phased SrY2O4: Bi3+, Eu3+ phosphors for UV-LEDs, J. Alloys Compd., 2018, 767, 403–408, DOI:10.1016/j.jallcom.2018.07.101.
- S. Bhatia, R. Priya, D. Kumar, S. Upadhyay and O. P. Pandey, Structural and luminescent studies of titanium co-doped SrY2O4:Eu phosphors, Luminescence, 2022, 37(9), 1585–1596, DOI:10.1002/bio.4335.
- I. Suryawanshi, R. Kalia, R. K. Kunchala, S. L. Mudavath and B. S. Naidu, Detection of latent fingerprints using luminescent Gd0.95Eu0.05PO4 nanorods, J. Rare Earths, 2022, 40(4), 572–578, DOI:10.1016/j.jre.2021.01.015.
- S. P. Singh, S. Srinidhi, R. K. Kunchala, R. Kalia, S. N. Achary and B. S. Naidu, Structural and excitation-dependent photoluminescence properties of Bi0.95xGdxEu0.05PO4(0 ≤ x ≤ 0.95) solid solutions and their anticounterfeiting applications, Cryst. Growth Des., 2021, 21(8), 4619–4631, DOI:10.1021/acs.cgd.1c00467.
- I. Suryawanshi, S. Srinidhi, S. Singh, R. Kalia, R. K. Kunchala, S. L. Mudavath and B. S. Naidu, Downshifting and upconversion dual mode emission from lanthanide doped GdPO4 nanorods for unclonable anti-counterfeiting, Mater. Today Commun., 2021, 26, 102144, DOI:10.1016/j.mtcomm.2021.102144.
- I. Pushpendra, R. K. Kunchala, S. N. Achary and B. S. Naidu, NaBi0.9Eu0.1(MoO4)2 nanomaterials: tailoring the band gap and luminescence by La3+ substitution for light-emitting diodes, ACS Appl. Nano Mater., 2019, 2(9), 5527–5537, DOI:10.1021/acsanm.9b01111.
- I. Pushpendra, R. K. Kunchala, S. N. Achary, A. K. Tyagi and B. S. Naidu, Rapid, room temperature synthesis of Eu3+ Doped NaBi(MoO4)2 nanomaterials: structural, optical, and photoluminescence properties, Cryst. Growth Des., 2019, 19(6), 3379–3388, DOI:10.1021/acs.cgd.9b00267.
- M. A. Salim, R. Hussin, M. S. Abdullah, S. Abdullah, N. S. Alias, S. A. A. Fuzi, M. N. M. Yusuf and K. M. Mahbor, Solid State Sci. Technol., 2009, 17(2), 59–64 CAS.
- J. Chen, J. Wang, F. Zhang, D. Yan, G. Zhang, R. Zhuo and P. Yan, Structure and photoluminescence property of Eu-doped SnO2 nanocrystalline powders fabricated by sol–gel calcination process, J. Phys. D, 2008, 41(10), 105306, DOI:10.1088/0022-3727/41/10/105306.
- V. Dubey, J. Kaur and S. Agrawal, Effect of europium doping levels on photoluminescence and thermoluminescence of strontium yttrium oxide phosphor, Mater. Sci. Semicond. Process., 2015, 31, 27–37, DOI:10.1016/j.mssp.2014.10.052.
- H. J. Song, L. Q. Zhou, Y. Huang, L. Li, T. Wang and L. Yang, Synthesis, characterization and luminescent properties of La2Zr2O7: Eu3+ nanorods, Chin, J. Chem. Phys., 2013, 26(1), 83, DOI:10.1063/1674-0068/26/01/83-87.
- R. J. Chen, Electrochem Soc., 1969, 116, 1254 CrossRef CAS; V. Pagonis and C. Michael, Radiation Meas, 1994, 23, 131 CrossRef.
- S. Doredrajit and S. Ingotombi, J. Phys. D: Appl. Phys., 1995, 28, 1509 CrossRef.
- Y. Krish, P. D. Townsend and S. Soval, Nuclear tracks and radiation measurements, 1987, 13, 115 CrossRef.
- K. S. V. Nambi and S. Mitra, Thermochim. Acta, 1978, 27, 61 CrossRef CAS.
- R. K. Gartia, S. J. Singh and P. S. Mazumdar, Phys. Status Solidi A, 1989, 114, 407 CrossRef.
- S. W. S. McKeever, Thermoluminescence of solids, Cambridge University Press, Cambridge, 1985, p. 390 Search PubMed.
- M. Martini and F. Meinardi, Thermally stimulated luminescence: new Perspectives in the study of defects in solids, Riv. Nuovo Cimento, 1997, 20–4(8), 1–71 Search PubMed.
- R. Chen and S. W. S. McKeever, Theory of Thermoluminescence and Related Phenomenon, World Scientific, Singapore, New Jersey, London, Hong Kong, 1997, p. 559 Search PubMed.
- S. W. S. McKeever, M. Moscovitch and P. D. Townsend, Thermoluminescence Dosimetry materials: Properties and Uses, Nuclear Technology Publishing, Ashford, 1995, p. 221 Search PubMed.
- M. Martini, S. Paravisi and C. liguori, A new high sensitivity spectrometer For 3D-thermoluminescence analysis, Radiat. Prot. Dosim., 1996, 66(4), 47–51 Search PubMed.
- G. kitis, E. C. Zoragoza and C. Furetta, Appl. Radiat. Isot., 2005, 63, 247–254 CrossRef CAS PubMed.
- K. S. Chung, H. S. Choe, J. I. Lee and S. Y. Chang, Radiat Prot. Dosimetry, 2005, 115, 136–143 CrossRef PubMed.
- S. Som, M. Choedhury and S. K. Sharma, Radiat. Phys. Chem., 2015, 110, 51–58 CrossRef CAS.
- V. Dubey, N. S. Suryanarayana and J. Kaur, J. Miner. Mater. Charact. Eng., 2010, 9(12), 1101–1111 Search PubMed.
- R. Shrivastava, J. Kaur, V. Dubey and B. Jaykumar, Bull. Mater. Sci., 2014, 37(4), 925–929 CrossRef CAS.
- R. Shrivastava, J. Kaur, V. Dubey, N. S. Suryanarayana and B. Jaykumar, Res. Chem. Intermed., 2014, 40(2), 487–493 CrossRef CAS.
- V. Dubey, J. Kaur, N. S. Suryanarayana and K. V. R. Murthy, Res. Chem. Intermed., 2015, 40(2), 531–536 CrossRef.
- J. Kaur, V. Dubey and N. S. Suryanarayana, Res. Chem. Intermed., 2014, 39(9), 4337–4349 CrossRef.
- R. Tamrakar, V. Dubey, N. K. Swamy, R. Tiwari and S. V. N. Pammi, Research on Chemical, Intermediates, 2013, 39(8), 3919–3923 CrossRef CAS.
- V. Dubey, J. Kaur, N. S. Suryanarayana and K. V. R. Murthy, Res. Chem. Intermed., 2013, 39(8), 3689–3697 CrossRef CAS.
- V. Dubey, Thermoluminescence Study of Semaria Limestone of C.G.Basin, LAP LAMBERT Academic Publishing, 2012, ISBN 978-3-8473-4210-6 Search PubMed.
- T. R. Williams, S. A. Winfield and J. N. Miller, Relative fluorescence quantum yields using a computer controlled luminescence spectrometer, Analyst, 1983, 108, 1067 RSC.
- D. Magde, J. H. Brannon, T. L. Cremers and J. Olmsted, J. Phys. Chem., 1979, 83(6), 696–699, DOI:10.1021/j100469a012.
- R. More and A. L. Capparelli, J. Phys. Chem., 1980, 84(14), 1870–1871, DOI:10.1021/j100451a028.
- W. H. Melhuish, J. Phys. Chem., 1961, 65(2), 229–235, DOI:10.1021/j100820a009.
- J. Q. Umberger and V. K. LaMer, J. Am. Chem. Soc., 1945, 67(7), 1099–1109 CrossRef CAS.
- A. Pardo, D. Reyman, J. M. L. Poyato and F. Medina, J. Lumin., 1992, 51(5), 269–274 CrossRef CAS.
- G. Weber and F. W. J Teale, Trans. Faraday Soc., 1957, 53, 646–655 RSC.
- P. S. Vincett, E. M. Voigt and K. E. Rieckhoff, J. Chem. Phys., 1971, 55, 4131–4140 CrossRef CAS.
- W. R. Dawson and M. W. Windsor, J. Phys. Chem., 1968, 72(9), 3251–3260 CrossRef CAS.
- E. P. Kirby and R. F. Steiner, J. Phys. Chem., 1970, 74(26), 4480–4490 CrossRef CAS.
- R. Rusakowicz and A. C. Testa, J. Phys. Chem., 1968, 72(7), 2680–2681 CrossRef CAS.
- W. H. Melhuish, J. Phys. Chem., 1961, 65(2), 229–235 CrossRef CAS.
- S. Hamai and F. Hirayama, J. Phys. Chem., 1983, 87(1), 83–89 CrossRef CAS.
- T. Swarnapriya, V. Hernandez, M. Ceron, P. Gomez, C. Wiechers, E. Carlos Montes, N.-M. Ricardo and S. Modesto, Thermoluminescence of Cu doped Li2B4O7 + PTFE Annealed by Graphene exposed to X-rays and Gamma radiation, J. Mol. Eng. Mater., 2020, 8, 3–4, DOI:10.1142/S2251237320500057.
| This journal is © The Royal Society of Chemistry 2023 |

