
 Open Access Article
 This Open Access Article is licensed under a Creative Commons Attribution-Non Commercial 3.0 Unported Licence
MXene V2C-coated runway-type microfiber knot resonator for an all-optical temperature sensor
Qing Wua,
Junhong Rana,
Tong Zhengac,
Haibin Wua,
Yubo Liaob,
Fengpeng Wangb and
Si Chen *b
*b
aHeilongjiang Province Key Laboratory of Laser Spectroscopy Technology and Application, Harbin University of Science and Technology, Harbin 150080, China. E-mail: wuqing@buaa.edu.cn
bSchool of Physics and Electronic Information, Gannan Normal University, Ganzhou, Jiangxi 341000, China. E-mail: chensics9@163.com
cSchool of Artificial Intelligence, Beijing Technology and Business University, Beijing 100048, China. E-mail: 20211206@btbu.edu.cn
First published on 27th June 2023
Abstract
We present an all-optical temperature sensor device made of an MXene V2C integrated runway-type microfiber knot resonator (MKR) for the first time. MXene V2C is coated on the surface of the microfiber by optical deposition. The experimental results show that the normalized temperature sensing efficiency is ∼1.65 dB °C−1 mm−1. The high sensing efficiency of the temperature sensor we proposed benefits from the efficient coupling of the highly photothermal material MXene and the runway-type resonator structure, which provides a better idea for the preparation of all-fiber sensor devices.
1. Introduction
Optical fibers have a wide range of applications in communications, sensing, and biomedical fields.1,2 Closed-loop winding of a tapered fiber creates effective optical coupling loops and resonances so that different all-optical devices can be obtained by self-winding coupling. Currently, ring types,3,4 knot types,5–7 coil types,8 and other ring winding structure resonators have been developed. In particular, a microfiber has the property of strong evanescent field, which facilitates the coupling between the near field on the microfiber surface and the 2D material. Many devices based on near-field coupling have been applied to resonators,9,10 lasers11 and sensors.12–14 Two-dimensional (2D) materials have been introduced into the sensor field. In 2015, a groundbreaking demonstration of an all-fiber modulator was achieved, utilizing the thermo-optical effect exhibited by graphene-deposited microfibers.15 Subsequently, the exploration of alternative materials for all-fiber modulators has garnered significant attention. Notably, arsenic phosphide (ASP),16 gallium nitride (GaN)17 and silicon carbide (SiC)18,19 have emerged as promising candidates in the field of all-fiber modulator research. After that, all-optical interferometer structures and resonator structures based on 2D materials have been widely used in the sensor field. Recently, all-fiber sensor devices based on interferometer structures have limited their practical applications due to poor anti-interference ability and low sensing efficiency. Therefore, it is important to improve the efficiency sensing and environmental stability of all-fiber devices.Compared to all-fiber interferometer structures, the microfiber knot resonator (MKR) has good environmental stability. The runway type MKR provides a larger range of light-matter interaction, and its coupling with 2D materials has a wide range of prospects in the sensing field. Theoretically, the sensing efficiency of all-fiber sensor devices can be raised by decreasing the diameter of microfibers and selecting suitable 2D materials. MXene, as a type of novel 2D crystal material, has been shown to have large bandgap tunability, high thermal conductivity,20 and high photothermal conversion efficiency, which can be applied to the field of photothermal devices. In addition, a report has shown that the light-to-heat conversion efficiency of MXene can be up to 100%.21–23 Vanadium carbide (V2C) has been reported as a new MXene compound with excellent photothermal conversion efficiency and high saturation absorption.24 The potential of V2C MXene in thermal management is still at an early stage, and exploring MXene V2C-based all-optical temperature sensor devices is promising.25
In this paper, runway-type MKR based on V2C coated demonstrates normalized temperature sensing efficiency (∼1.65 dB °C−1 mm−1) by increasing the interaction length (∼0.2 mm) of light with MXene V2C. The largest the light amplitude variation ΔT versus temperature is about 0.33 dB °C−1. In addition, the optical amplitude tuning experiment is able to directly demonstrate that the sensing efficiency of the runway-type MKR-V2C is larger than bare all-fiber devices. Our proposed runway-type MKR structure will provide more possibilities for the application of 2D materials in the field of optical sensor devices. The fabrication, characterization, and experiments of all-fiber sensor devices are described in the following sections.
2. Materials and methods
2.1 Material characterization
The prepared ethanol suspensions of V2C nanosheets are dropped onto copper grids for morphology studies. The transmission electron microscopy (TEM, JEOL-F200) image of V2C nanosheets is shown in Fig. 1(a), which indicates that V2C has a thin sheet structure and a cross-section size of about two μm. Energy dispersive spectroscopy (EDS) equipped on TEM is employed to confirm the composition of the V2C nanosheets. Elemental mapping is presented in Fig. 1(c–f). Elemental mapping illustrated that a V2C nanosheet presented in Fig. 1(b) contains the elements C, V, O, and F. To further investigate the properties of the V2C nanosheets, we measured the Raman spectrum (high-resolution confocal Raman microscope, HORIBA LabRAM HR800) and showed it in Fig. 1(g). According to Fig. 1(g), characteristic peaks at 138.9, 282.9, 403.7, 519.3, 682.6, and 988.4 cm−1 can be observed in the Raman spectrum, which is derived from the vibrational modes of the terminated V2C MXene. It is known from the preview work that the peaks at ∼403.7 cm−1 are from V2C(OH)2, while the bands at ∼519.3 cm−1 and ∼682.6 cm−1 are from the out-of-plane vibrations of the V-atom model of V2CF2 and V2CO(OH), respectively.26–28 Fig. 1(h) shows the linear absorption spectrum (UV-vis absorbance spectrometer, Cary 60, Agilent) of V2C nanosheets at 300–2000 nm, which exhibit advanced optical properties in terms of broadband absorption.27 The V2C nanosheets show significant light absorption at 300 nm, 800 nm, and 1800 nm. Among them, the light absorption peak at 300 nm may be due to the electronic transition in the valence band under the multilayer nanosheets;29 the light absorption at infrared may be caused by the overlapping realization of the conduction band and valence band.30 It may also be caused by electronic transitions between discrete energy levels caused by impurity levels such as edge states or functional groups of nanomaterials.31 The broadband absorption properties of V2C nanosheets suggest that it is a promising infrared material for applications in all-fiber devices.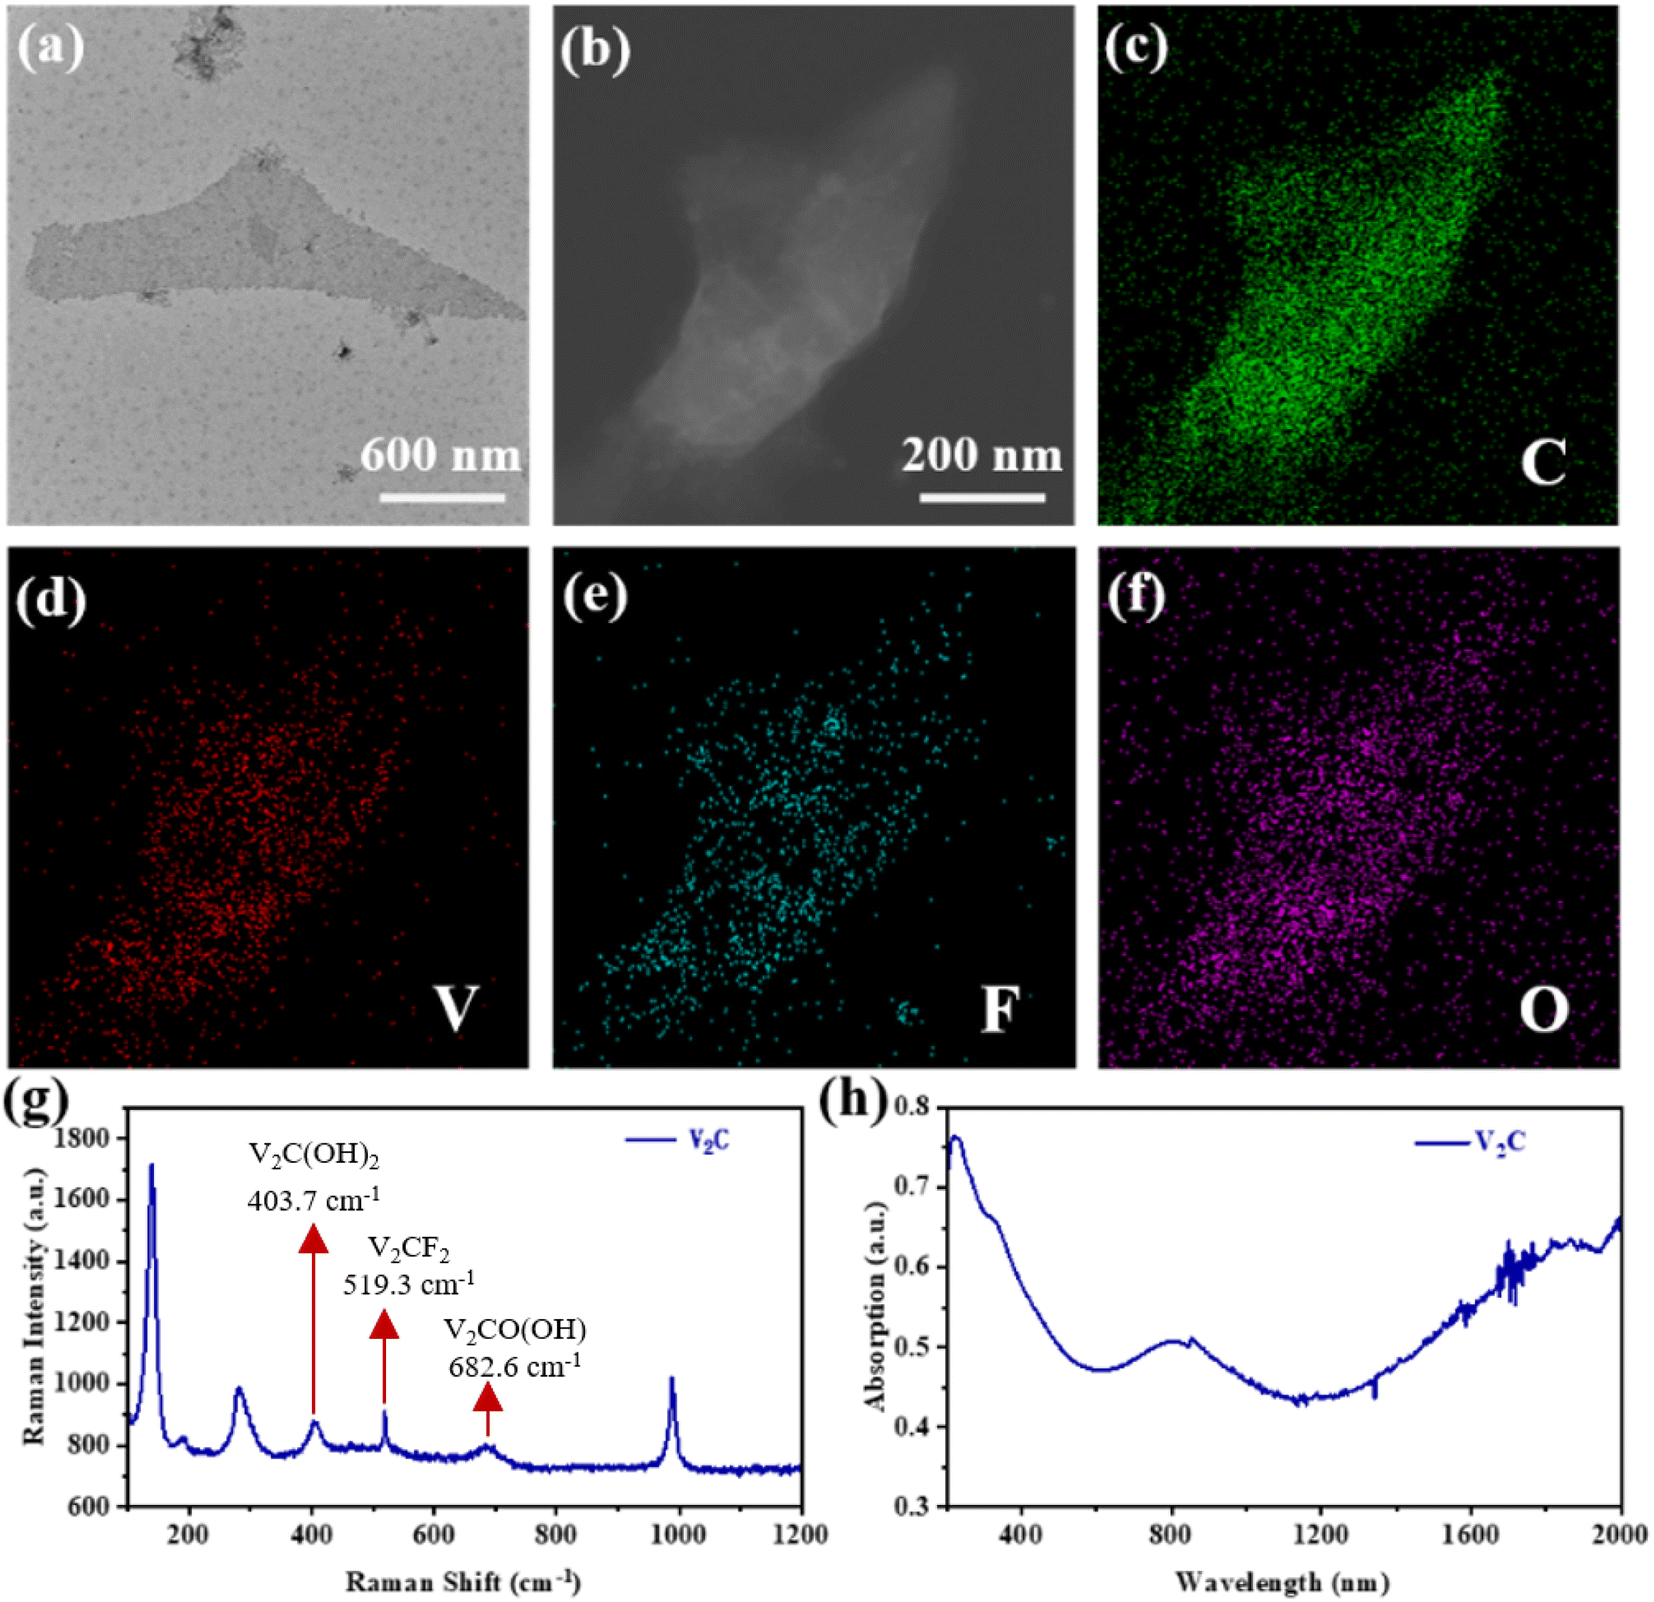 | ||
| Fig. 1 The morphology characterization of V2C MXene nanosheets. (a) TEM and (b) STEM images of MXene nanosheets. (c–f) Elemental mapping images of C, V, F, and O species on V2C MXene nanosheets. (g) The Raman spectrum. (h) The absorption spectrum of V2C nanosheets. | ||
2.2 Methods
Microfibers (∼0.1 dB preparation loss @ 1550 nm) are made by stretching single-mode fibers (Corning SMF-28) by the hot flame stretching method.32 Afterward the runway-type MKRs are prepared by knotting and their tail fibers are fixed on highly clean glass sheets.Red light excitation and measurement of the optical transmission are performed for the runway-type MKR characterization. Fig. 2(b) shows the red-light excitation images of the bare runway-type MKR (∼2.4 dB preparation loss @ 1550 nm) with a long axis diameter of ∼12 mm and a short axis diameter of ∼2 mm, and the core diameter of microfiber is ∼8.01 μm (inset in Fig. 2(b)). The transmission is subsequently measured by connecting an amplified spontaneous emission (ASE, CONQUER-OS321752) to one end of the device, the other end is connected to an optical spectrum analyzer (OSA, YOKOGAWA-AQ6307C), as shown in Fig. 2(a). Fig. 2(c) shows the measured transmission spectrum, from which we can infer that the bare runway-type MKR has a free spectral range (FSR) of ∼9.3 nm, a resonance Q of ∼793.5 @ 1560.8 nm, and a maximum extinction ratio (ER) of ∼14 dB @ 1560.8 nm.
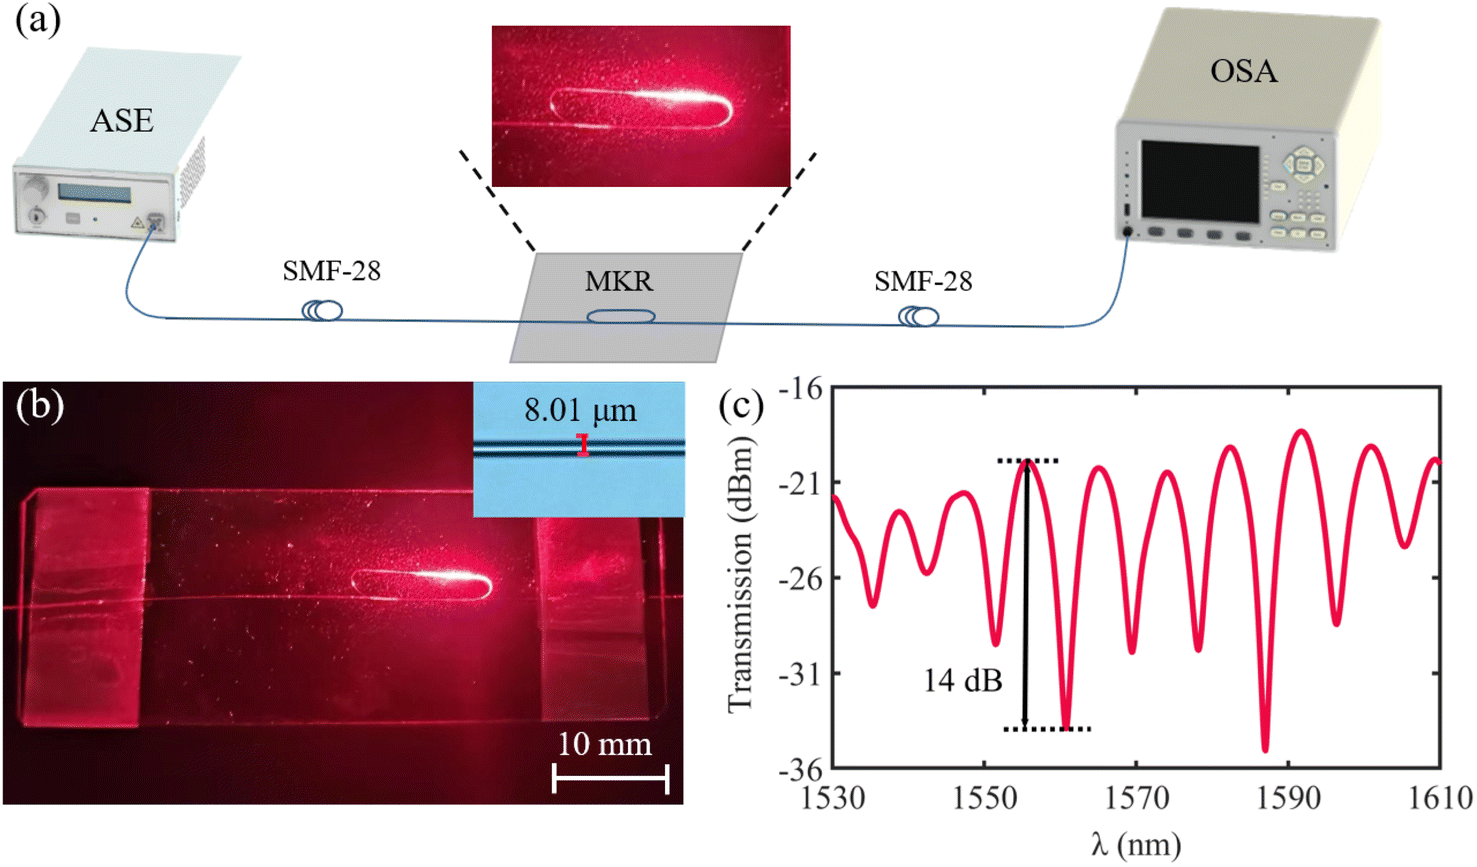 | ||
| Fig. 2 (a) Experimental set-up. (b) Microscope image and the inset shows the MF with a diameter d ≈ 8.01 μm. (c) Transmission spectra of bare runway-type MKR. | ||
Integration of MXene and runway-type MKR by optical deposition method.9–11 The sensor device is prepared by coupling between the surface near field of microfiber and MXene. The optical deposition system is shown in Fig. 2(a). ∼10–20 μL of MXene V2C dispersion is dropped onto the glass substrate until the droplets are completely transferred to the runway region of the runway-type MKR, as represented by the white arrow in Fig. 3(a). The ASE light source (output power of 80 mW) is fed into the device and MXene is adsorbed onto the microfiber surface. The microscope observes the material deposition process, and the output power decreases as more material is adsorbed (deposition loss of ∼3 dB). The reason for depositing V2C material away from the intertwisted knot is that excessive absorption of the deposited materials at the knot can cause a small fraction of the light to be recirculated into the loop. In addition, depositing materials away from the knot can reduce the increase in the loss factor of the resonator due to deposition.33 Fig. 3(a) shows the image of runway-type MXene-MKR, where a small portion of the curved region of the runway is shown using scanning electron microscopy (SEM) as illustrated in Fig. 3(b), from which we can see that the V2C nanosheets are successfully coated onto the microfiber, where the deposited length of the material is estimated to be 200 μm.
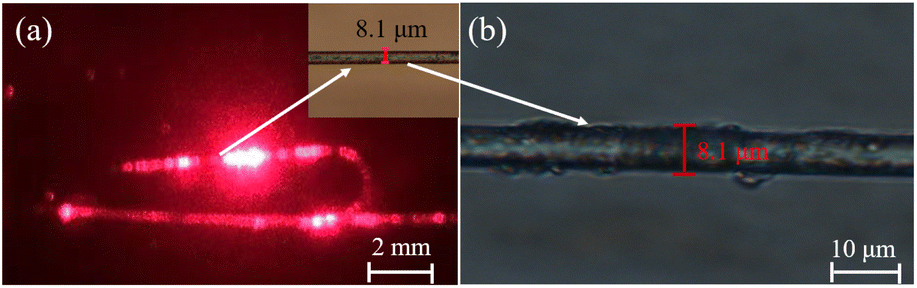 | ||
| Fig. 3 (a) Image of the runway-type MKR coated with V2C nanosheets. (b) SME image. | ||
3. Results and discussion
3.1 Experimental setup and results
This section presents the optical characterization of the bare runway-type MKR and runway-type MXene-MKR. The experimental setup for the device characterization is shown in Fig. 4(a). An ASE(CONQUER-OS321752) light source at 1550 nm is connected to one end of the sensor device, and an OSA (YOKOGAWA-AQ6307C) is connected to the other end of the device with which the sensing performance is tested. The runway-type MXene-MKR is then placed in a Vacuum drying oven (VDO). The glass sheet containing runway-type MXene-MKR is placed into a VDO. The temperature sensing characteristics are verified at 5 °C intervals over 30 °C to 70 °C.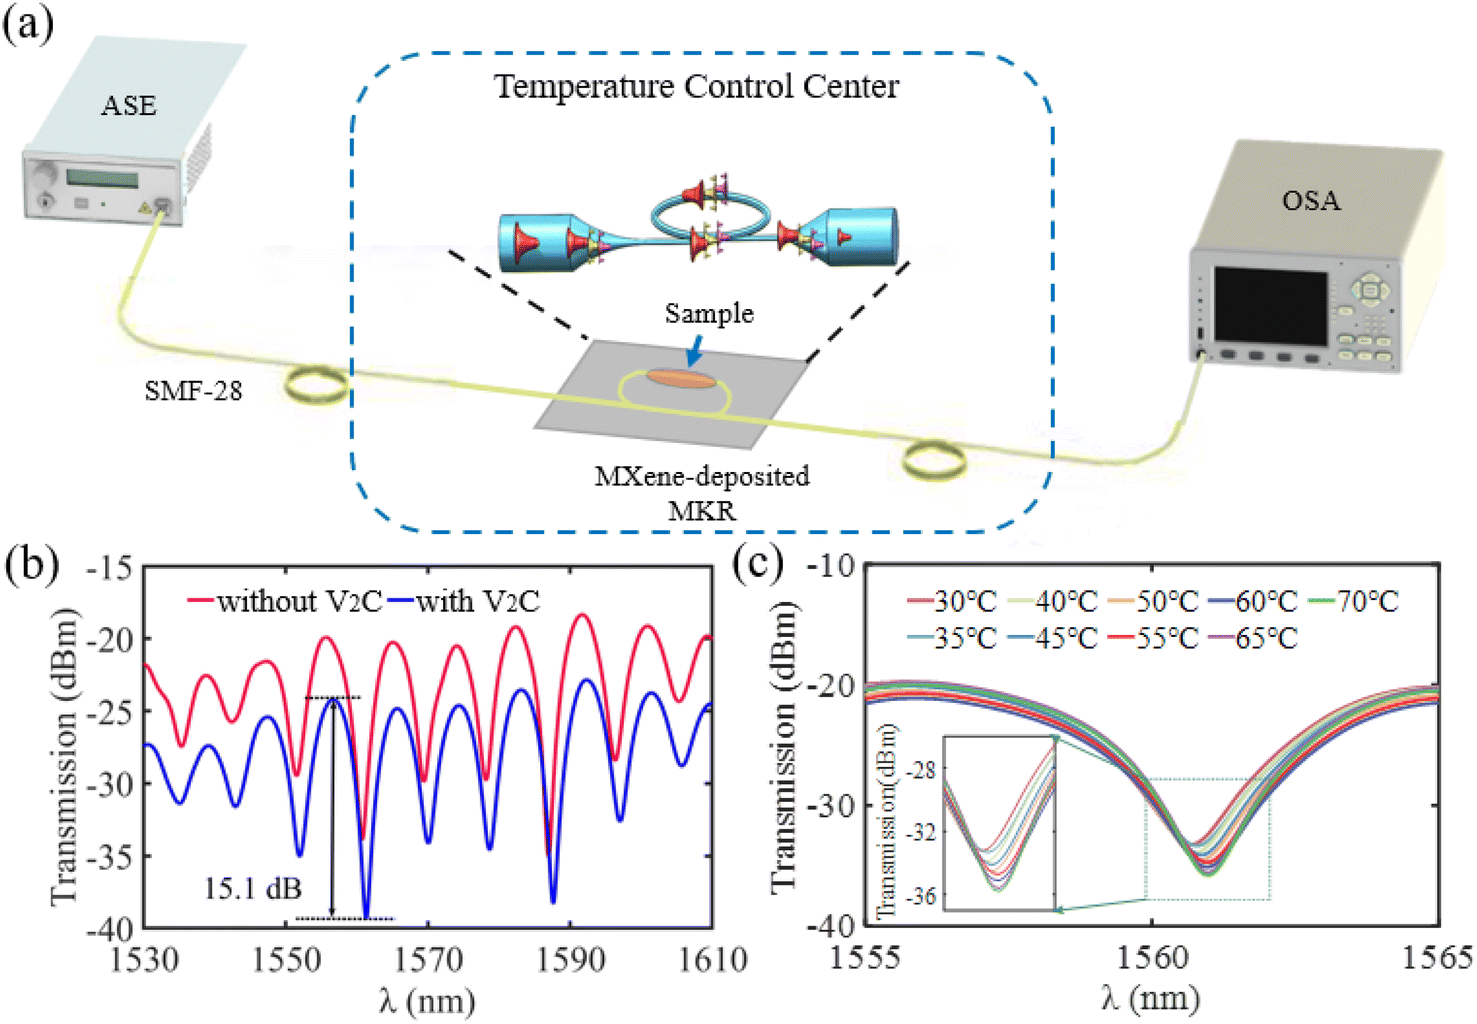 | ||
| Fig. 4 (a) Experimental set-up. (b) Transmission spectra of the runway-type MXene-MKR (blue curve) and the bare runway-type MKR (red curve). (c) Transmission spectra of bare runway-type MKR at different temperatures. | ||
Fig. 4(b) shows the transmission spectra of the bare runway-type MKR and runway-type MXene-MKR at room temperature (25 °C). There are three apparent differences between these two curves. Firstly, the transmission spectrum of runway-type MXene-MKR is smoother compared to bare runway-type MKR. The transmission curve becomes smoother after the deposition of materials with nonlinear absorption. Secondly, the overall transmission of runway-type MXene-MKR (blue curve in Fig. 4(b)) is ∼5.4 dB (increased loss by the deposition of V2C) lower than that of bare runway-type MKR (red turn in Fig. 4(b)). Thirdly, the ER of the device increased from ∼14 dB to ∼15.1 dB after deposition with V2C material. In terms of smoother curves, this suggests that only one primary resonance condition is satisfied in the runway-type MXene-MKR deposited by V2C, and other possible resonances are suppressed.24 Several resonances occurred in the bare runway-type MKR without V2C. The resonant amplitude tuning experiments are performed on the device without V2C, and the output transmission spectra are recorded when the temperature is increased from 30 °C to 70 °C @ 1561 nm in Fig. 4(c), respectively we can see that the transmitted light amplitude variation ΔT @ 1561 nm is ∼3.5 dB (Max). The results indicate that the light amplitude variation ΔT is small. The corresponding temperature sensing efficiency is 0–0.1 dB °C−1.
3.2 Discussion
The blue curve in Fig. 4(b) gives an FSR of ∼9.4 nm at the resonance wavelength λres = 1561.3 nm. The red curve in Fig. 4(b) gives an FSR of ∼9.3 nm at the resonance wavelength λres = 1560.8 nm. Light produces multiple modes when it passes from the transition zone through a non-nanoscale microfiber (micron level). In this study, for microfiber with a tapered zone diameter of ∼8.1 μm, the light should be considered to generate multiple modes when passing through, as shown the inset of the temperature control center in Fig. 4(a). The produced device is a large elliptical runway, as shown in Fig. 2(b). So, at this point, we cannot continue to extend the bit-phase difference to explain this phenomenon. This can be understood by the following analysis: the distance (l) of the multiple modes produced by the light passing through the transition zone is the same in the microfiber ring area, and the effect of Δl in eqn (1) (ref. 34) is very small and often negligible, which means that the denominator in eqn (1) is only Δneffl. And the change of the first-order, second-order, and third-order modes, when the light passes through the transition zone, will cause the refractive index to Δneff change together. However, the change in Δneff is often very small compared to the other influencing factors, so this results in a very small Δneffl, which leads to a large FSR. The larger FSR provides a better idea for the preparation of fiber optic sensor devices.
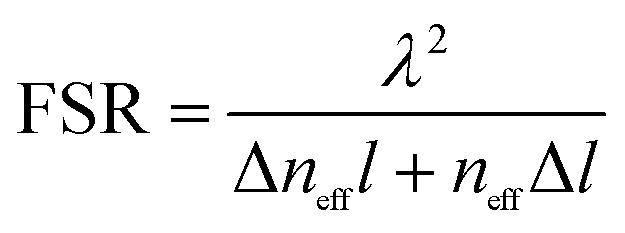 | (1) |
As shown the inset of the temperature control center in Fig. 4(a), the fundamental mode emitted to the SMF (HE11 mode) is excited in the transition region to a higher order mode (HE1n mode, is an integer and n ≥ 2), and in the ring region of the microfiber,35 the three modes will independently cycle through the ring and then produce resonance effects. The output spectrum can be described as:36
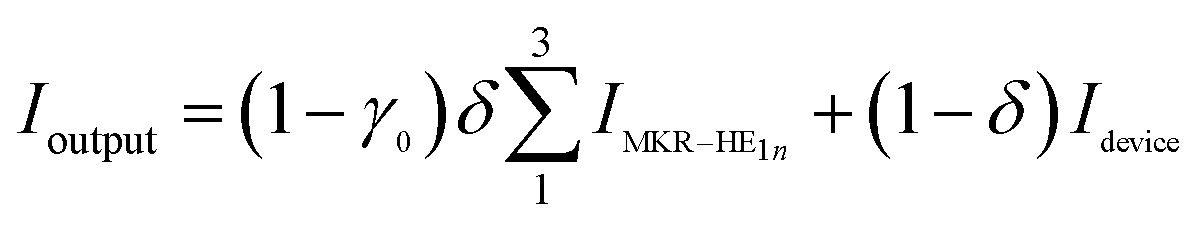 | (2) |
Analysis of the optical characterization of runway-type MXene-MKR. The runway-type MXene-MKR devices are placed into the VDO. The output spectra are recorded at nine different temperatures. As seen in Fig. 5(a) and (b), the maximum ΔT is ∼13.2 dB with approximately 1.1 nm λres shift if we perform an amplitude study at a fixed wavelength λ of 1561.8 nm @ 30–70 °C. As shown in the inset of Fig. 5(a), we can see that the ER @ 1552.4 nm decreases linearly with increasing temperature. The decrease in ER indicates that the saturation absorption of the V2C (third-order nonlinear optical properties) with increasing temperature leads to a smaller light intensity within the runway structure of the device, which results in a smaller ER at the output.9 The origin of the nonlinearity in V2C nanosheets is electrons. The nonlinear medium produces a nonlinear response in the presence of a connected ASE light source, where the atoms and charges in the medium are displaced relative to each other. The saturation absorption characteristics and the thermal conductivity mechanism correspond to the real and imaginary parts of the third-order nonlinear coefficients, which are of great importance in the integration of devices based on 2D materials.37
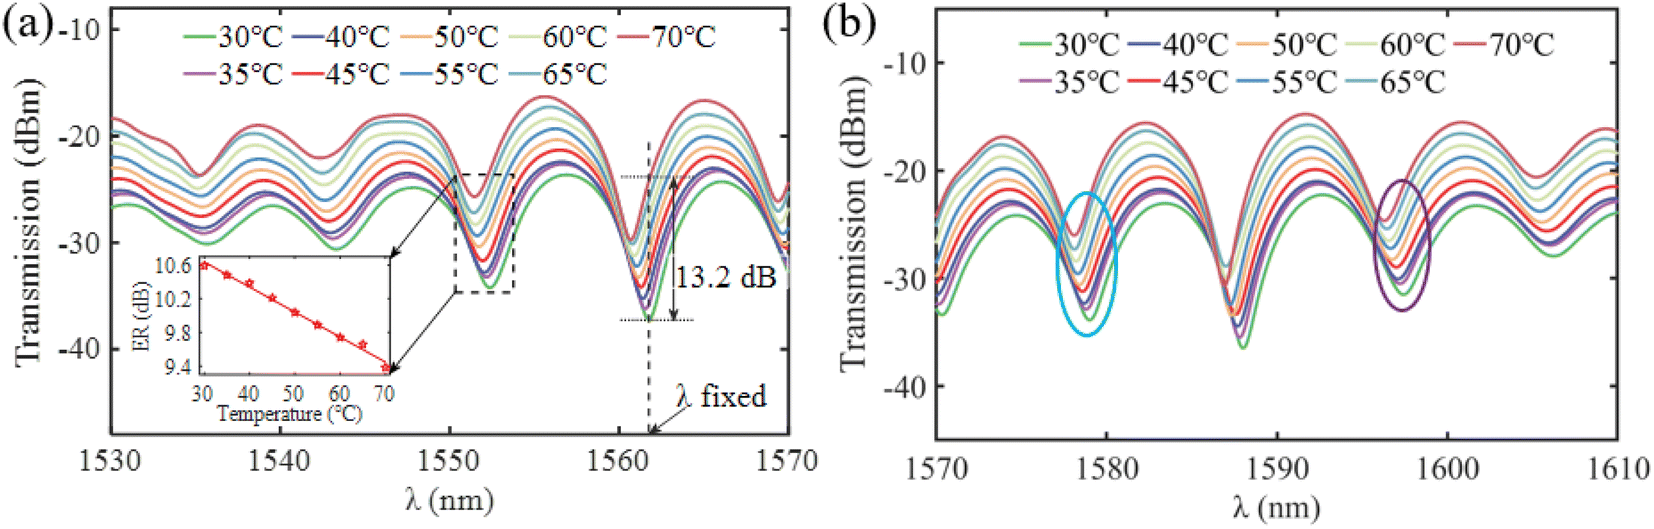 | ||
| Fig. 5 Transmission spectra of runway-type MXene-MKR. (a) @ 1530–1570 nm (b) @1570–1560 nm. | ||
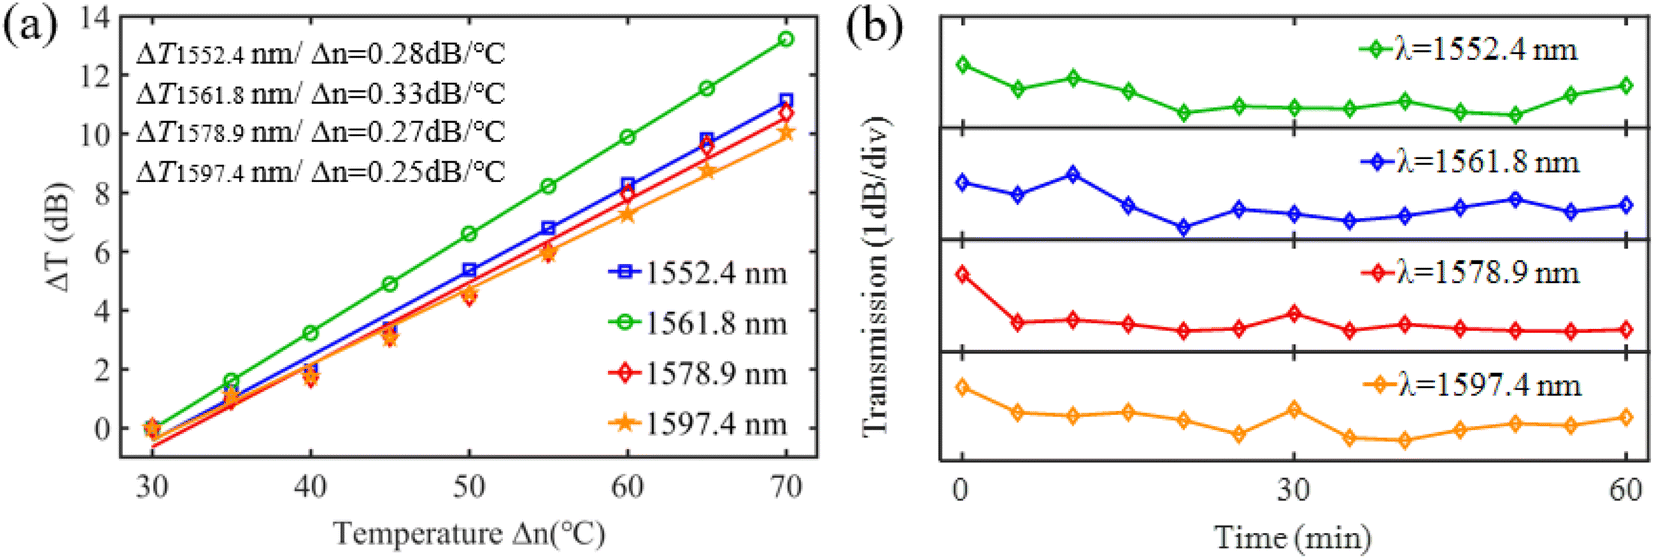
To investigate the relationship between ΔT and the resonance property in the signal light wavelength range from 1530 nm to 1610 nm, four different resonances are analyzed in detail. Correspondingly, Fig. 6(a) shows a linear fit of ΔT versus temperature for these resonances. Table 1 summarizes the resonance properties and the associated rate of change of ΔT. To verify whether the runway-type MXene-MKR structure is stable, we repeatedly scanned the output spectra at 10 min intervals for 60 min. Fig. 6(b) shows the measurement results.
 | ||
| Fig. 6 (a) Linear fit of ΔT versus temperature for four different resonances wavelengths. (b) The output spectra of the four resonance wavelengths. | ||
| λres (nm) | ER (dB) | ΔT at 70 °C (dB) | ΔT Δn−1 (dB °C−1) |
|---|---|---|---|
| 1552.4 | 10.6 | 11.2 | 0.28 |
| 1561.8 | 13.6 | 13.2 | 0.33 |
| 1578.9 | 10.4 | 10.7 | 0.27 |
| 1597.4 | 8.26 | 10.1 | 0.25 |
The maximum sensing efficiency of the runway-type MXene-MKR-based temperature sensor is ∼0.33 dB °C−1, corresponding to the green curve with the highest slope in Fig. 6(a). It is obtained at ∼1561.8 nm, which corresponding to a resonance with the largest ER (∼13.6 dB), as shown in the second row of Table 1. The material deposition length is ∼0.2 mm, and the normalized temperature sensing efficiency is defined as the sensing efficiency per unit length, and the sensing efficiency obtained in this experiment is ∼1.65 dB °C−1 mm−1. The second largest sensing efficiency of the runway-type MXene-MKR-based temperature sensor is 0.28 dB °C−1 (blue curve in Fig. 6(a)), which corresponds to a resonance with a smaller ER (∼10.6 dB) at λres of 1552.4 nm, as shown in the first row of Table 1. Table 1 (last two rows) and the light blue and purple ellipses in Fig. 5(b) show the two wavelengths at which the resonance characteristics change. The above shows that resonances with greater ER can lead to higher sensing efficiency in the rate of change of the resonance characteristics. This can be interpreted that resonances with an ER will store a lot of light energy inside the structure, thus enhancing the light-matter interaction. The enhanced light-matter interaction will lead to higher sensing efficiency in the rate of change of resonance properties relative to the external stimulus. Strictly speaking, the ratio of the wavelength of the resonance peak to the full wave at half maximum (FWHM) is a measure of the Q factor only if the FWHM is much smaller than the FSR.38 We deviate from this condition by using this ratio to measure the Q factor, which results in a relatively small Q factor. Fig. 6(b) shows the measurement results, in which we do not observe significant intensity fluctuations. The intensity variations of the output spectra at four wavelengths from 0 to 60 min are analyzed separately for a more explicit representation. From the measured data, the corresponding intensity fluctuations at all four wavelengths are less than 0.5 dB, much smaller than the intensity variations at fixed wavelengths due to temperature variations. This shows that the structure has excellent stability.
Table 2 shows the performance of different types of all-optical device temperature sensor structures. Regarding sensing efficiency, the sensor device demonstrated in this paper outperforms the other configurations. Combining the advantages of an all-fiber device and V2C MXene, the obtained sensing efficiency in our all-optical sensor is higher than other Refs @ normalized temperature sensing efficiency.
4. Conclusion
In summary, we have demonstrated that an all-optical device with high sensing efficiency can be achieved by depositing runway-type MKR with MXene V2C nanosheets. A maximum normalized temperature sensing efficiency of 1.65 dB °C−1 mm−1 is obtained in runway-type MKR coated with V2C. The maximum sensing efficiency (∼0.33 dB °C−1) of the runway-type MXene-MKR is ∼2.7 times higher than bare runway-type MKR (∼0.09 dB °C−1). Our proposed all-fiber sensor device uses a runway structure which greatly increases the interaction length of light with the 2D material and thus increases the sensing efficiency of the sensor.Conflicts of interest
There are no conflicts to declare.Acknowledgements
This research was funded by the National Natural Science Foundation of China (62205091, 61965002), the China Postdoctoral Science Foundation Funded Project (2022M710983) and Heilongjiang Postdoctoral Foundation (LBH-Z22201). Supported by the Fundamental Research Foundation for Universities of Heilongjiang Province (2022-KYYWF-0121), the Science and Technology Project of Jiangxi Province Department of Education (GJJ180752) and the Natural Science Foundation of Jiangxi Province (20202BABL201022).References
- Q. Wu, S. Chen, L. X. Guan and H. B. Wu, Nanomaterials, 2022, 12, 766 CrossRef CAS PubMed
.
- Q. Wu, M. Zhang, Y. Wang, W. Huang, Z. Zheng and H. Zhang, 2020 Conference on Lasers and Electro-Optics (CLEO), 2020, pp. 1–2 Search PubMed
- Z. Xu, Y. Luo, Q. Sun, C. Mou, Y. Li, P. P. Shum and D. Liu, Optica, 2017, 4, 945–950 CrossRef CAS
- R. Ahmed, A. A. Rifat, A. K. Yetisen, M. S. Salem, S. H. Yun and H. Butt, RSC Adv., 2016, 6, 56127–56133 RSC
- Q. Wu, W. Huang, Y. Wang, C. Wang, Z. Zheng, H. Chen, M. Zhang and H. Zhang, Adv. Opt. Mater., 2020, 8, 1900977 CrossRef CAS
- Q. Wu, Y. Wang, W. Huang, C. Wang, Z. Zheng, M. Zhang and H. Zhang, Photonics Res., 2020, 8, 1140–1147 CrossRef CAS
- Y. Z. Wang, Q. Wu, H. D. Wang, J. F. Liu, Z. Zheng, M. Zhang and H. Zhang, Chin. Opt. Lett., 2021, 19, 051301 CrossRef
- Y. Yin, J. B. Yu, Y. X. Jiang, S. Li, J. Ren, G. Farrell, E. Lewis and P. F. Wang, J. Lightwave Technol., 2018, 36, 4887–4893 CAS
- Q. Wu, W. C. Huang, Y. Z. Wang, C. Wang, Z. Zheng, H. Chen, M. Zhang and H. Zhang, Adv. Opt. Mater., 2020, 8, 1900977 CrossRef CAS
- Q. Wu, Y. Z. Wang, W. C. Huang, C. Wang, Z. Zheng, M. Zhang and H. Zhang, Photonics Res., 2020, 8, 1140–1147 CrossRef CAS
- Q. Wu, X. Jin, S. Chen, X. Jiang, Y. Hu, Q. Jiang, L. Wu, J. Li, Z. Zheng, M. Zhang and H. Zhang, Opt. Express, 2019, 27, 10159–10170 CrossRef CAS PubMed
- Y. Gogotsi and B. Anasori, ACS Nano, 2019, 13, 8491–8494 CrossRef CAS PubMed
- L. Zhang, Y. Tang and L. M. Tong, iScience, 2020, 23, 100810 CrossRef PubMed
- Q. Wu, S. Chen, L. Guan and H. Wu, Nanomaterials, 2022, 12, 766 CrossRef CAS PubMed
- X. Gan, C. Zhao, Y. Wang, D. Mao, L. Fang, L. Han and J. Zhao, Optica, 2015, 2, 468 CrossRef CAS
- M. Q. Xie, S. L. Zhang, B. Cai, Y. Huang, Y. S. Zou, B. Guo, Y. Gu and H. B. Zeng, Nano Energy, 2016, 28, 433–439 CrossRef CAS
- K. Du, Z. H. Xiong, L. Ao and L. L. Chen, Vacuum, 2021, 185, 110008 CrossRef CAS
- M. Y. Sun, Y. Z. Li, X. X. Yu, W. K. Liu, S. S. Kong, P. Gong and X. Y. Fang, Eur. Phys. J. B, 2022, 95, 142 CrossRef CAS
- Y. Z. Li, M. Y. Sun, X. X. Yu, W. K. Liu, S. S. Kong, Y. L. Li and X. Y. Fang, Eur. Phys. J. Plus, 2022, 137, 995 CrossRef CAS
- E. Balci, U. O. Akkus and S. Berber, J. Mater. Chem. C, 2017, 5, 5956–5961 RSC
- R. Y. Li, L. B. Zhang, L. Shi and P. Wang, ACS Nano, 2017, 11, 3752–3759 CrossRef CAS PubMed
- Q. Wu, L. Tan, X. M. Liu, Z. Y. Li, Y. Zhang, Y. F. Zheng, Y. Q. Liang, Z. D. Cui, S. L. Zhu and S. L. Wu, Appl. Catal., B, 2021, 297, 120500 CrossRef CAS
- B. Yang, P. F. Tang, C. J. Liu, R. Li, X. D. Li, J. Chen, Z. Q. Qiao, H. P. Zhang and G. C. Yang, Def. Technol., 2022, 18, 834–842 CrossRef
- W. C. Huang, C. Y. Ma, C. Li, Y. Zhang, L. P. Hu, T. T. Chen, Y. F. Tang, J. F. Ju and H. Zhang, Nanophotonics, 2020, 9, 2577–2585 CrossRef CAS
- H. Ahmad, A. A. Kamely, M. K. A. Zaini, M. Z. Samion, W. Y. Chong, A. K. Zamzuri and K. S. Lim, Opt. Laser Technol., 2022, 145, 107458 CrossRef CAS
- E. Ghasali, Y. Orooji, A. Azarniya, M. Alizadeh, M. Kazem-zad and T. Ebadzadeh, Appl. Surf. Sci., 2021, 542, 148538 CrossRef CAS
- A. Champagne, L. Shi, T. Ouisse, B. Hackens and J. C. Charlier, Phys. Rev. B, 2018, 97, 115439 CrossRef CAS
- Y. F. Guan, S. Jiang, Y. Cong, J. P. Wang, Z. J. Dong, Q. Zhang, G. M. Yuan, Y. J. Li and X. K. Li, 2D Mater., 2020, 7, 025010 CrossRef CAS
- W. K. Liu, S. S. Kong, X. X. Yu, Y. L. Li, L. Z. Yang, Y. Ma and X. Y. Fang, Mater. Today Commun., 2023, 34, 105030 CrossRef CAS
- M. M. Dong, G. P. Zhang, Z. Q. Wang, Z. L. Li, M. L. Wang, C. K. Wang and X. X. Fu, Nanotechnology, 2020, 31, 225705 CrossRef CAS PubMed
- Y. H. Jia, P. Gong, S. L. Li, W. D. Ma, X. Y. Fang, Y. Y. Yang and M. S. Cao, Phys. Lett. A, 2020, 384, 126106 CrossRef CAS
- L. M. Tong, F. Zi, X. Guo and J. Y. Lou, Opt. Commun., 2012, 285, 4641–4647 CrossRef CAS
- K. S. Lim, A. A. Jasim, S. S. A. Damanhuri, S. W. Harun, B. M. A. Rahman and H. Ahmad, Appl. Opt., 2011, 50, 5912–5916 CrossRef PubMed
- M. Q. Wang, D. Li, R. D. Wang, J. W. Zhu and Z. Y. Ren, Opt. Quantum Electron., 2018, 50, 132 CrossRef
- M. C. Frawley, A. Petcu-Colan, V. G. Truong and S. N. Chormaic, Opt. Commun., 2012, 285, 4648–4654 CrossRef CAS
- A. D. D. Le and Y. G. Han, J. Lightwave Technol., 2018, 36, 904–909 CAS
- M. Zhang, Q. Wu, H. L. Chen, Z. Zheng and H. Zhang, 2D Mater., 2021, 8, 012003 CrossRef CAS
- J. Haas, P. Artmann and B. Mizaikoff, RSC Adv., 2019, 9, 8594–8599 RSC
- X. Sun, Q. Sun, W. Jia, Z. Xu, J. Wo, D. Liu and L. Zhang, Fiber-Based Technologies and Applications, FBTA 2014, 2014 Search PubMed
- N. Diaz-Herrera, M. C. Navarrete, O. Esteban and A. Gonzalez-Cano, Meas. Sci. Technol., 2004, 15, 353–358 CrossRef CAS
- H. H. Lu, Z. W. Tian, H. P. Yu, B. Yang, G. Y. Jing, G. Z. Liao, J. Zhang, J. H. Yu, J. Y. Tang, Y. H. Luo and Z. Chen, Opt. Express, 2014, 22, 32502–32508 CrossRef CAS PubMed
- Q. Z. Sun, X. H. Sun, W. H. Jia, Z. L. Xu, H. P. Luo, D. M. Liu and L. Zhang, IEEE Photonics Technol. Lett., 2016, 28, 383–386 CAS
- J. Zhang, G. Z. Liao, S. S. Jin, D. Cao, Q. S. Wei, H. H. Lu, J. H. Yu, X. Cai, S. Z. Tan, Y. Xiao, J. Y. Tang, Y. H. Luo and Z. Chen, Laser Phys. Lett., 2014, 11, 035901 CrossRef CAS
| This journal is © The Royal Society of Chemistry 2023 |