
 Open Access Article
 This Open Access Article is licensed under a Creative Commons Attribution-Non Commercial 3.0 Unported Licence
Green synthesis of copper oxide nanoparticles using Ficus elastica extract for the electrochemical simultaneous detection of Cd2+, Pb2+, and Hg2+†
Djihane Slimane Ben Aliab,
Ferial Kridac,
Mouna Nacef *d,
El Hadi Boussahaa,
Mohamed Lyamine Chelaghmiad,
Habiba Tabetc,
Radia Selaimiad,
Amira Atamniaab and
Abed Mohamed Affouned
*d,
El Hadi Boussahaa,
Mohamed Lyamine Chelaghmiad,
Habiba Tabetc,
Radia Selaimiad,
Amira Atamniaab and
Abed Mohamed Affouned
aDepartment of Process Engineering, Faculty of Technology, Université 20 Août 1955, El Hadaik Road, Skikda 21000, Algeria
bLRPCSI-Laboratoire de Recherche sur la Physico-Chimie des Surfaces et Interfaces, Université 20 Août 1955, Skikda 21000, Algeria
cChemical and Environmental Engineering Research Laboratory, LGCE, Algeria
dLaboratoire d'Analyses Industrielles et Génie des Matériaux, Université 8 Mai 1945 Guelma, BP 401, Guelma 24000, Algeria
First published on 20th June 2023
Abstract
In this paper, for the first time, we report the use of a new carbon paste electrode based on a low-cost pencil graphite powder modified with polyaniline (PANI) and green synthesized copper oxide nanoparticles using Ficus elastica extract as a sensor for Cd2+, Pb2+, and Hg2+. The elaborated electrode was characterized by FT-IR spectroscopy, field-emission gun scanning electron microscopy (FEG-SEM), energy-dispersive X-ray spectroscopy (EDX), X-ray diffraction (XRD), and simultaneous thermal analysis (TGA/DSC). The electrochemical behavior of the sensor was evaluated using cyclic voltammetry (CV) and electrochemical impedance spectroscopy techniques. According to CV, as well as square wave voltammetry (SWV) results, it was found that the CuONPs/PANI–CPE sensor was able to determine very low concentrations of Cd2+, Pb2+, and Hg2+ in HCl (0.01 M) either in single metal or in multi-metal solutions with a high sensitivity. Furthermore, Cd2+, Pb2+, and Hg2+ simultaneous detection on CuONPs/PANI–CPE achieved very low limits of detection (0.11, 0.16, and 0.07 μg L−1, respectively). Besides, the designed sensor displayed a good selectivity, reproducibility, and stability. Moreover, CuONPs/PANI–CPE enabled us to determine with high accuracy Cd2+, Pb2+, and Hg2+ traces in environmental matrices.
1. Introduction
Aquatic ecosystem health is heavily dependent upon water quality. The accumulation of inorganic contaminants such as heavy metals in different surface waters affects many aquatic animals, especially fish.1,2 In the recent decades, industrial liquid wastes have caused many environmental concerns.3,4 This is particularly true in developing countries where, urban wastewater spills charged with harmful heavy metals are transferred in a risky manner and without initial processing into the rivers. In many situations, these pollutants can be carried into groundwater, thus worsening the problem.These heavy metals, not only cannot degrade naturally, but are also extremely toxic to living organisms. Their capacity to accumulate in living organisms impacts ultimately humans. In fact, humans are at the top of the food chain and are the most vulnerable groups to the bioaccumulation phenomenon.5 Among heavy metals, mercury, cadmium and lead are the most dangerous pollutants and have been the subject of an increasing number of related papers, Fig. S1.†
Three main types of mercury from various sources are distinguished: methylmercury (MeHg), which is typically found in fish consumption, mercury vapor (Hg0), which can be inhaled, mercury present in dental amalgams (Hg0), and ethylmercury (C2H5Hg+), which is produced by the ingestion of certain mercury-containing vaccines.6 The harmful effects of mercury on human health and organs, are really concerning. Mercury can induce renal insufficiency, cerebral lesions, and various problems with movement.7
On the other hand, lead is one of the most widely distributed heavy metals, which is regarded as a serious danger to the environment. Consequently, Pb2+ ions can be very damaging to the cardiovascular, neurological, and renal organs because they easily accumulate in both human and animal bodies owing to their non-biodegradable nature.8,9 Another heavy metal, listed as a highly toxic carcinogenic, is cadmium. It is a strong respiratory and gastrointestinal irritant that can be harmful if consumed or inhaled.10 Depending on the route of intoxication, cadmium poisoning can also result in an erosion of the gastrointestinal system, and lesions of the lungs, liver, or kidneys. Despite the fact that the mechanisms underlying cadmium's toxicity are poorly understood, it has been postulated that cadmium harms cells primarily through the production of reactive oxygen species,11 which damages ADN and interferes with the synthesis of nucleic acids and proteins.12 To effectively confront these environmental and health problems, it is becoming necessary to develop reliable monitoring tools that are sensitive and precise.
Until now, spectrometric techniques are the most frequently used for trace metal analysis such as atomic absorption spectroscopy and inductively coupled plasma mass spectrometry.13,14 Notwithstanding their accuracy and reliability, these methods are typically less accepted due to their complexity, reliance on time, and high test costs.15 In addition, a qualified staff is needed to carry out the measures.
In this context, the use of electrochemical sensors is unanimously accepted as an effective alternative to traditional methods for determining the presence of multiple analytes with comparable performances to spectrometric methods, such as reasonable accuracy, simplicity, low cost, and improved selectivity. But the most sought feature is, as developed by some researcher's teams16,17 the fast individual and simultaneous determination of heavy metals. Furthermore, electrochemical methods allow the identification and determination of these chemical components in real samples, leading to an improved protection of the environment.18
The working electrodes, used as sensors, are often made of conducting materials with polarization-related properties over a wide range of potential.19 In this context, the electrode material should be non-toxic, chemically inert, and mechanically robust.20 However, in several studies, the developed electrodes imply expensive materials such as noble materials,21 glassy carbon electrode,22 and nanocarbons.23
Pencil graphite electrode utilization for the detection of trace heavy metals is now the subject of a dramatic increase in research activity.24–33 These electrodes are quite interesting since they are actually inexpensive.24 In addition, they have excellent mechanical rigidity, wide potential window, and a high percentage of graphite. As electrode, bare pencil graphite was rarely used without modification since its performances could be tremendously improved by the addition of a conductive polymer or metallic species in nano or micrometer level.25
Consequently, carbon paste electrode appears as the most appropriate electrode since it is easily tailored to design the desired electrode with the contribution of each compound. Conductive polymers, such as PANI, polypyrrole (PPy), polythiophene (PTH), and their derivatives, have a wide range of applications, including sensors,33,34 and corrosion protection.35 Polymerization is usually carried out by in situ polymerization method that is not good for the environment.36 So, numerous attempts have been made to create synthetic materials using plant extracts in an environmentally-friendly manner.37–41 In fact, many organic compounds found in plant tissues, like polyphenols, tannins, terpenoids, flavonoids, and alkaloids, were employed as reducing agents and catalysts in nanoparticles synthesis.42–44 Aisha et al. have found that (PANI)-/green-synthesized silver-nanoparticle-modified carbon paste electrodes has excellent selectivity in lead sensing in waste and tap water samples with a detection limit of 0.04 μM of Pb2+.45 In another research, Eu3+ doped NiO modified carbon paste electrode has enabled Pb2+ and Cd2+ electrochemical detection with a limit of detection (LOD) around 0.1 and 0.4 μg L−1 for Pb2+ and Cd2+, respectively.46 Recently, lanthanide-functionalized MOF and nanocomposite of poly(aniline boronic acid)/gum tragacanth stabilized silver nanoparticles (PABA/GT@AgNPs) gave low limits of detection (2.6 and 0.85 nM, respectively) for Hg2+.47,48
These studies and some others have highlighted the synergetic effect of conducting polymers and metallic nanoparticles which makes them a suitable option for increasing electrode surface area and conductivity.
In this research, we developed a new electrochemical sensor for simultaneous determination of Cd2+, Pb2+, and Hg2+ using square wave voltammetry (SWV) and cyclic voltammetry (CV) with high sensitivity and low detection limit.
For the first time, we report the use of a new carbon paste electrode based on low-cost pencil graphite powder modified with PANI and green synthesized copper nanoparticles using Ficus elastica extract.
2. Experimental
2.1. Chemicals and reagents
Copper(II) sulfate pentahydrate (CuSO4·5H2O) was purchased from Sigma-Aldrich, hydrochloric acid HCl was purchased from Fluka and paraffin oil from PROCHIMA-SIGMA. Lead nitrate Pb(NO3)2, mercury(II) sulfate (HgSO4), and cadmium chloride hemi(pentahydrate) (CdCl2·2.5H2O) were provided by (BIOCHEM Chemopharma). A stock solutions of Cd2+, Pb2+, and Hg2+ with a concentration of 1000 mg L−1 were prepared by dissolving their salts in distilled water. Aniline, ammonium persulfate (APS), chloroform, and all other chemicals are provided by (BIOCHEM Chemopharma). Ficus elastica leaves were collected in Skikda university campus green spaces. A Rotring pencil graphite B grade was bought in a local library.2.2. Apparatus and measurements
The elaborated electrode was characterized by FT-IR spectroscopy using a PerkinElmer spectrometer with compact KBr pellets (4000–400 cm−1). The surface morphological characteristics of the electrode materials were analyzed using field-emission gun scanning electron microscopy (FEG-SEM) (Quattro S) accompanied by the determination of the elemental composition using an energy-dispersive X-ray spectroscopy (EDX). The microstructural and structural characteristics of the materials were evaluated using the X-rays diffraction (Bragg–Brentano). The thermal stability was assessed using a simultaneous thermal analyzer (TGA/DSC): TGA/DTG 3 + 1600 °C, Mettler Toledo. All electrochemical measurements were performed using either a potentiostat/galvanostat 273A (Princeton Applied Research) or a VersaSTAT 3 potentiostat/galvanostat (Princeton Applied Research, AMETEK, USA). This latter was especially used to perform electrochemical impedance spectroscopy (EIS). Both electrochemical apparatus were connected to a typical three-electrode system made up of a platinum wire as the counter electrode, a Ag/AgCl (saturated KCl) reference electrode, and the modified carbon pastes as the working electrodes. All potentials were quoted in respect to the Ag/AgCl (saturated KCl) reference electrode.2.3. Green synthesis of copper oxide nanoparticles (CuONPs)
Ficus elastica plant was obtained by the reflux method in distilled water according to the following procedure: the freshly harvested Ficus plant was washed and allowed to dry in the open air for 15 days. Then, it was finely grounded using an electric grinder. The extract was prepared by boiling 20 g of dry leaves in 200 mL of distilled water. After that, the mixture was left to macerate overnight and separated by vacuum filtration. The filtrate was then stored in a tightly closed amber glass bottle. The extract was used as a reducing solution.Copper oxide nanoparticles were prepared by adding 20 mL of the extract solution into 100 mL sulfate copper solution (CuSO4·5H2O; 0.1 M) under continuous stirring until the initially clear solution becomes instantly cloudy, revealing the beginning of the formation of copper oxide metal nanoparticles (CuONPs). The stirring was maintained for 24 hours in order to achieve the a complete transformation of copper ions into copper oxide nanoparticles. The obtained CuONPs were purified by centrifugation at 10![[thin space (1/6-em)]](https://www.rsc.org/images/entities/char_2009.gif) 000 rpm for 10 min,49 washed thoroughly with distilled water and dried in an oven at 70 °C for 24 hours to obtain a metallic powder appearance.
000 rpm for 10 min,49 washed thoroughly with distilled water and dried in an oven at 70 °C for 24 hours to obtain a metallic powder appearance.
The obtained nanoparticles material (5.0 mg) was stirred continuously with 5 mL of chloroform to create a suspension with a concentration of 1.0 mg mL−1. Then, the suspension was kept in a tightly closed bottle until use in the electrode modification.45
2.4. PANI synthesis
Two solutions were prepared: in the first one (s1), aniline monomer was dissolved in 100 mL of chloroform to obtain a concentration of 0.32 M. The second solution (s2) was made by dissolving 0.8 M APS in 100 mL HCl; 1 M. Dropwise addition of s2 into s1 was done with caution and left for a moment. After that, polyaniline was produced at the two immiscible solution separation. It was a layer of a green polymer. After 24 hours, the greenish-black color of the formed polymer was further intensified (Scheme 1). Finally, the solid polymer layer was filtered and allowed to dry at room temperature.45 | ||
| Scheme 1 Preparation process of PANI. | ||
2.5. Fabrication of CuONPs/PANI–CPE
The carbon paste electrode was obtained by manually combining 0.1 g PANI with 0.90 g finely grounded pencil graphite powder in a ceramic mortar. Ten drops of paraffin oil were then added to the mixture and well homogenized for at least 20 min till a smoothly wetted and suitably firm paste texture was achieved. The paste was filled and packed in a glass cylinder with 9 mm of diameter and 60 mm of length. A copper wire was sealed to a plunger that was in close contact with the paste and extended to the outside of the cylinder to ensure electrical contact. At this stage, the electrode was labeled as CPE. Using the same procedure, the bare CPE was combined with PANI, the electrode was labeled as PANI–CPE. When the electrode surface was coated with a 5 μL CuONPs suspension and then allowed to air dry at ambient temperature, the electrode was labeled as CuONPs/CPE. In order to renew the electrode surface, the carbon paste was rubbed on white sheet paper until it looked shiny.3. Results and discussion
3.1. Material characterization
The morphological characteristics of the prepared electrode is depicted in Fig. 1. Carbon paste electrode elaborated by the addition of paraffin oil exhibited a broadly smooth homogeneous surface, Fig. 1A. While PANI incorporation to the CPE roughen the surface, Fig. 1C. In fact, the synthesized PANI has a sea sponge-like structure with large pores and have a small rod-shaped particles with around 41 nm of diameter, as reported by previously published papers,50,51 Fig. 1B. Roughened surface has an important contribution in increasing charge transfer and enhancing the electrode material conductivity.45,50,52 According to FEG-SEM images in inset of Fig. 1D, the prepared CuONPs was made up of flower-like agglomerates of a size between 20 and 107 nm. The slight agglomeration of the synthesized nanoparticles may be attributed to the use of biological components during the synthetic process. This is in agreement with some recent studies.49–53 The EDX spectrum of CuONPs has confirmed that Cu and O are the only components of this material, Fig. 1D. The strong sulfide peak may be attributed to sulfate from copper(II) sulfate pentahydrate (CuSO4·5H2O) used for CuONPs synthesis. | ||
| Fig. 1 FEG-SEM images of: (A) carbon paste electrode (CPE), (B) polyaniline (PANI), (C) a mixture of PANI and CPE, and (D) EDX patterns for CuONPs. Inset: FEG-SEM images of green synthesized CuONPs and elemental analysis weight and atomic ratios extracted from EDX patterns. | ||
The thermal stability and thermal degradation of PANI were investigated using thermogravimetric analysis, Fig. 2B. PANI suffers four main stages of heat deterioration. The first weight loss from 23.05 °C up to 144.90 °C is mostly brought on by the PANI solvent and moisture evaporating. The second stage of weight loss from 144.90 to 305.93 °C is related to the loss of low molecular weight oligomers. Most likely, the evaporation of doping ions and the oxidation of the organic groups in the polymer is to blame for the significant weight loss between 305.93 °C and 766.81 °C. After 766.81 °C. Weight loss reaches its last stage and intensifies after 966.75 °C due to the gradual decomposition of the polymer chain. PANI still retains 26% of its weight at temperatures 1162 °C.
 | ||
| Fig. 2 (A) DSC curve of PANI, (B) TGA analysis of PANI. | ||
In the DSC curve, Fig. 2A, three endotherms can be seen, which represent the sample's highest weight loss. The initial weight loss at 105 °C is primarily caused by the sample's absorption of moisture. The second endothermic peak at roughly 305 °C results from the loss of low molecular weight oligomers. The weight loss caused by significant breakdown of the polymer units is represented by the final endotherm at 870 °C.52
For better understanding of the surface structure, X-ray diffraction patterns of CPE and CuONPs were also recorded.
Fig. 3A displays the XRD spectra of CuO nanoparticles. Which shows different peaks at 38.94°, 50.02°, 56.54°, 58.39°, and 64.12° related to the (1 1 1), (−2 0 2), (0 2 0), (2 0 2), and (1 1 3) planes of CuO, respectively.49 Instead the waited crystal structure of copper oxide, the spectrum reveals an amorphous character which can be attributed to the fixation of NPs on the plant biomass. These observations were reported by S. Yallappa et al. when they synthesized copper nanoparticles from the bark extract of Terminalia arjuna.54 In another hand, the peak at angular position 26.66°, Fig. 3B, corresponds to (0 0 2) cubic crystal face structure of graphite carbon.
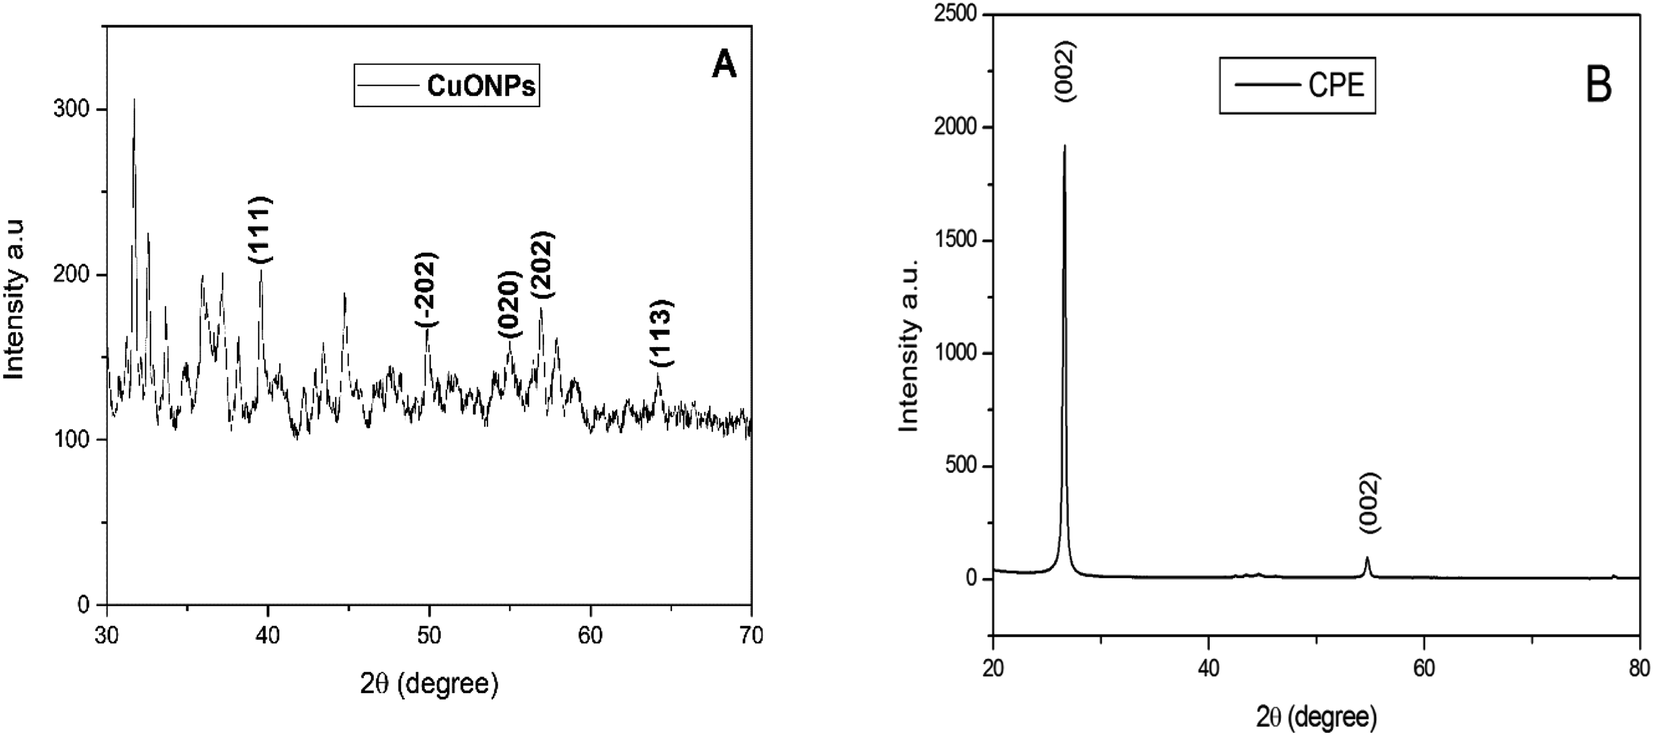 | ||
| Fig. 3 XRD patterns of the prepared: CuONPs; (A) and CPE; (B). | ||
Fourier transform infrared spectroscopy was carried out for PANI, Ficus elastica plant extract, and CuONPs. As shown in Fig. 4, the FT-IR spectrum of PANI, presents a band at a mean wavelength of 3120 cm−1, which corresponds to the emission of N–H, while the band at a mean wavelength of 1562 cm−1 indicates a benzene cycle. Also, the band at 1130 cm−1 represents the PANI couch's protonation form.45
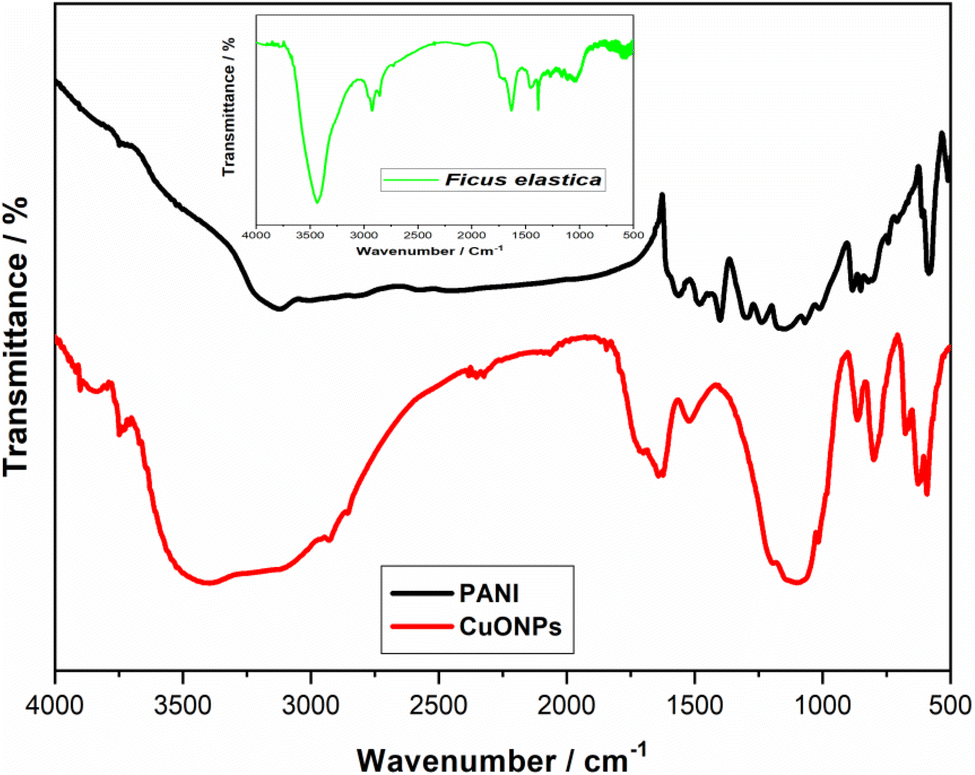 | ||
| Fig. 4 FT-IR spectra of: from the top to the bottom: the synthesized PANI and the synthesized CuONPs. Inset: Ficus elastica extract spectrum. | ||
Ficus elastica spectrum contains ROR' ethers, carboxylic acids, alkanes, sulfur compounds as well as unsaturated compounds of nitrogen and the aldehydes at 1025, 1256, 1382, 1455, 1634, 2875 cm−1, respectively. The presence of O–H stretching bond is shown by the broad band around 3419 cm−1, which relates to polyphenols (flavonoids) present in the Ficus elastica plant extract.54,55 CuONPs spectrum exhibits a broad peak at 3480 cm−1 illustrating the stretching frequency of the –OH group of absorbed water onto copper oxide NPs surface. Additionally, the peaks shown at 587.25 cm−1, 845.75 cm−1 and 1107.68 cm−1 could be attributed to Cu–O vibrations, confirming the formation of CuO species.49,56,57
3.2. Electrochemical characterization
The effect of the potential scan on the electrochemical behavior of the elaborated electrode was performed using potassium ferrocyanide–ferricyanide probe solution containing 5 mM [Fe(CN)6]3−/4− and 0.1 M KCl. Scan rate was varied in the range of 10 to 120 mV s−1 Fig. 5. As shown in Fig. S2B,† both anodic and cathodic peak current increased when scan rate was increased. Also, the redox current peaks showed a linear relationship with the square root of the potential scan rate; (Fig. 5A), giving the following regression equations:| Ipa/μA = 0.00406v1/2 (mV s−1) + 0.0002 R2 = 0.994 | (1) |
| Ipc/μA = −0.0044v1/2 (mV s−1) − 0.0002 R2 = 0.9901 | (2) |
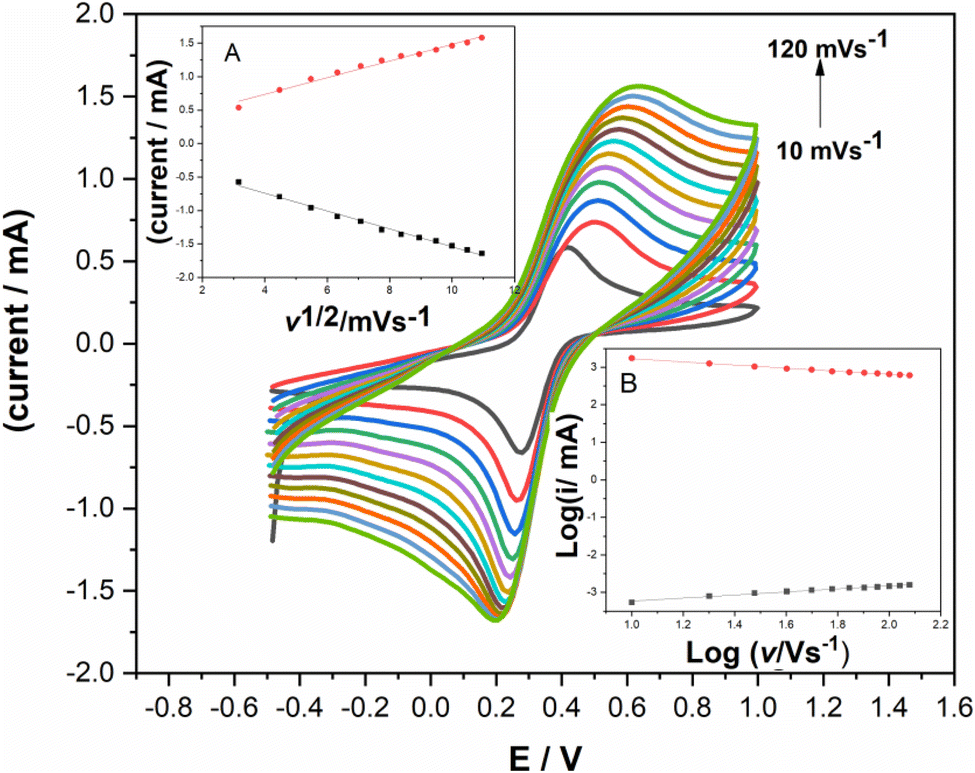 | ||
| Fig. 5 Cyclic voltammograms of CuONPs/PANI–CPE electrode at scan rates from 10 to 120 mV s−1 in [Fe(CN)6]3−/4−. Insets (A) the plot of anodic and cathodic peak currents vs. square root of scan rates; (B) log of peak currents vs. logarithm of scan rates. | ||
This feature is a distinctive diffusion-controlled electrochemical reaction which is further confirmed with the curve illustrating log(i) variation versus log(v); Fig. 5B.
The slopes derived from eqn (1) and (2) were used to calculate the real surface area of bare CPE and progressively modified electrode using Randles Sevcik's equation (eqn (3)).58,59
| Ipa = 2.69 × 10⁵ n(3/2)D(1/2)ACv(1/2) | (3) |
| Electrode | CPE | PANI–CPE | CuONPs/PANI–CPE |
|---|---|---|---|
| A (cm2) | 0.13 | 0.38 | 0.40 |
| ΔEp (mV) | 0.27 | 0.15 | 0.14 |
| Ipc/Ipa | 1.06 | 1.18 | 1.04 |
It can be noted from the above table that the electroactive surface area increases alongside the electrode modification, reflecting an improved electrode modification.
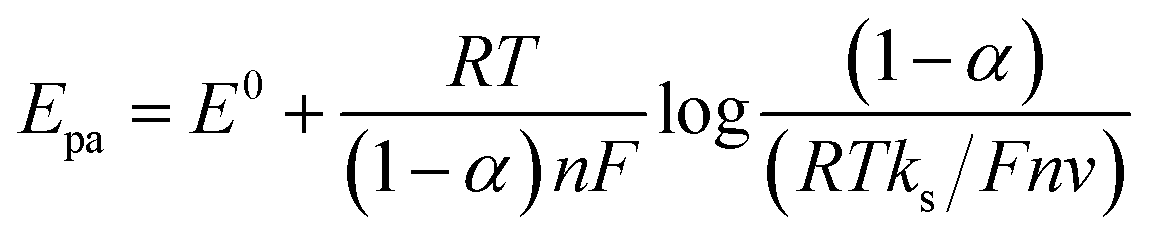
Additionally, Fig. 5 shows that peak-to-peak separation increases along with the scan rate, which may improve the electron transfer. Fig. S2A† shows Laviron's graph used for the calculation of kinetics parameters such as the electron transfer coefficient (α) and the apparent charge transfer rate constant (ks).32 The plot of peak potential versus the logarithm of the scan rate is depicted by two straight lines providing the following equations:
|
Epa/V = 0.1223log(v/mV s−1) + 0.5596 (R2 = 0.9901)
| (4) |
|
Epc/V = −0.05594log(v/mV s−1) + 0.18093 (R2 = 0.9689)
| (5) |
From these equations, as well as those given by Laviron,60,61 (eqn (6) and (7)), α and ks were calculated as 0.516 and 0.244 s−1, respectively.
 | (6) |
 | (7) |
The relatively high apparent charge transfer rate constant might improve the modified carbon paste electrode by accelerating the heterogeneous electron transfer between the targeted species and the electrode surface.
CV depicted by Fig. 6A showed an obvious difference between the bare CPE and the progressive modified electrode, in terms of peak height, anodic and cathodic peaks potential separation ΔEp and the ratio between the anodic and cathodic peak current densities (Ipa/Ipc). These parameters values are grouped in Table 1. These differences, in addition to prove the electrode actual modification, demonstrates a clear tendency to a reversible system when CPE is loaded with PANI and CuONPs.
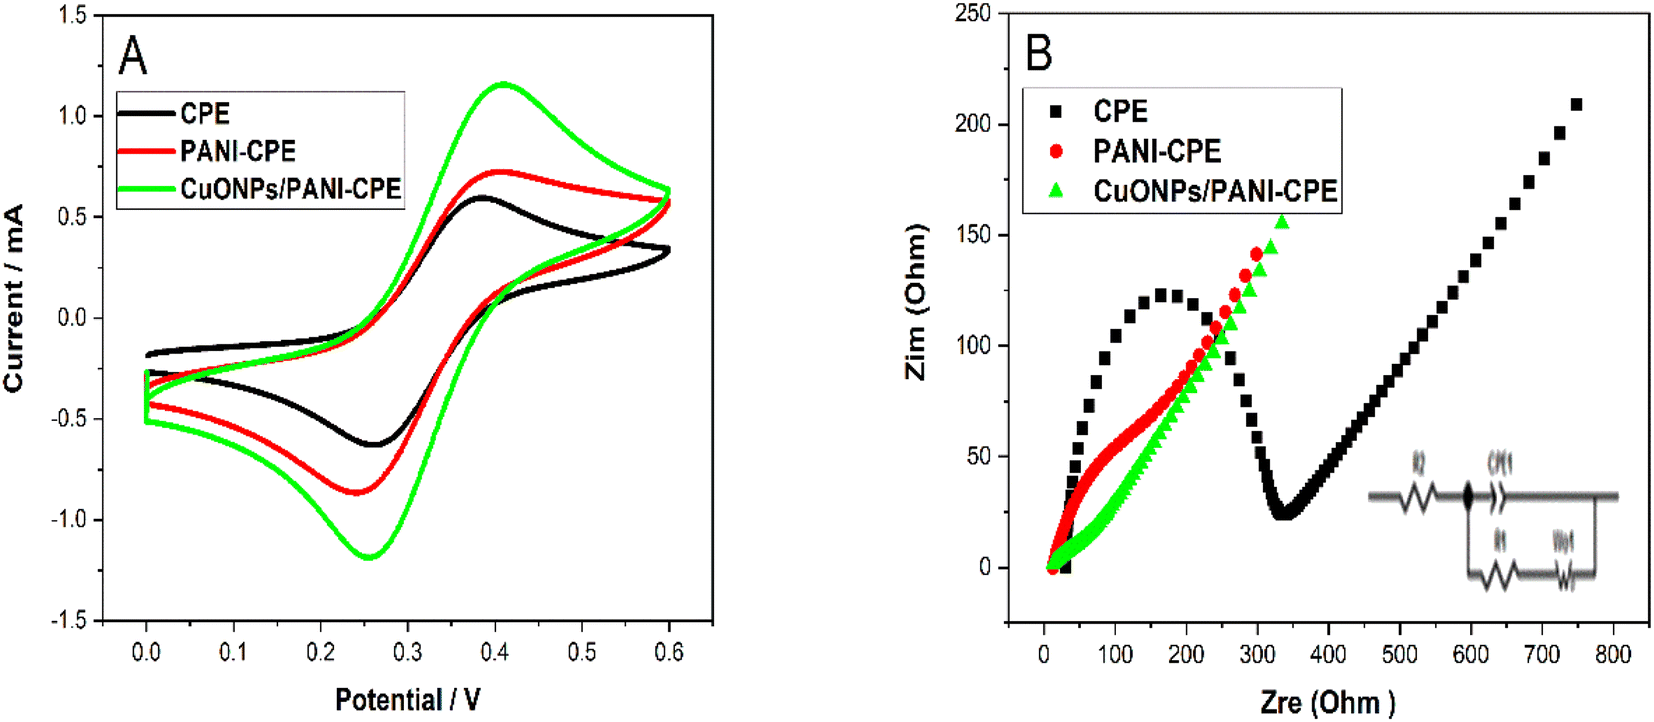 | ||
| Fig. 6 (A) CV curves of CPE, PANI–CPE, CuONPs/PANI–CPE in 5 mM [Fe(CN)6]3−/4− solution containing 0.1 M KCl at scan rate of 50 mV s−1. (B) Nyquist diagram of CPE, PANI–CPE, and CuONPs/PANI–CPE (Inset: the equivalent circuit). | ||
To better understand the information obtained from CV curves, EIS electrochemical impedance spectroscopy tests were carried out. The electron transfer capacity on the carbon paste electrode surface is examined by EIS before and after its modification. The Nyquist diagrams, Fig. 6B, show a semicircle in the low-frequency region for each electrode. The small semicircle of the CPE is equivalent to a charge transfer resistance (Rtc) equal to 270 Ω (black curve). PANI addition to the CPE reduced the semicircle diameter and decreased Rtc to 143 Ω (red curve). The deposition of CuONPs on the surface of PANI–CPE decreased more the semicircle diameter, giving Rtc = 110.6 Ω, this can be justified by the change in the characteristics of the surface electrode, which had a positive effect on the electron transfer process.
These results show that the charge transfer of CuONPs/PANI–CPE is faster than that of the CPE electrode. Therefore, CV and EIS diagrams support the successful preparation and excellent performance CuONPs/PANI–CPE.
3.3. Optimization of experimental parameters
Prior to the electrochemical investigation of the three metal ions determination, the measuring parameters were examined. Usually, the electrolyte solution is the most important factors which strongly influences the electrochemical electrode response. Therefore, the electrode response to Cd2+, Pb2+, and Hg2+ in different electrolyte solutions was carried out using SWV, including 1 M sodium chloride (NaCl), 0.1 M phosphate buffer (PBS; pH = 7.0), and 0.01 M hychlorhydric acid (HCl; 0.01 M), at room temperature.It can be seen from Fig. 7A that the hydrochloric acid provided the highest peak current. So, HCl was chosen as the supporting electrolyte in the metallic ions determination. On the other hand, the electrolyte solution pH has a significant role in electrochemical determination of metal ions. In Fig. 2B, Cd2+, Pb2+, and Hg2+ current response in different HCl solution pH are depicted. It can be observed that peaks current gradually increase reaching an optimal value for pH = 2. For electrolytes with pH greater than 2, a dramatically decrease of peak current is noted. Thus, HCl 0.01 M was chosen as the supporting electrolyte in the following experiments. In order to determine the influence of each compound of the electrode to its performance, SWV was performed on CPE, PANI–CPE, and CuONPs/PANI–CPE electrodes for simultaneous detection of 4.8 μg per L Cd2+, Pb2+, and Hg2+ in HCl solution (0.01 M). It can be seen from Fig. S3,† that current peak raises from CPE, PANI–CPE to CuONPs/PANI–CPE.
 | ||
| Fig. 7 SWV curves of 100.0 μg per L Cd2+, Pb2+, and Hg2+ ions onto CuONPs/PANI–CPE; (A) in different electrolyte solutions. (B) Anodic peak currents in HCl as a function of pH. (C) Anodic peak currents in HCl solution (0.01 M) obtained using different scan rates. | ||
The effect of scan rate from 150 to 300 mV s−1 for Cd2+, Pb2+, and Hg2+ determination in HCl 0.01 M was investigated by SWV technique, Fig. 7C. It can be noted that the current increased with scan rate increase. However, 200 mV s−1 was selected to allow a more precise investigation of metal ions determination.
CuONPs were incorporated in the PANI–CPE using two different methods. In the first one, CuONPs powder was mixed to PANI and pencil graphite powder. The electrode was labeled as CuONPs–PANI–CPE. In the second way, CuONPs suspension in chloroform (1 mg mL−1) was dripped on the prepared PANI–CPE surface. Then, SWV was applied in HCl (0.01 M) solution containing 100.0 μg per L Cd2+, Pb2+, and Hg2+. Fig. S4† revealed that the three metals currents peak are higher onto CuONPs/PANI–CPE. This feature was previously reported.45 So, this electrode preparation method was chosen for the electrochemical sensing of Cd2+, Pb2+, and Hg2+.
3.4. Individual detection of heavy metals
Within the optimal experimental conditions, Cd2+, Pb2+, and Hg2+ detection onto CuONPs/PANI–CPE modified electrode in HCl (0.01 M) was analyzed by performing SWV and CV Curves. Individual detection of Cd2+, Pb2+ and Hg2+ using CV at scan rate of 50 mV s−1 containing 2.6 μg L−1 of Cd2+, Pb2+ and Hg2+ are shown in Fig. 8. While CuONPs/PANI–CPE cyclic voltammetry in HCl does not contain any peak, the presence of either of Cd2+, Pb2+ or Hg2+ is reflected by a well defined and separated peaks at respectively, −0.7 V, −0.39 V, and 0.4 V. As illustrated by Fig. S5,† peaks current increase with metal ions concentration increase, giving a linear relationship between peak current amplitude and concentration. The limit of detection (LOD) (S/N = 3) for Cd2+, Pb2+, and Hg2+ were calculated to be 0.20 μg L−1, 0.13 μg L−1 and 0.05 μg L−1, respectively. | ||
| Fig. 8 CV Curves of CuONPs/PANI–CPE in HCl (0.01 M) in the absence (black) and in the presence of 2.6 μg L−1 of Cd2+ (green), Pb2+ (red), and Hg2+ (blue) at scan rate of 50 mV s−1. | ||
Similarly to CV, SWV exhibited a gradual increase in peak current related to Cd2+, Pb2+, and Hg2+ oxidation reaction dependently on their raising amounts. SWV curves with the corresponding calibration plots showed different linear ranges depending on the metal ion. For Cd2+ and Pb2+, the linear range was almost the same, 0.1–1.8 μg L−1 and 0.1–1.4 μg L−1, respectively. However, Hg2+ exhibited the most extended linear range [0.05–3.4] μg L−1, Fig. 9. The determined limit of detection was as follows (S/N = 3): 0.11 μg L−1, 0.16 μg L−1, and 0.07 μg L−1 for Cd2+ (R2 = 0.9947), Pb2+ (R2 = 0.9755), and Hg2+(R2 = 0.9978), respectively.
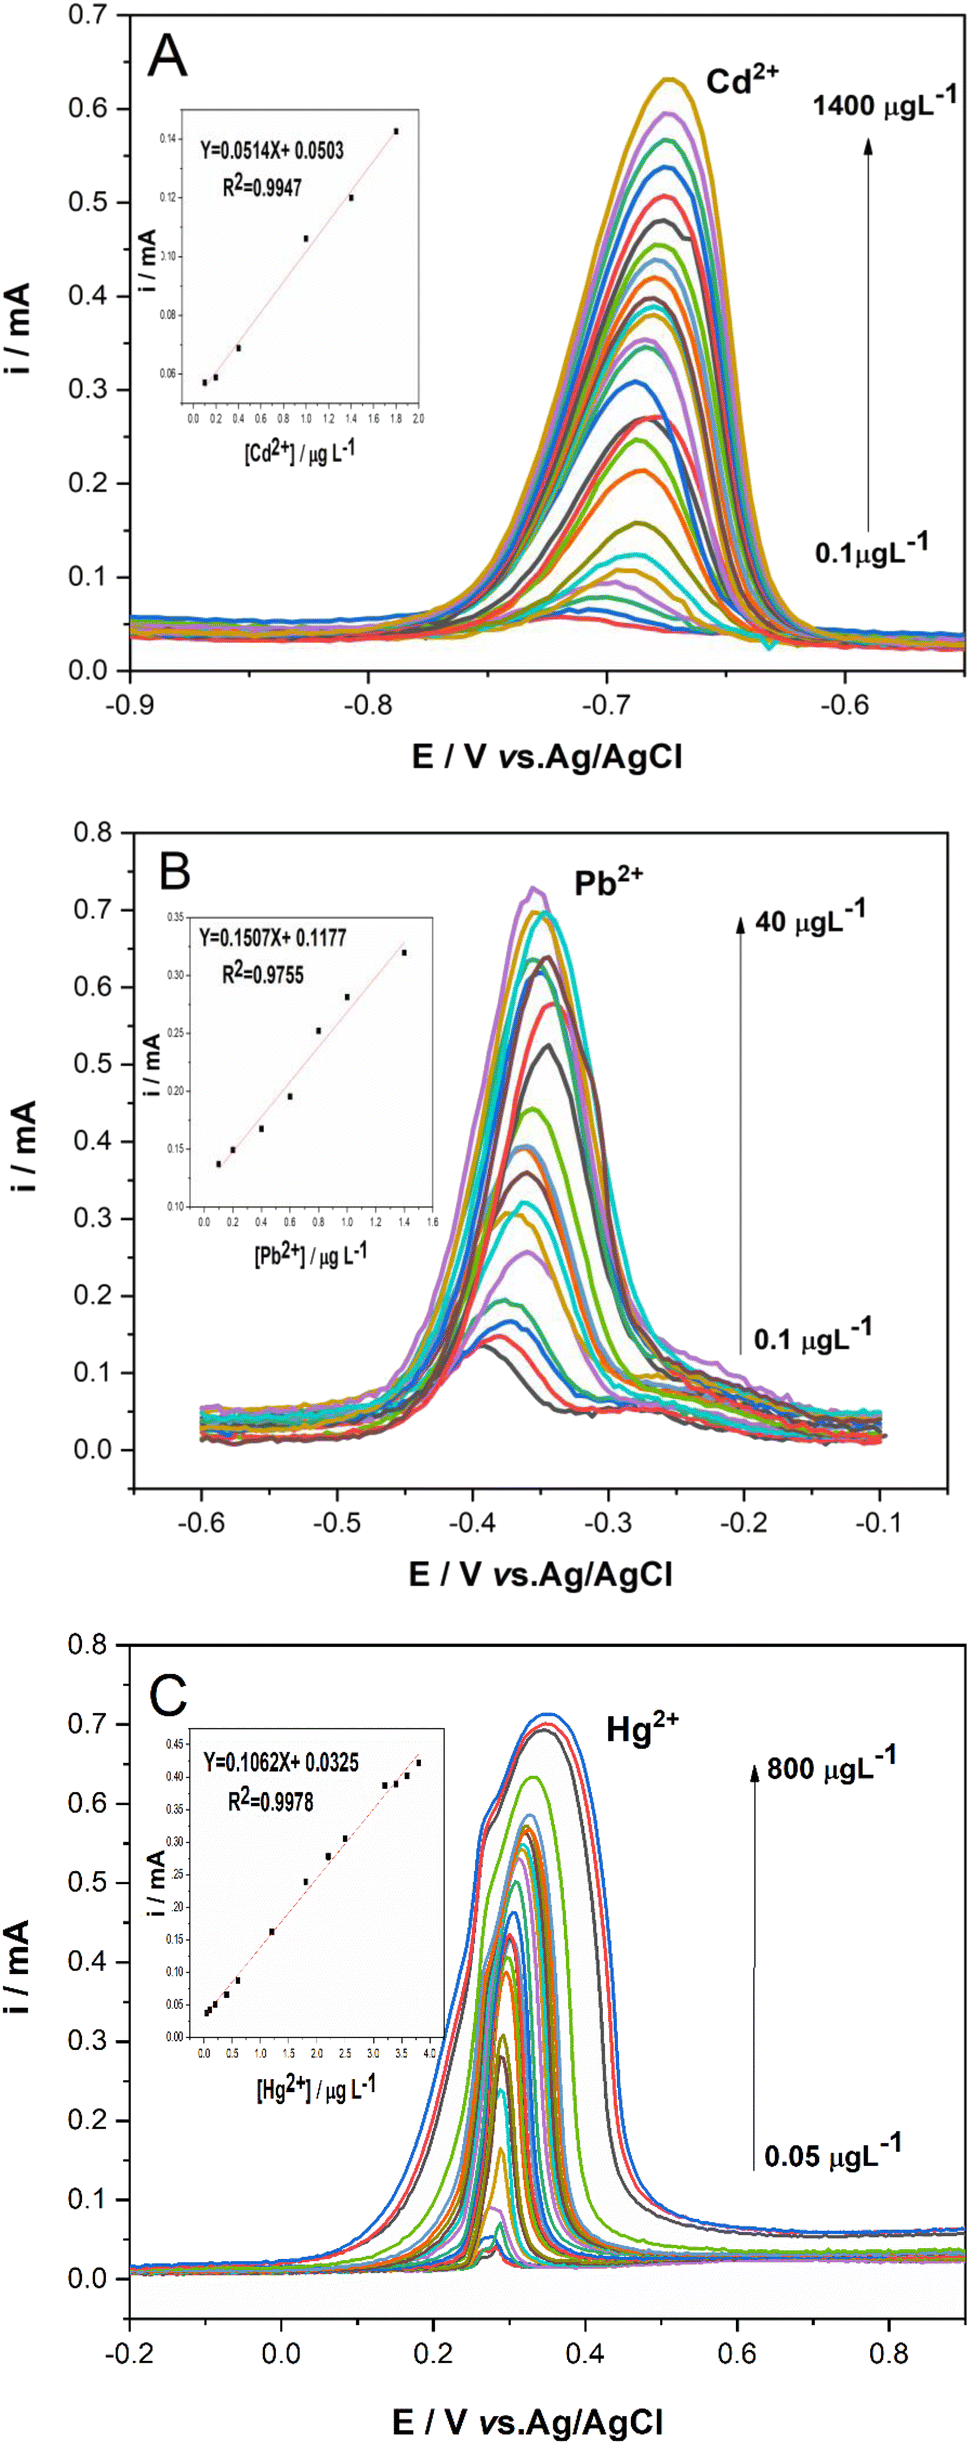 | ||
| Fig. 9 Square wave voltammetry of CuONPs/PANI–CPE in HCl (0.01 M) containing single different concentration of (A) Cd2+, (B) Pb2+, (C) Hg2+. Insets: the corresponding calibration curves. | ||
These findings showed that CuONPs/PANI–CPE modified carbon paste electrode was able to detect Cd2+, Pb2+ and Hg2+ individually, with excellent electrochemical performances. So, it seems appropriate to examine CuONPs/PANI–CPE performance in multi-metal solution.
3.5. Simultaneous detection of Cd2+, Pb2+, and Hg2+
In order to investigate the simultaneous determination of the three metals in the same hydrochloric acid solution onto CuONPs/PANI–CPE, cyclic voltammetry was applied in the range [−0.1; 0.7 V] at 50 mV s−1 scan rate see Fig. S6.† As expected, similar features were observed in multi-metal configuration; namely a clear increase in peak current as metals ions concentration increased giving a linear relationship for Cd2+, Pb2+, and Hg2+, with the corresponding correlation coefficients of 0.9936, 0.9907 and 0.9936, respectively inset Fig. S6.† LOD has been calculated to be 0.65 μg L−1, 0.40 μg L−1, and 0.66 μg L−1, respectively for Cd2+, Pb2+, and Hg2+.In the same way, simultaneous determination of Cd2+, Pb2+, and Hg2+ onto CuONPs/PANI–CPE in HCl (0.01 M) was carried out employing SWV in solution containing a given concentration of two metals (2.6 μg L−1) and gradually increased concentration of the third metal; Fig. 10A–C. It can be observed that Cd2+ peak current increased in the ranges of 0.2–5 μg L−1 while Pb2+ and Hg2+ peaks remains almost constant, Fig. 10A. Cd2+ peak currents exhibit linear relationship in respect of its concentrations with LOD = 0.49 μg L−1 (R2 = 0.998). Likewise, lead and mercury ions illustrate the same feature as cadmium Fig. 10B and C. Their limit of detection were 0.53 μg L−1 (R2 = 0.9797) and 0.17 μg L−1 for Pb2+ and Hg2+ (R2 = 0.9975), respectively.
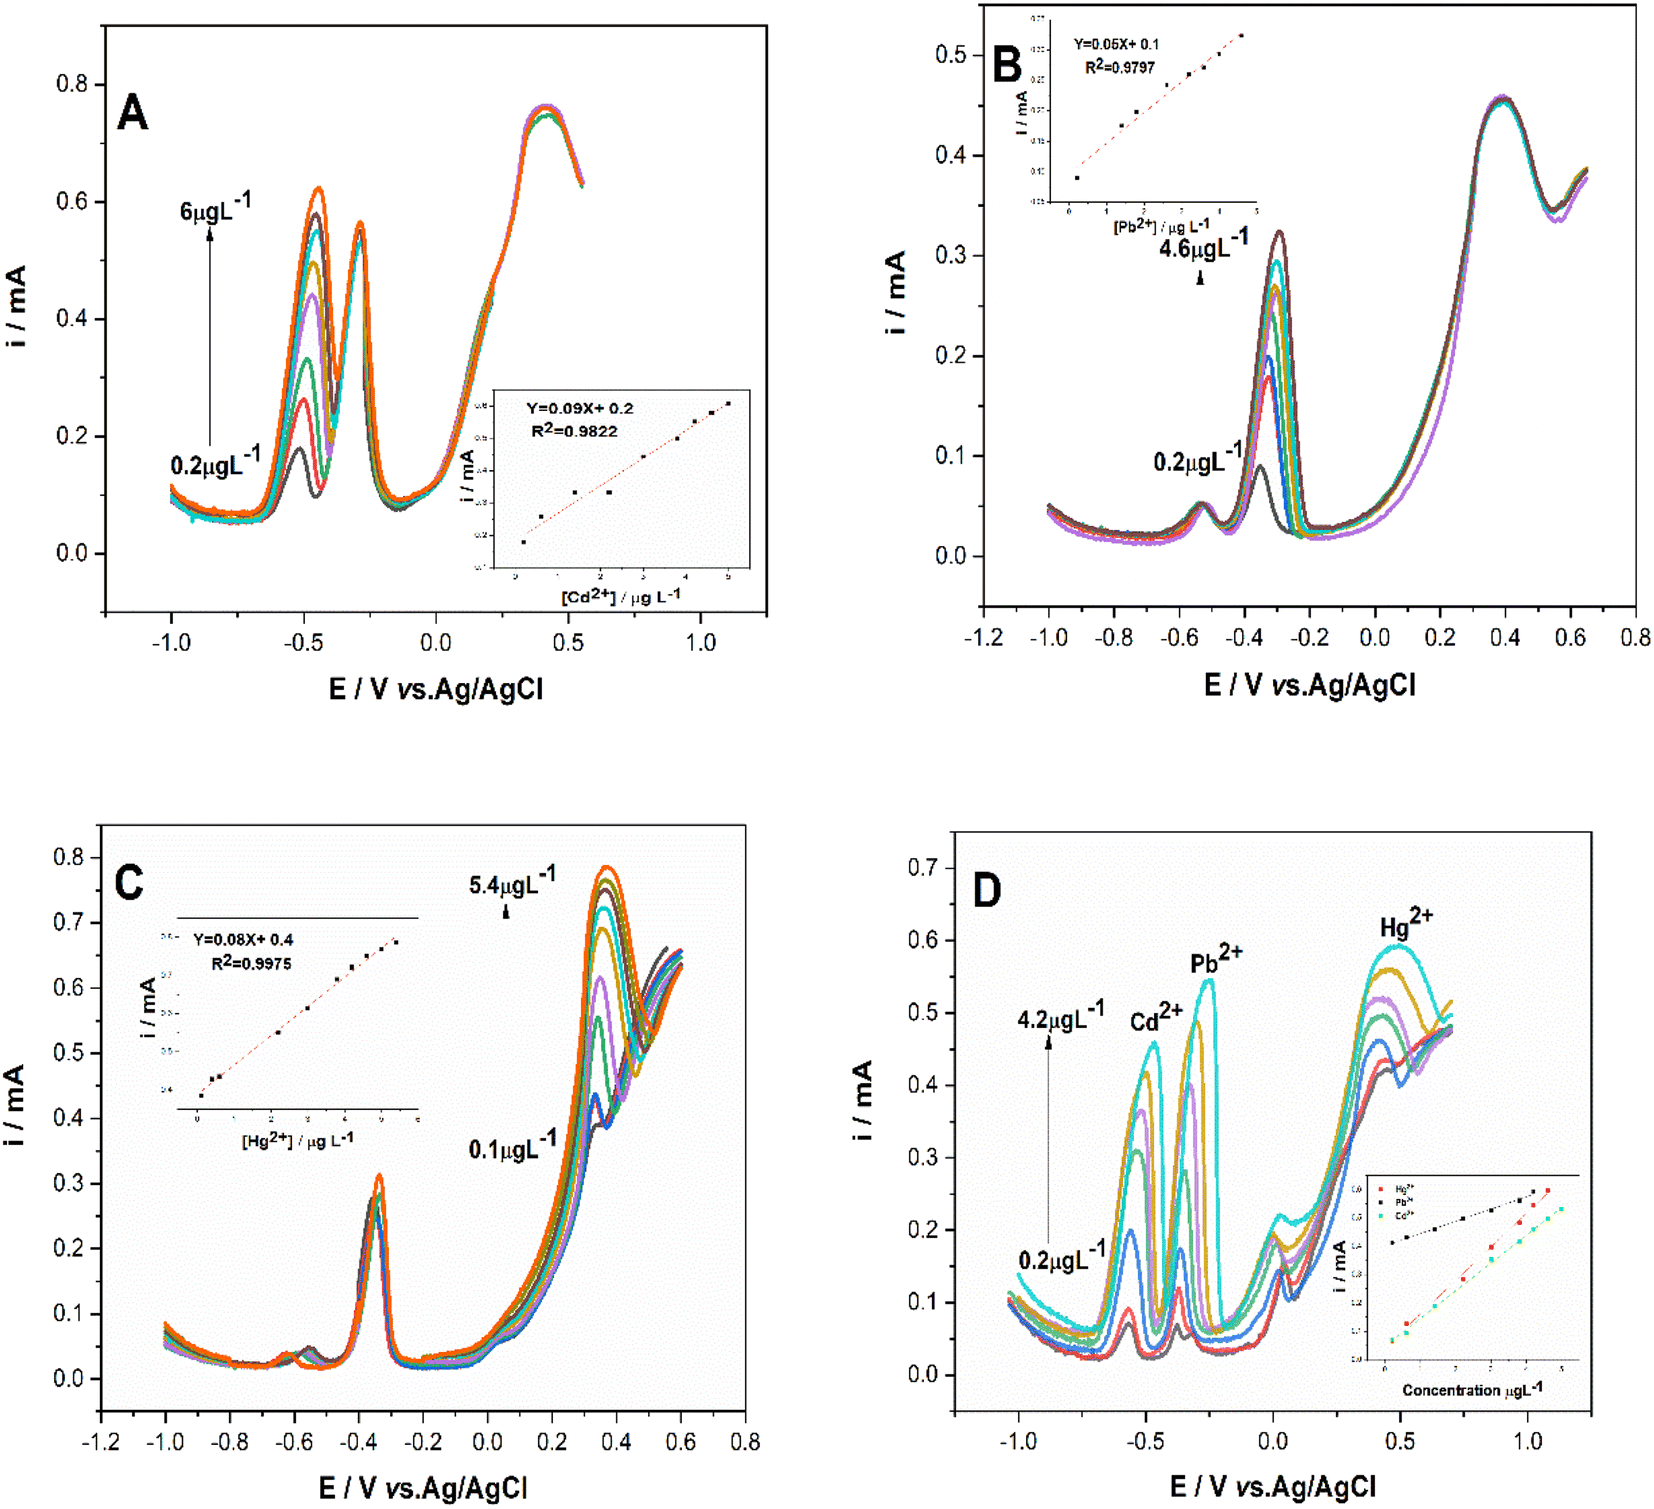 | ||
| Fig. 10 Multi metal SWV of CuONPs/PANI–CPE in HCl (0.01 M) containing (A) a constant concentration of Cd2+ and varying Pb2+ and Hg2+ concentration, (B) a constant concentration of Pb2+ and varying Cd2+ and Hg2+ concentration, (C) a constant concentration of Hg2+ and varying Cd2+ and Pb2+ concentration. (D) SWV for simultaneous detection of Cd2+, Pb2+, and Hg2+ on CuONPs/PANI–CPE in HCl (0.01 M) solution. Insets: the calibration curves. | ||
Fig. 10D illustrates the simultaneous detection of a mixture of Cd2+, Pb2+, and Hg2+ in the range of 0.2–4.2 μg L−1 under optimal conditions on CuONPs/PANI–CPE in HCl (0.01 M). The SWV signal responses show increased peak current values dependently with increasing concentration of the three target metal ions. Knowing that metal ions concentration increase causes a slight potential shift of the peaks towards positive values has been observed, however, the individual three peaks remain separated and easily distinguished. Interestingly, sensitivity and linear range for Cd2+, Pb2+ and Hg2+ remain almost unchanged and no shift has been seen at the peak position in comparison to their individual determination, indicating that no mutual interference exists between the three metal ions.62
Furthermore, the newly presented electrode preparation method showed an advantageous linear range and a low LOD. The comparison of the analytical parameters of several electrochemical sensors for the three metal ions reported in previously published studies emphasizes the excellent performances of the fabricated CuONPs/PANI–CPE sensor, Table 2.
| Modified electrode | Method | Detection limit (μg L−1) | Linear range (μg L−1) | Ref. | ||||
|---|---|---|---|---|---|---|---|---|
| Cd2+ | Pb2+ | Hg2+ | Cd2+ | Pb2+ | Hg2+ | |||
| a AGCE: activate glassy carbon electrode; Eu3+-doped NiO/CPE: europium3+ doped nickel oxide/carbon past electrode; Alk-Ti3C2/GCE: alkaline-titanium carbide/glassy carbon electrode; Au-SPGE-LT: low temperature gold-cured screen-printed electrode; modified-NPBiE: modified nanoporous bismuth electrode; GC/GQDs-NF: glassy carbon electrode/graphene quantum dots-Nafion; BC-Au and CILE: biomass carbon composite materials and ionic liquid carbon paste electrode; Bi/LIGF: laser-induced graphene fiber; CDs/AuNPs/SPCE: fluorescent carbon dots/gold nanoparticles/screen-printed carbon electrode; CuONPs/PANI–CPE: copper oxide nanoparticles/polyaniline–carbon paste electrode. | ||||||||
| AGCE | DPASV | 1.91 | 0.062 | — | 5.62–562 | 0.21–1036 | — | 22 |
| Eu3+-doped NiO/CPE | SWASV | 0.4 | 0.1 | — | 0.8–165 | 0.8–165 | — | 46 |
| Alk-Ti3C2/GCE | SWASV | 11.016 | 8.495 | 26.077 | 11.24–168.62 | 20.72–310.8 | 20.059–300.89 | 63 |
| Au-SPGE-LT | SWASV | — | 2.2 | 1.3 | — | 5–300 | 5–300 | 64 |
| Modified-NPBiE | SWASV | 1.3 | 1.5 | — | 5–40 | 5–40 | — | 65 |
| GC/GQDs-NF | SWASV | 11.30 | 8.49 | — | 20–200 | 20–200 | — | 66 |
| BC-Au, CILE | SWV | 10.12 | 75.84 | 98.09 | 281.03–843.08, 56.20–674.47 | 518–1554, 103.6–1243.2 | 100.30–1203.54 | 67 |
| Bi/LIGF | SWASV | 0.4 | 0.4 | — | 1.0–140.0 | 1.0–140.0 | — | 68 |
| CDs/AuNPs/SPCE | DPV | 2.8 | 4.2 | — | 10–27 | 10–27 | — | 69 |
| CuONPs/PANI–CPE | Individual detection | |||||||
| SWV | 0.113 | 0.1644 | 0.070 | 0.1–1.8 | 0.1–1.4 | 0.05–3.4 | This work | |
| CV | 0.205 | 0.139 | 0.055 | 0.2–3.4 | 0.1–4 | 0.05–2.4 | ||
| CuONPs/PANI–CPE | Simultaneous detection | |||||||
| SWV | 0.17 | 0.21 | 0.24 | 0.2–4.2 | 0.2–4.2 | 0.2–4.2 | This work | |
| CV | 0.65 | 0.40 | 0.66 | 0.2–7.8 | 0.2–7.8 | 0.2–7.8 | ||
4. Method validation
4.1. Interference examination
The CuONPs/PANI–CPE sensor was tested for the detection of the target metal ions in the presence of some common interfering substances. SWV was recorded in a solution of 50 μg L−1 of Cd2+, Pb2+ and Hg2+ ions in HCl (0.01 M) and in the presence of successive additions of interfering compounds (Ag+, Al3+, Co2+, Cr3+, Fe3+, Fe2+, Mg2+, Ni2+, and Zn2+).Although the concentration of the other analytes were 10 times higher than that of Cd2+, Pb2+ and Hg2+ ions, it does not significantly modify their response signals Fig. 11. Furthermore, the addition of organic molecules such as paracetamol and catechol does not affect the analytical results. These results indicate that CuONPs/PANI–CPE has excellent anti-interference performance for the detection of Cd2+, Pb2+, Hg2+.
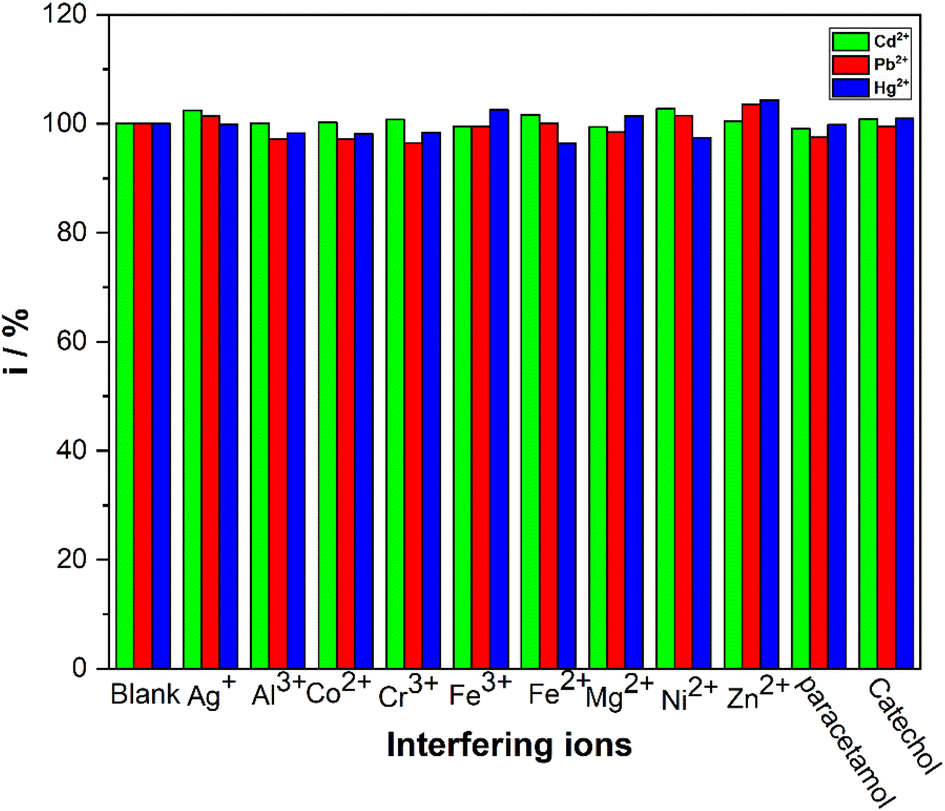 | ||
| Fig. 11 Sensing responses of CuONPs/PANI–CPE towards Cd2+, Pb2+, and Hg2+ in the presence of different interfering substances. | ||
4.2. Repeatability, reproducibility, and stability
The repeatability was assessed by performing SWV on CuONPs/PANI–CPE for subsequent five times in solution containing Cd2+, Pb2+, and Hg2+ (2.6 μg L−1) in HCl (0.01 M), Fig. S7A.† RSD values were found to be 1.11%, 1.56%, and 1.16% for Cd2+, Pb2+, and Hg2+, respectively, which verify the excellent accuracy of the measurements.The reproducibility was explored by considering five sensors prepared using the same procedure and tested for the determination of 2.6 μg L−1 of Cd2+, Pb2+, and Hg2+. The modified electrode showed good reproducible results with a RSD of 1.01%, 1.63%, and 0.63% for Cd2+, Pb2+, and Hg2+, respectively. CuONPs/PANI–CPE stability was investigated in a separate experiment using a constant concentration of Cd2+, Pb2+, and Hg2+. Fig. S7B† shows the sensor response over a month. As depicted by the figure, the sensor retained 99% of the initial current response, confirming the excellent stability of the elaborated sensor.
4.3. Real sample analysis
The practical application of CuONPs/PANI–CPE sensor was evaluated by simultaneous analysis of Cd2+, Pb2+, and Hg2+ in real samples; in this case; sea water, tap water, mineral water and river water. These samples were diluted with a 0.05 M solution of HCl to obtain 0.01 M solutions. Then, waters samples were spiked with known amounts of Cd2+, Pb2+, and Hg2+, and the obtained solutions were subjected to SWV under optimum conditions and the outcome is presented in Table S1.† The obtained recovery for the target metal ions varied between 90% and 116.66% displaying satisfactory performance of the elaborated sensor.It is worth noting that an unexpected well defined peak has been observed in Hg2+ region when analyzing sea water. The peak amplitude gave a concentration of 0.4 μg L−1 the standard addition method confirms the initial concentration of mercury in the Mediterranean Sea. This observation has led us to conduct further investigation on sea water contamination and this will be done in a future work. However, these satisfactory results obtained with the novel modified carbon paste electrode show the great potential applicability in environmental monitoring Fig. S8.† Furthermore, according to previously reported works, it seems feasible that the as-prepared sensor could be translated into a portable device.70,71 In fact, it is easy to recreate the sensor on a screen printed electrode by performing an electrochemical polymerization of aniline in a solution containing green synthesized CuONPs. The screen printed electrode could be associated with portable electrochemical workstation for an on-site simultaneous detection of Cd2+, Pb2+, and Hg2+.
5. Conclusion
In this study and for the first time, a new carbon paste electrode based on low-cost pencil graphite powder modified with PANI and green synthesized copper oxide nanoparticles using Ficus elastica extract was developed for the electrochemical detection of Cd2+, Pb2+, and Hg2+ using square wave voltammetry (SWV) and cyclic voltammetry (CV). According to the electrochemical measurements, the developed CuONPs/PANI–CPE was capable of sensing Cd2+, Pb2+, and Hg2+ solutions containing both single metal and the three metal ions simultaneously. The sensor presented attractive analytical performances including high sensitivities with a relatively large linear range, low detection limits, good stability, reproducibility, and selectivity. Moreover, CuONPs/PANI–CPE senor was applied to different real samples and meaningful recoveries were found supporting, thus, the accuracy of the developed sensor. The results obtained with seawater highlighted the presence of Hg2+ in the Mediterranean Sea which is of great concern and further analysis should be carried out to clarify and determine the amounts of Hg2+ in the sea as well as in the aquatic fauna and flora.Conflicts of interest
There are no conflicts to declare.References
- M. M. Al-Sulaiti, L. Soubra and M. A. Al-Ghouti, The Causes and Effects of Mercury and Methylmercury Contamination in the Marine Environment: A Review, Curr. Pollut. Rep., 2022, 8, 249–272, DOI:10.1007/s40726-022-00226-7.
- L. Ismukhanova, T. Choduraev, C. Opp and A. Madibekov, Accumulation of Heavy Metals in Bottom Sediment and Their Migration in the Water Ecosystem of Kapshagay Reservoir in Kazakhstan, Appl. Sci., 2022, 12, 11474, DOI:10.3390/app122211474.
- M. Mohammad Ali, S. Rahman, M. S. Islam, M. R. J. Rakib, S. Hossen, M. Z. Rahman, T. Kormoker, A. M. Idris and K. Phoungthong, Distribution of heavy metals in water and sediment of an urban river in a developing country: A probabilistic risk assessment, Int. J. Sediment Res., 2022, 37, 173–187, DOI:10.1016/j.ijsrc.2021.09.002.
- B. K. Mavakala, P. Sivalingam, A. Laffite, C. K. Mulaji, G. Giuliani, P. T. Mpiana and J. Poté, Evaluation of heavy metal content and potential ecological risks in soil samples from wild solid waste dumpsites in developing country under tropical conditions, Environ. Challenges, 2022, 7, 100461, DOI:10.1016/j.envc.2022.100461.
- J. Briffa, E. Sinagra and R. Blundell, Heavy metal pollution in the environment and their toxicological effects on humans, Heliyon, 2020, 6, 2405–8440, DOI:10.1016/j.heliyon.2020.e04691.
- V. Branco, S. Caito, M. Farina, J. B. Teixeira da Rocha, M. Aschner and C. Carvalho, Biomarkers of mercury toxicity: Past, present and future trends, J. Toxicol. Environ. Health, Part B, 2017, 20, 119–154, DOI:10.1080/10937404.2017.1289834.
- H. H. Harris, I. J. Pickering and G. N. George, The Chemical Form of Mercury in Fish, Science, 2003, 301, 1203, DOI:10.1126/science.1085941.
- A. Blanco, M. L. Pignata, H. R. Lascano, M. J. Salazar and J. H. Rodriguez, Lead uptake and translocation pathways in soybean seedlings: the role of ion competition and transpiration rates, Environ. Sci. Pollut. Res., 2021, 28, 20624–20636, DOI:10.1007/s11356-020-11901-x.
- Y. Zhou, X. Liu and J. Wang, Ecotoxicological effects of microplastics and cadmium on the earthworm Eiseniafoetida, J. Hazard. Mater., 2020, 392, 122273, DOI:10.1016/j.jhazmat.2020.122273.
- S. Mishra, R. N. Bharagava, N. More, A. Yadav, S. Zainith, S. Mani and P. Chowdhary, Heavy Metal Contamination: An Alarming Threat to Environment and Human Health, in Enviro. Biotechnolo: for Sustainable Future, 2018, pp. 103–125, DOI:10.1007/978-981-10-7284-0_5.
- A. Sikdar, P. G. S. A. Jeyasundar, B. Debnath, M. S. Hossain, M. A. Islam and G. J. Ahammed, Cadmium Contamination in the Soil Environment: Impact on Plant Growth and Human Health, in Agrochemicals in Soil and Environment, 2022, vol. 219, pp. 367–408, DOI:10.1007/978-981-16-9310-6_16.
- Y. Yao, T. Zhang and M. Tang, The DNA damage potential of quantum dots: Toxicity, mechanism and challenge, Environ. Pollut., 2022, 120676, DOI:10.1016/j.envpol.2022.120676.
- M. Soylak, M. Alasaad and Ö. Özalp, Fabrication and characterization of MgCo2O4 for solid phase extraction of Pb(II) from environmental samples and its detection with high-resolution continuum source flame atomic absorption spectrometry (HR-CS-FAAS), Microchem. J., 2022, 178, 107329, DOI:10.1016/j.microc.2022.107329.
- I. de la Calle, D. F. Rodríguez, I. Lavilla and C. Bendicho, Silver nanoparticle-cellulose composite for thin-film microextraction of Cd and Pb as dithiocarbamate derivatives followed by inductively-coupled plasma mass spectrometry determination, Advances in Sample Preparation, 2022, 4, 100041, DOI:10.1016/j.sampre.2022.100041.
- M. C. Tsai and P.-Y. Chen, Voltammetric study and electrochemical detection of hexavalent chromium at gold nanoparticle-electrodeposited indium tin oxide (ITO) electrodes in acidic media, Talanta, 2008, 76, 533–539, DOI:10.1016/j.talanta.2008.03.043.
- B. Niu, B. Yao, M. Zhu, H. Guo, S. Ying and Z. Chen, Carbon paste electrode modified with fern leave-like MIL-47(as) for electrochemical simultaneous detection of Pb(II), Cu(II) and Hg(II), J. Electroanal. Chem., 2021, 886, 115121, DOI:10.1016/j.jelechem.2021.115121.
- J. Pang, S. jin, J. Hou, G. Wang, K. Sun, Y. Zheng, H. Li, Y. Shen, X. Yang and L. Chen, Ultra-trace simultaneous detection of Hg(II), Cd(II), and Cu(II) and mechanism based on Co/CoO/Co3O4 Z-type heterojunctions, Sens. Actuators, B, 2023, 374, 132725, DOI:10.1016/j.snb.2022.132725.
- K.-Y. Hwa, T. S. K. Sharma and A. Ganguly, Design strategy of rGO–HNT–AgNPs based hybrid nanocomposite with enhanced performance for electrochemical detection of 4-nitrophenol, Inorg. Chem. Front., 2020, 7, 1981–1994, 10.1039/D0QI00006J.
- B. Sapotta, M. Schwotzer and M. Franzreb, Practical Insights into the Impedance Response of Interdigitated Electrodes: Extraction of Relative Static Permittivity and Electrolytic Conductivity, Electroanalysis, 2022, 34, 1–13, DOI:10.1002/elan.202200102.
- E. Cevik, S. M. M. Asiri, T. F. Qahtan and A. Bozkurta, Fabrication of high mechanical stability electrodes and bio-electrolytes for high-performance supercapacitor application, J. Alloys Compd., 2022, 913, 165230, DOI:10.1016/j.jallcom.2022.165230.
- Z. Li, J. Zhang, Y. Huang, J. Zhai, G. Liao, Z. Wang and C. Ning, Development of electroactive materials-based immunosensor towards early-stage cancer detection, Coord. Chem. Rev., 2022, 471, 214723, DOI:10.1016/j.ccr.2022.214723.
- D. Mao, P. Duan and Y. Piao, Acid phosphate-activated glassy carbon electrode for simultaneous detection of cadmium and lead, J. Electroanal. Chem., 2022, 925, 116898, DOI:10.1016/j.jelechem.2022.116898.
- K. P. A. Kumar, K. Ghosh, O. Alduhaish and M. Pumera, Dip-coating of MXene and transition metal dichalcogenides on 3D-printed nanocarbon electrodes for the hydrogen evolution reaction, Electrochem. Commun., 2021, 122, 106890, DOI:10.1016/j.elecom.2020.106890.
- S. Palisoc, E. M. Espique, A. M. Ribay, S. Sy, K. A. Tan, N. De Jesus, M. Noel and M. Natividad, Silver/bismuth/Nafion modified pencil graphite electrode for trace heavy metal determination, Int. J. Electrochem. Sci., 2018, 13, 10355–10367, DOI:10.20964/2018.11.63.
- J. Kariuki, E. Ervin and C. Olafson, Development of a novel, low-cost, disposable wooden pencil graphite electrode for use in the determination of antioxidants and other biological compounds, Sensors, 2015, 15(8), 18887–18900, DOI:10.3390/s150818887.
- M. Nacef, M. L. Chelaghmia, A. M. Affoune and M. Pontié, Electrochemical Investigation of Glucose on a Highly Sensitive Nickel-Copper Modified Pencil Graphite Electrode, Electroanalysis, 2019, 31, 113–120, DOI:10.1002/elan.201800622.
- C. W. Foster, D. A. C. Brownson, A. P. R. D. Souza, E. Bernalte, J. Iniesta, M. Bertotti and C. E. Banks, Pencil it in: pencil drawn electrochemical sensing platforms, Analyst, 2016, 141(13), 4055–4064, 10.1039/C6AN00402D.
- N. Jadon, R. Jain and A. Pandey, Electrochemical analysis of amlodipine in some pharmaceutical formulations and biological fluid using disposable pencil graphite electrode, J. Electroanal. Chem., 2017, 788, 7–13, DOI:10.1016/j.jelechem.2017.01.055.
- C. Kavitha, K. Bramhaiah and N. S. John, Low-cost electrochemical detection of L-tyrosine using an rGO–Cu modified pencil graphite electrode and its surface orientation on a Ag electrode using an ex situ spectroelectrochemical method, RSC Adv., 2020, 10, 22871–22880, 10.1039/D0RA04015K.
- C. Boukharouba, M. Nacef, M. L. Chelaghmia, R. Kihal, W. Drissi, H. Fisli, A. M. Affoune and M. Pontié, Dendritic Cu(OH)2 nanostructures decorated pencil graphite electrode as a highly sensitive and selective impedimetric non-enzymatic glucose sensor in real human serum blood samples, Monatsh. Chem., 2022, 153, 171–181, DOI:10.1007/s00706-021-02883-8.
- G. Pierini, M. Pistonesi, M. Di Nezio and M. Centurión, A pencil-lead bismuth film electrode and chemometric tools for simultaneous determination of heavy metals in propolis samples, Microchem. J., 2016, 125, 266–272, DOI:10.1016/j.microc.2015.11.038.
- M. Nacef, M. L. Chelaghmia, O. Khelifi, M. Pontie, M. Djelaibia, R. Guerfa, V. Bertagna, C. Vautrin-Ul, A. Fares and A. M. Affoune, Electrodeposited Ni on pencil graphite electrode for glycerol electro oxidation in alkaline media, Int. J. Hydrogen Energy, 2021, 46, 37670–37678, DOI:10.1016/j.ijhydene.2020.07.104.
- M. Majidi, A. Saadatirad and E. Alipour, Pencil Lead electrode modified with hemoglobin film as a novel biosensor for nitrite determination, Electroanalysis, 2013, 25(7), 1742–1750, DOI:10.1002/elan.201300082.
- M. H. Motaghedifard, S. M. Pourmortazavi and S. Mirsadeghi, Selective and sensitive detection of Cr(VI) pollution in waste water via polyaniline/sulfated zirconium dioxide/multi walled carbon nanotubes nanocomposite based electrochemical sensor, Sens. Actuators, B, 2021, 327, 128882, DOI:10.1016/j.snb.2020.128882.
- M. Fuseini, M. Mahmoud and Y. Zaghloul, Investigation of Electrophoretic Deposition of PANI Nano fibers as a Manufacturing Technology for corrosion protection, Prog. Org. Coat., 2022, 171, 107015, DOI:10.1016/j.porgcoat.2022.107015.
- G. Alva, Y. Lin, L. Liu and G. Fang, Synthesis, characterization and applications of microencapsulated phase change materials in thermal energy storage: A review, Energy Build., 2017, 144, 276–294, DOI:10.1016/j.enbuild.2017.03.063.
- S. Ahmed, A. M. Saifullah, B. L. Swami and S. Ikram, Green synthesis of silver nanoparticles using Azadirachtaindica aqueous leaf extract, J. Radiat. Res. Appl. Sci., 2016, 9, 1–7, DOI:10.1016/j.jrras.2015.06.006.
- M. N. Khan, T. A. Khan, Z. Khan and S. A. AL-Thabaiti, Green synthesis of biogenic silver nanomaterials using Raphanussativus extract, effects of stabilizers on the morphology, and their antimicrobial activities, Bioprocess Biosyst. Eng., 2015, 38, 2397–2416, DOI:10.1016/j.jrras.2015.06.006.
- M. M. H. Khalil, E. H. Ismail, K. Z. El-Baghdady and D. Mohamed, Green synthesis of silver nanoparticles using olive leaf extract and its antibacterial activity, Arabian J. Chem., 2014, 7, 1131–1139, DOI:10.1016/j.arabjc.2013.04.007.
- H. M. M. Ibrahim, Green synthesis and characterization of silver nanoparticles using banana peel extract and their antimicrobial activity against representative microorganisms, J. Radiat. Res. Appl. Sci., 2015, 8, 265–275, DOI:10.1016/j.jrras.2015.01.007.
- A. A. Ganash, Electrochemical properties and mechanistic study of the green synthesis of silver nanoparticles using Bardaqush extract solution, Mater. Res. Express, 2019, 6, 065024, DOI:10.1088/2053-1591/ab0d40.
- A. Aghajanyan, L. Gabrielyan, R. Schubert and A. Trchounian, Silver ion bioreduction in nanoparticles using Artemisia annua L. extract: characterization and application as antibacterial agents, AMB Express, 2020, 10, 66, DOI:10.1186/s13568-020-01002-w.
- F. E. Ettadili, S. Aghris, F. Laghrib, A. Farahi, S. Saqrane, M. Bakasse, S. Lahrich and M. A. El Mhammedi, Recent advances in the nanoparticles synthesis using plant extract: Applications and future recommendations, J. Mol. Struct., 2022, 1248, 131538, DOI:10.1016/j.molstruc.2021.131538.
- H. Veisi, A. Zohrabi, S. A. Kamangar, B. Karmakar, S. G. Saremi, K. Varmira and M. Hamelian, Green synthesis of Pd/Fe3O4 nanoparticles using Chamomile extract as highly active and recyclable catalyst for Suzuki coupling reaction, J. Organomet. Chem., 2021, 951, 122005, DOI:10.1016/j.jorganchem.2021.122005.
- A. A. Ganash and R. A. Alghamdi, Fabrication of a novel polyaniline/green-synthesized, silver-nanoparticle-modified carbon paste electrode for electrochemical sensing of lead ions, J. Chin. Chem. Soc., 2021, 68, 2312–2325, DOI:10.1002/jccs.202100348.
- M. Malakootian, H. Abolghasemi and H. Mahmoudi-Moghaddam, A novel electrochemical sensor based on the modified carbon paste using Eu3+ − doped NiO for simultaneous determination of Pb (II) and Cd (II) in food samples, J. Electroanal. Chem., 2020, 876, 114474, DOI:10.1016/j.jelechem.2020.114474.
- N. W. H. Guo, L. Peng, Y. Chen, Y. Liu, C. Li, H. Zhang and W. Yang, A novel ratiometric fluorescence sensor based on lanthanide-functionalized MOF for Hg2+ detection, Talanta, 2022, 250, 123710, DOI:10.1016/j.talanta.2022.123710.
- T. J. Jayeoye, U. Sirimahachai, P. Wattanasin and T. Rujiralai, Eco-friendly poly(aniline boronic acid)/gum tragacanth stabilized silver nanoparticles nanocomposite for selective sensing of Hg2+, Microchem. J., 2022, 182, 107949, DOI:10.1016/j.microc.2022.107949.
- Z. Alhalili, Green synthesis of copper oxide nanoparticles CuO NPs from Eucalyptus Globoulus leaf extract: Adsorption and design of experiments, Arabian J. Chem., 2022, 15, 103739, DOI:10.1016/j.arabjc.2022.103739.
- M. Ayad, G. El-Hefnawy and S. Zaghlol, Facile synthesis of polyaniline nanoparticles; its adsorption behavior, Chem. Eng. J., 2013, 217, 460–465, DOI:10.1016/j.cej.2012.11.099.
- P. Das, A. B. Deoghare and S. R. Maity, Synergistically improved thermal stability and electromagnetic interference shielding effectiveness (EMI SE) of in-situ synthesized polyaniline/sulphur doped reduced graphene oxide (PANI/S-RGO) nanocomposites, Ceram. Int., 2022, 48, 11031–11042, DOI:10.1016/j.ceramint.2021.12.323.
- P. Singh, K. R. B. Singh, J. Singh, S. N. Das and R. P. Singh, Tunable electrochemistry and efficient antibacterial activity of plant-mediated copper oxide nanoparticles synthesized by Annona squamosa seed extract for agricultural utility, RSC Adv., 2021, 11, 18050–18060, 10.1039/D1RA02382A.
- M. Kumar Ghosh, S. Sahu, I. Gupta and T. K. Ghorai, Green synthesis of copper nanoparticles from an extract of Jatropha curcas leaves: characterization, optical properties, CT-DNA binding and photocatalytic activity, RSC Adv., 2020, 10, 22027–22035, 10.1039/D0RA03186K.
- S. Yallappa, J. Manjanna, M. A. Sindhe, N. D. Satyanarayan, S. N. Pramod and K. Nagaraja, Microwave assisted rapid synthesis and biological evaluation of stable copper nanoparticles using T. arjuna bark extract, Spectrochim. Acta, Part A, 2013, 110, 108–115, DOI:10.1016/j.saa.2013.03.005.
- D. Raghunandan, B. D. Mahesh, S. Basavaraja, S. D. Balaji, S. Y. Manjunath and A. Venkatraman, Microwave-Assisted Rapid Extracellular Synthesis of Stable Bio-Functionalized Silver Nanoparticles from Guava (Psidiumguajava) Leaf Extract, J. Nanopart. Res., 2011, 13, 2021–2028, DOI:10.1007/s11051-010-9956-8.
- S. Sathiyavimal, E. F. Duran-Lara, S. Vasantharaj, M. Saravanan, A. Sabour, M. Alshiekheid, N. T. Lan Chi, K. Brindhadevi and A. Pugazhendhi, Green synthesis of copper oxide nanoparticles using Abutilon indicum leaves extract and their evaluation of antibacterial, anticancer in human A549 lung and MDA-MB-231 breast cancer cells, Food Chem. Toxicol., 2022, 168, 113330, DOI:10.1016/j.fct.2022.113330.
- K. Vishveshvar, M. V. A. Krishnan, K. Haribabu and S. Vishnuprasad, Green Synthesis of Copper Oxide Nanoparticles Using Ixiro coccinea Plant Leaves and its Characterization, BioNanoScience, 2018, 8, 554–558, DOI:10.1007/s12668-018-0508-5.
- H. Muhammad, I. A. Tahiri, M. Muhammad, Z. Masood, M. A. Versiani, O. Khaliq, M. Latif and M. Hnif, A comprehensive heterogeneous electron transfer rate constant evaluation of dissolved oxygen in DMSO at glassy carbon electrode measured by different electrochemical methods, J. Electroanal. Chem., 2016, 775, 157–162, DOI:10.1016/j.jelechem.2016.05.049.
- M. L. Chelaghmia, M. Nacef, A. M. Affoune, M. Pontié and T. Derabla, Facile Synthesis of Ni(OH)2 Modified Disposable Pencil Graphite Electrode and its Application for Highly Sensitive Non-enzymatic Glucose Sensor, Electroanalysis, 2018, 30, 1117–1124, DOI:10.1002/elan.201800002.
- E. Laviron, The use of linear potential sweep voltammetry and of a.c. voltammetry for the study of the surface electrochemical reaction of strongly adsorbed systems and of redox modified electrodes, J. Electroanal. Chem. Interfacial Electrochem., 1979, 100, 263–270, DOI:10.1016/S0022-0728(79)80167-9.
- E. Laviron, General expression of the linear potential sweep voltammogram in the case of diffusionless electrochemical systems, J. Electroanal. Chem. Interfacial Electrochem., 1979, 101, 19–28, DOI:10.1016/S0022-0728(79)80075-3.
- K. Zinoubi, H. Majdoub, H. Barhoumi, S. Boufi and N. Jaffrezic-Renault, Determination of trace heavy metal ions by anodic stripping voltammetry using nanofibrillated cellulose modified electrode, J. Electroanal. Chem., 2017, 799, 70–77, DOI:10.1016/j.jelechem.2017.05.039.
- X. Zhu, B. Liu, H. Hou, Z. Huang, K. M. Zeinu, L. Huang, X. Yuan, D. Guo, J. Hu and J. Yang, Alkaline intercalation of Ti3C2MXene for simultaneous electrochemical detection of Cd(II), Pb(II), Cu(II) and Hg(II), Electrochim. Acta, 2017, 248, 46–57, DOI:10.1016/j.electacta.2017.07.084.
- E. Bernalte, S. Arévalo, J. Pérez-Taborda, J. Wenk, P. Estrela, A. Avila and M. Di Lorenzo, Rapid and on-site simultaneous electrochemical detection of copper, lead and mercury in the Amazon river, Sens. Actuators, B, 2020, 307, 127620, DOI:10.1016/j.snb.2019.127620.
- J. H. Hwang, X. Wang, D. Zhao, M. M. Rex, H. J. Cho and W. H. Lee, A novel nanoporous bismuth electrode sensor for in situ heavy metal detection, Electrochim. Acta, 2019, 298, 440–448, DOI:10.1016/j.electacta.2018.12.122.
- J. Pizarro, R. Segura, D. Tapia, F. Navarro, F. Fuenzalida and M. J. Aguirre, Inexpensive and green electrochemical sensor for the determination of Cd (II) and Pb(II) by square wave anodic stripping voltammetry in bivalve mollusks, Food Chem., 2020, 321, 126682, DOI:10.1016/j.foodchem.2020.126682.
- H. Pu, S. Ruan, M. Yin, Q. Sun, Y. Zhang, P. Gao, X. Liang, W. Yin and H. Fa, Performance comparison of simultaneous detection Heavy-Metal ions based on carbon materials electrochemical sensor, Microchem. J., 2022, 181, 107711, DOI:10.1016/j.microc.2022.107711.
- S. Jeong, S. Kim, J. Han and J. J. Pak, Simple laser-induced graphene fiber electrode fabrication for high-performance heavy-metal sensing, Microchem. J., 2022, 172, 106950, DOI:10.1016/j.microc.2021.106950.
- M. Y. Pudza, Z. Z. Abidin, S. Abdul-Rashid, F. M. Yasin, A. S. M. Noor and J. Abdullah, Selective and simultaneous detection of cadmium, lead and copper by tapioca derived carbon dot–modified electrode, Environ. Sci. Pollut. Res., 2020, 27, 13315–13324, DOI:10.1007/s11356-020-07695-7.
- S. Mukherjee, S. Bhattachayya, K. Gosh, S. Pal, A. Halder, M. Naseri, M. Mohammadniaei, S. Sarkar, A. Gosh, Y. Sun and N. Bhattachayya, Sensory development for heavy metal detection: A review on translation from conventional analysis to field-portable sensor, Trends Food Sci. Technol., 2021, 109, 674–689, DOI:10.1016/j.tifs.2021.01.062.
- Y. Li, Y. Chen, H. Yu, L. Tian and Z. Wang, Portable and smart devices for monitoring heavy metal ions integrated with nanomaterials, Trends Anal. Chem., 2018, 98, 190–200, DOI:10.1016/j.trac.2017.11.011.
Footnote |
| † Electronic supplementary information (ESI) available. See DOI: https://doi.org/10.1039/d3ra02974c |
| This journal is © The Royal Society of Chemistry 2023 |