 Open Access Article
Rheological behaviour, setting time, compressive strength and microstructure of mortar incorporating supplementary cementitious materials and nano-silica
Chang Cai a,
Qian Suab,
Shaoning Huanga,
Fuhai Liab,
Hesong Jina,
Xian Yu*c,
Yuelei Liuc,
Yang Yangc and
Zhao Chen
 *a
*a
aInstitute of Civil Engineering Materials, School of Civil Engineering, Southwest Jiaotong University, Chengdu, Sichuan Province 610031, China. E-mail: chenzhao@swjtu.edu.cn
bKey Laboratory of High-Speed Railway Engineering, Ministry of Education, Southwest Jiaotong University, Chengdu 610031, China
cSichuan Energy Construction Engineering Group Co., Ltd, Chengdu 610021, China. E-mail: 86283477@qq.com
First published on 8th June 2023
Abstract
The setting time of the paste and the rheological properties and microstructure of the mortar after replacing OPC cement with silica fume (SF), fly ash cenosphere (FAC) and nano-silica are studied as a reference for shotcrete applications. The suggested contents of SF, FAC and nano-silica are around 5–7.5%, higher than 20% and 1–3%, respectively, to meet the initial setting time specification. Viscosity and yield stress of mortar are highly dependent on water/cement ratio and paste/sand ratio. At the higher water/cement ratio, viscosity is more based on the paste itself. For SF of 2.5–10%, viscosity and yield stress increase, and the flowability of the mixture decreases. For FAC of 5–25%, viscosity and yield stress increase with a lower rate than SF, and flowability increases at 5% and then decreases as FAC content increases, which, however, is at the same level as the control. When SF and FAC are both added, a tortuous behavior of viscosity is shown. As nano-silica is further added, significant increases in viscosity and yield stress are shown. The compressive strengths of mortar with different supplementary cementitious materials (SCMs) at early ages are close. The difference in compressive strength after 28 days of standard curing is significant. The SF5-FAC15 group exhibits the largest increase in strength for 32.82%. At the age of 2.5 h, the macropore areas distribution of SF5-FAC25-NS1.5 test groups were 31.96%, indicating the lowest macropore area distribution. The secondary hydration reaction of supplementary cementitious materials (SCMs) continuously generates products that fill the pores, and the ultrafine filling effect of nanomaterials improves the compactness of the mortar microstructure and reduces the macropore area distribution. The mercury intrusion test results of the SF5-FAC25-NS1.5 group show that the pores are concentrated within the range of 0.01 to 0.05 μm, and the most probable pore size is significantly smaller than that of the CTR group. As the overall replacement level of SCMs increases, the diffraction peak of calcium hydroxide gradually weakens.
Introduction
Rheological behavior of concrete or cementitious materials is important to the construction of these materials. The rheological behavior is directly related to the workability, pumpability, flowability, shootability, extrudability, and so on of the fresh mixture. For traditional concrete, a convenient slump test is commonly used to represent the workability of the concrete as the index for the construction of the concrete. However, with the development of concrete technologies in both construction methods and materials, the slump test alone is insufficient to represent all the properties related to the constructions. For instance, the ultra-high performance concrete (UHPC),1–3 self-consolidated concrete (SCC),4,5 3D printing concrete,6–10 shotcrete,11 etc. all need more complex tests on the rheological behavior of the mixture. The concrete can be treated as the composition of mortar mixture and coarse aggregate, and the rheological behavior of the concrete mixture is highly dependent on the rheological behavior of the mortar, which is related to the admixtures and supplementary cementitious materials (SCMs) added to the mixture. Under the same admixtures and mix proportions, the rheological behavior of mortar or paste is a critical indicator to predict the rheological characteristics of concrete.12 Moreover, the rheological measurements of mortar/paste were found to be more accurate with smaller scarcity compared to those of concrete. Therefore, rheological studies on mortar/paste have been studied extensively.13 Currently, research on the rheological properties of mortar focuses on the evolution of the microstructure of mortar influenced by organic rheology modifiers, the impact of the chemical structure of mortar on yield stress, the apparent viscosity and thixotropy of mortar, as well as the structural design of organic rheology modifiers such as superplasticizers and viscosity-modifying admixtures.14 Also, coarse aggregate is excluded in many new generations of cementitious materials, which are the mortar mixtures. Therefore, it is critical to study the rheological behavior of the mortar.Focus of this study is on the shotcrete mortar, which has higher cementitious materials content and sand/aggregate ratio than ordinary mortar to result in sufficient viscosity and cohesiveness of the mixture. The construction process of shotcrete is composed of pumping, spraying, attaching to the surface and rebounding back. During the pumping, the mixture should have a good flowability so that it can be pumped smoothly before spraying. After spraying, the mixture can be projected to the sprayed surfaces and build up the thickness. However, partial materials rebound back and fall to the ground. The quality of these processes is highly related to the shootability and viscosity of the mixtures. One of the major issues of shotcrete is the high rebound rate of materials, causing high waste of materials.15–19 The rebound rate of shotcrete is related to the spray process, condition of the sprayed surface, and the mixture design.20,21 It is well known that the water/binder ratio, sand/aggregate ratio, and chemical admixtures (water reducer, accelerator, etc.) of the mixture can directly affect the pumping and rebound performance of the shotcrete,22–24 and the effects of SCM and other additive materials on the shooting-rebound performance and rheological behavior have been under the investigations. The major rebound part of the shotcrete is coarse aggregate,25,26 while the flowability, shootability, and rebound behavior of shotcrete are highly based on the rheological properties of the mortar,21 which should be carefully studied especially when admixtures, SCMs, fibers, and other additives are added. The current studies mainly focused on the rheological behavior of the complete shotcrete mixture rather than the mortar. However, some contradictory results of SCMs on the shotcrete were found in the literature, which might be due to that different types of aggregate were used in the shotcrete mixture. Yun et al.27 studied the effects of admixtures, including silica fume (SF), air-entraining agent (AEA), superplasticizer, synthetic fiber, powdered polymer, and a viscosity agent on the rheological behavior of high-performance wet-mix shotcrete using a rheometer. From their study, it was found that both AEA and superplasticizer resulted in a decrease in both torque viscosity and flow resistance, thus improving the pumpability of the mixture, and SF contributed to increase flow resistance while slightly decrease the torque viscosity. Also, flow resistance was significantly reduced when polymers were added, thus not ideal for the pumpability of the mixtures. Pan et al.28 investigated the rebound behavior of wet-mix shotcrete with different additives, including polypropylene fiber, water reducing agent, accelerator, and an organic polymer tackifier. Rheological parameters, such as yield stress, plastic viscosity, air content, and bleeding rate were tested. Also, their effects on the rebound rate of shotcrete were analyzed and multiple linear regressions were conducted. In Choi's study, the effects of several SCMs and steel fibers on the rheological behavior of shotcrete containing crushed aggregate were investigated. Silica fume was found to exert a positive effect, while fly ash (FA) resulted in a negative effect on the pumpability and shootability of the shotcrete. A small amount of (≤5%) metakaolin also improved the pumping and shooting performance.29 It is beneficial to study the rheological behavior of the mortar itself and then incorporate the effects of different types of aggregate. Past studies mainly focused on the rheological behavior of general cement mortar, and this study focuses more on the mortar (which higher binder/sand ratio) suitable for the addition of accelerating admixtures.
Many studies investigate the enhancing properties of mortar or paste with the addition of nanomaterials. Sanchez et al.30 summarized that the main nanomaterials incorporated in the concrete include nano-silica, nano-titanium oxide, nano-iron, nano-alumina, nano-clay, and so on. Morsy et al.31 found the enhancing hybrid effects of carbon nanotube and nano-clay on the mechanical properties of cement mortar. In Zhang's study, a small amount of nano-silica resulted in the increase in strength of the slag mortar at different ages, and the increase was remarkable at early age.32 Oltulu et al.33 found a single addition of nano-silica, nano-alumina, or nano-Fe2O3 contributed to the compressive strengths. The binary and ternary additions of these nano-materials can further increase the strength and decrease the capillary absorption of the mortar. Stefanidou et al.34 reported that different dosages of nano-silica caused different effects on the strength of cement pastes. Liu et al.35 studied the effect of a nanoscale viscosity modifier on the cement paste and mortar; the modifier resulted in the improvement in mechanical properties of the mortar at low dosages and the increase in the plastic viscosity and yield stress of the paste. The benefits of using nano-materials in enhancing the microstructure, mechanical properties, and durability of the mortar were proved in most studies, while scarce study focused on nano-materials’ effects on the rheological behavior of the mortar, especially for those having certain construction requirements (such as shotcrete, 3D printing mixture, pumping concrete, and so on). To promote the applications of nanomaterials in cement-based composite, it is critical to not only analyze their effects on the mechanical and durability properties but also study and understand their effects on the rheological behavior of the mixture.
The 2nd hydration, morphological effects, and filler effects of FA and SF contribute to the denser microstructure, higher ultimate strength, and better durability of cement-based composite materials. With extreme fineness and high silica content, SF is a highly effective pozzolanic material and it can significantly reduce the permeability of the shotcrete mixture. However, its effects on the rheological behavior of the mixture showed inconsistence.27,29 Fly ash is one of the most common SCMs to improve the workability of concrete, and it is also pozzolanic but with a low reaction rate. Also, FA typically reduces the early strength and increases the later strength of cement-based mixture.36 The use of FA in shotcrete should be carefully considered, as relatively high dosages of FA can significantly increase the flowability, thus the mixture will fall of the sprayed surface. Also, it reduces the early strength of the mixture, which is contradictory to the requirement of shotcrete. With the development of nano-materials, a noval replacement of FA, named fly ash cenosphere (FAC), might be an option, which is produced by the dusty plasma separation technology on the fly ash.37,38 The particle of FAC is spherical much finer particle than normal FA, which is close to the size of SF. Therefore, FAC has the morphological effect, improving the workability of cement-based mixture. Also, with much finer size, the filler effects are enhanced. However, with finer and higher specific surface area, higher water absorption can be expected. Earlier, Hossain et al.39 found when SF and FAC were both added, the high early strength and good durability of the concrete were obtained as those with SF, while the ideal workability was also achieved, which was usually not the case when SF was added in the mixture individually. In Kara De Maeijer's study, replacement of cement with FAC contributes to better workability of paste and mortar.40 Also, concrete with different percentages of FAC had similar 7 days compressive strength to the control group without FAC. Moreover, better durability, including alkali–silica reaction, resistivity, and chloride impermeability, was obtained. Sujay et al.41 found an optimum combination of FAC and nano-silica in concrete to obtain the improved durability with lower porosity and permeability of high-performance concrete. Lin et al.42 also found the inclusion of FAC with SF contributed better workability, improved mechanical properties, and reduced permeability of the concrete.
Few studies investigated the performance of mortar that incorporates SF, FAC, and nano-silica, especially on their effects on the rheological behavior of the mixture. Most studies on mortar or concrete with SF have proved the efficiency of SF for improving the mechanical properties and durability. While no unified conclusion was drawn on its effects on rheological behavior. The research on the effects of FAC on the mortar is scarce, which requires more investigations for more applications. From the published literature, the combined effects of SF, FAC, and nano-silica on the rheological behavior of mortar have not been studied before. As the mix design of mortar is intended for the addition of accelerator, this study provides a good reference for shotcrete mixture. Moreover, the effects of SF, FAC, and nano-silica on the set time of the paste with accelerator were also analyzed.
Experiment and materials
Raw materials
Silica fume, a noval fly ash cenosphere, and nano-silica (or nano-SiO2) were used to replace cement in the mortar to study their effects on the rheological behavior of the mortar. The appearances, colour, and quite fine particle size of the five raw materials are displayed in Fig. 1.International Organization for Standardization (ISO) standard sand was used as the fine aggregate to mix mortar in accordance with ASTM C33-03.43 The size of the sand ranges in 0.08–2.00 mm, which is well-graded. The fineness modulus of the sand is 3.0. P.O 42.5 R Portland cement (composition detection of cement in accordance with ASTM C150 (ref. 44)) from Lafarge Cement Co., Ltd was used. Silica fume is a common fine SCM used in cementitious material for its filling effect, second hydration effects, and viscosity increasing effect. The tested parameters of SF are shown in Table 1. X-ray fluorescence (XRF) test was conducted to obtain the percentages of each chemical components in SF as shown in Table 2. FAC was developed by Chengdu Hengruiyuan Environmental Protection Materials Co., Ltd and its physical properties are shown in Table 3. To analyze the bonding and agglomeration effects among FAC particles, scanning electron microscopy (SEM) was employed to magnify the microstructures of FAC at magnifications of 20![[thin space (1/6-em)]](https://www.rsc.org/images/entities/char_2009.gif) 000×, 50
000×, 50![[thin space (1/6-em)]](https://www.rsc.org/images/entities/char_2009.gif) 000×, 100
000×, 100![[thin space (1/6-em)]](https://www.rsc.org/images/entities/char_2009.gif) 000×, and 200
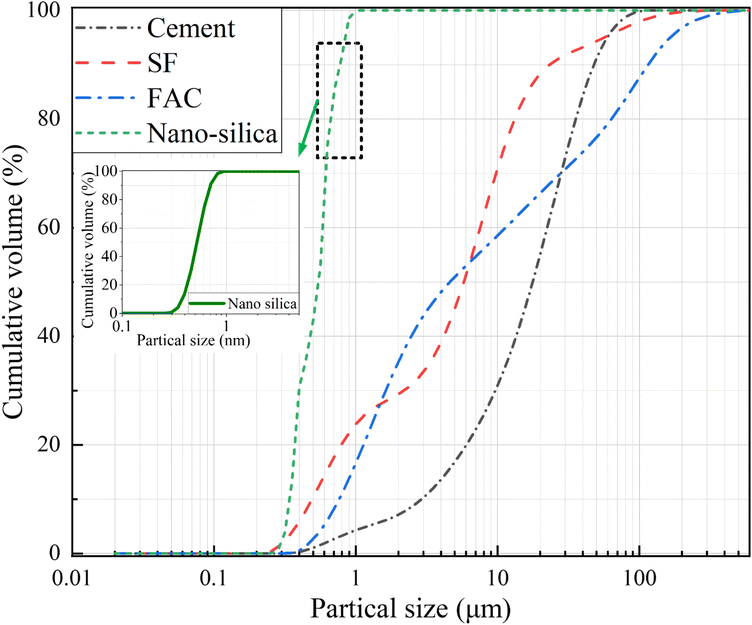
000×, and 200![[thin space (1/6-em)]](https://www.rsc.org/images/entities/char_2009.gif) 000× for analysis. By observing its microstructure, it can be deduced that the particles exhibit a spherical shape, with a relatively broad particle size distribution. The scanning electron microscopy (SEM) of the FAC is shown in Fig. 2. The chemical components of FAC using XRF are shown in Table 2. Nano-silica powder that is composed of high purity amorphous silica was also added in the mortar. The chemical components of nano-silica using XRF is shown in Table 2. An alkali-free accelerator admixture by Sichuan Yutong Construction Materials Co., Ltd was used. The particle size distribution curve of raw materials is shown in Fig. 3. Also, considering that the particle size of nano-silica ranges between 0.5 nm and 1 nm, this part in Fig. 3 has been enlarged for a better visualization.
000× for analysis. By observing its microstructure, it can be deduced that the particles exhibit a spherical shape, with a relatively broad particle size distribution. The scanning electron microscopy (SEM) of the FAC is shown in Fig. 2. The chemical components of FAC using XRF are shown in Table 2. Nano-silica powder that is composed of high purity amorphous silica was also added in the mortar. The chemical components of nano-silica using XRF is shown in Table 2. An alkali-free accelerator admixture by Sichuan Yutong Construction Materials Co., Ltd was used. The particle size distribution curve of raw materials is shown in Fig. 3. Also, considering that the particle size of nano-silica ranges between 0.5 nm and 1 nm, this part in Fig. 3 has been enlarged for a better visualization.
| Ignition loss | Water demand ratio | Specific surface area | 28 day activity index | Cl− | Alkaline |
|---|---|---|---|---|---|
| 1.50% | 106.00% | 22.7 m2 kg−1 | >85% | 0.001% | 0.20% |
| Component | Silica fume | Fly ash cenosphere | Nano-silica | Cement |
|---|---|---|---|---|
| SiO2 | 97.10 | 56.59 | 98.99 | 21.75 |
| Al2O3 | 0.26 | 20.31 | 0.08 | 4.60 |
| CaO | 0.28 | 9.78 | 0.07 | 64.54 |
| Fe2O3 | 0.07 | 6.74 | 0.06 | 3.46 |
| K2O | 0.72 | 1.64 | 0.00 | 0.00 |
| SO3 | 0.84 | 0.92 | 0.04 | 0.46 |
| MgO | 0.29 | 0.65 | 0.00 | 3.56 |
| Na2O | 0.16 | 0.64 | 0.08 | 0.00 |
| LOI | 0.28 | 2.73 | 0.68 | 1.63 |
| Ignition loss | Grain shape | Specific surface area | Apparent density | Packing density | Color | Particle size distribution | ||
|---|---|---|---|---|---|---|---|---|
| <3% | Spherical | 10.99 m2 g−1 | 2.9 kg cm−3 | 750 kg m−3 | Gray to light gray | D10 ≤ 0.5 μm | D50 ≤ 3 μm | D95 ≤ 10 μm |
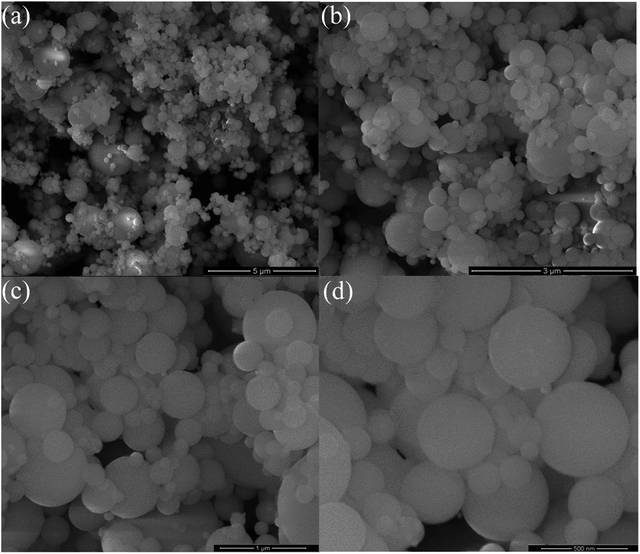 | ||
Fig. 2 Scanning electron microscope of fly ash cenosphere in different scales: (a) 20![[thin space (1/6-em)]](https://www.rsc.org/images/entities/char_2009.gif) 000×, (b) 50 000×, (b) 50![[thin space (1/6-em)]](https://www.rsc.org/images/entities/char_2009.gif) 000×, (c) 10 000×, (c) 10![[thin space (1/6-em)]](https://www.rsc.org/images/entities/char_2009.gif) 0000×, (d) 2 0000×, (d) 2![[thin space (1/6-em)]](https://www.rsc.org/images/entities/char_2009.gif) 00 00![[thin space (1/6-em)]](https://www.rsc.org/images/entities/char_2009.gif) 000×. 000×. | ||
Mix proportion and test groups
The mix proportion and test groups of paste with different SCMs and nano-silica content are shown in Table 4. The effects of general mix design considerations, which are w/b ratio and paste/sand ratio, are included. As shown in Table 5, the ratio of cement paste to sand is fixed at 0.54 and w/b ratio ranges from 0.3–0.5. To study the effects of paste/sand ratio, with w/b ratio fixed at 0.4, paste/sand ratio ranges from 0.43–0.67. The mix proportion and test groups of mortar with different SCMs and nano-silica content are shown in Table 6. CTRL represents the control group. SF2.5, FAC5 and NS0.5 represent 2.5%, 5% and 0.5% of the cementitious materials respectively. wb30 indicates that the water/binder ratio of mortar is 0.30, and PS43 indicates that the paste/sand ratio of mortar is 0.43.| ID | Cement (g) | Water (g) | SF (g) | FAC (g) | Nano-silica (g) | Accelerator (%) |
|---|---|---|---|---|---|---|
| CTRL | 900.0 | 324.09 | 0 | 0 | 0 | 7 |
| SF2.5 | 877.5 | 324.09 | 22.5 | 0 | 0 | 7 |
| SF5 | 855.0 | 324.09 | 45 | 0 | 0 | 7 |
| SF7.5 | 832.5 | 324.09 | 67.5 | 0 | 0 | 7 |
| SF10 | 810.0 | 324.09 | 90 | 0 | 0 | 7 |
| SF12.5 | 787.5 | 324.09 | 112.5 | 0 | 0 | 7 |
| FAC5 | 855.0 | 324.09 | 0 | 45 | 0 | 7 |
| FAC10 | 810 | 324.09 | 0 | 90 | 0 | 7 |
| FAC15 | 765.0 | 324.09 | 0 | 135 | 0 | 7 |
| FAC20 | 720 | 324.09 | 0 | 180 | 0 | 7 |
| FAC25 | 675.0 | 324.09 | 0 | 225 | 0 | 7 |
| SF2.5-FAC5 | 832.5 | 324.09 | 22.5 | 45 | 0 | 7 |
| SF2.5-FAC15 | 742.5.0 | 324.09 | 22.5 | 135 | 0 | 7 |
| SF2.5-FAC25 | 652.5.0 | 324.09 | 22.5 | 225 | 0 | 7 |
| SF5-FAC5 | 810.0 | 324.09 | 45 | 45 | 0 | 7 |
| SF5-FAC15 | 720.0 | 324.09 | 45 | 135 | 0 | 7 |
| SF5-FAC25 | 630.0 | 324.09 | 45 | 225 | 0 | 7 |
| SF7.5-FAC5 | 787.5 | 324.09 | 67.5 | 45 | 0 | 7 |
| SF7.5-FAC15 | 697.5 | 324.09 | 67.5 | 135 | 0 | 7 |
| SF7.5-FAC25 | 607.5 | 324.09 | 67.5 | 225 | 0 | 7 |
| SF5-FAC25-NS0.5 | 630.0 | 324.09 | 45 | 225 | 4.5 | 7 |
| SF5-FAC25-NS1.0 | 630.0 | 324.09 | 45 | 225 | 9 | 7 |
| SF5-FAC25-NS1.5 | 630.0 | 324.09 | 45 | 225 | 13.5 | 7 |
| SF5-FAC25-NS2.0 | 630.0 | 324.09 | 45 | 225 | 18 | 7 |
| SF5-FAC25-NS2.5 | 630.0 | 324.09 | 45 | 225 | 22.5 | 7 |
| SF5-FAC25-NS3.0 | 630.0 | 324.09 | 45 | 225 | 27 | 7 |
| ID | w/c | Paste/sand | Cement (g) | Sand (g) |
|---|---|---|---|---|
| wb30 | 0.3 | 0.54 | 559 | 1350 |
| wb35 | 0.35 | 0.54 | 538 | 1350 |
| wb40 | 0.4 | 0.54 | 519 | 1350 |
| wb45 | 0.45 | 0.54 | 501 | 1350 |
| wb50 | 0.5 | 0.54 | 485 | 1350 |
| PS43 | 0.4 | 0.43 | 413 | 1350 |
| PS48 | 0.4 | 0.48 | 464 | 1350 |
| PS54 | 0.4 | 0.54 | 519 | 1350 |
| PS60 | 0.4 | 0.60 | 579 | 1350 |
| PS67 | 0.4 | 0.67 | 643 | 1350 |
| ID | Cement (g) | Water (g) | SF (g) | FAC (g) | Nano-silica (g) | ISO standard sand (g) |
|---|---|---|---|---|---|---|
| CTRL | 900.0 | 324.09 | 0 | 0 | 0 | 1350 |
| SF2.5 | 877.5 | 324.09 | 22.5 | 0 | 0 | 1350 |
| SF5 | 855.0 | 324.09 | 45 | 0 | 0 | 1350 |
| SF7.5 | 832.5 | 324.09 | 67.5 | 0 | 0 | 1350 |
| SF10 | 810.0 | 324.09 | 90 | 0 | 0 | 1350 |
| FAC5 | 855.0 | 324.09 | 0 | 45 | 0 | 1350 |
| FAC15 | 765.0 | 324.09 | 0 | 135 | 0 | 1350 |
| FAC25 | 675.0 | 324.09 | 0 | 225 | 0 | 1350 |
| SF5-FAC5 | 810.0 | 324.09 | 45 | 45 | 0 | 1350 |
| SF5-FAC15 | 720.0 | 324.09 | 45 | 135 | 0 | 1350 |
| SF5-FAC25 | 630.0 | 324.09 | 45 | 225 | 0 | 1350 |
| SF5-FAC25-NS0.5 | 630.0 | 324.09 | 45 | 225 | 4.5 | 1350 |
| SF5-FAC25-NS1.5 | 630.0 | 324.09 | 45 | 225 | 13.5 | 1350 |
| SF5-FAC25-NS2.5 | 630.0 | 324.09 | 45 | 225 | 22.5 | 1350 |
Test programs and procedures
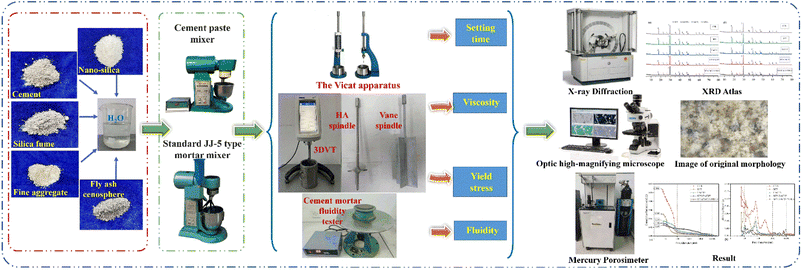
The overall test programs and procedures are shown in Fig. 4. Based on ISO 9597:2008 (ref. 45) and ISO 679:1989,46 the paste and the mortar was mixed and prepared by a cement paste mixer and a mortar mixer, respectively. Based on ISO 9597:2008,45 the Vicat apparatus was used to measure the initial and final setting time of the cementitious paste with different SCMs and nano-silica. A Brookfield DV3T Viscometer was used to measure the viscosity and yield stress of the mortar as in Tables 5 and 6. HA spindles were used to measure viscosity, and vane spindles were used to measure the yield stress of the mortar. Different rotating speeds (20, 30, 50, 60, 100 RPM) were included in viscosity measurement. Flow table tests were conducted for measuring the fluidity of the mortar in accordance with ASTM C1437-20.47 The expanded diameters of the specimen were used as the indicator of the fluidity of the mortar. The microstructure of mortar was investigated by optic high-magnifying microscope (OHMM), mercury intrusion porosimetry (MIP), and X-ray diffraction (XRD). According to OHMM, firstly, the freshly stirred mortar was evenly applied to the slide and flattened by another slide. Secondly, the glass slide containing mortar was placed on the observation table of the OHMM and fixed for imaging scanning. Finally, through the depth of field superposition technique of the OHMM, the variation law of macropore area distribution at the same position of mortar was observed every 0.5 h. According to MIP and XRD, mortar were placed in an oven at a temperature of 55 °C to dry and then prepared into small cubes with flat surfaces to obtain samples for XRD test by the D/Max-RB rotating anode X-ray diffractometer and for MIP test by the Micromeritics 9500 mercury porosimeter. XRD was employed to analyze the hydration products of both early and later stage mortar samples, while MIP was utilized to assess the porosity and pore size distribution of later stage mortar specimens.Results and discussion
Effects of SCMs and nano-silica on the setting time of paste with accelerator
Setting time is an important index for cementitious material added with accelerator admixture used for shotcrete. The added SCMs in the mortar mixture intended to modify the rheological behavior of the mortar should be on the prerequisite that its addition will not result in the setting time of the mixture that is not in accordance with GB/T 35159-2017.48 The required initial setting time (IST) and final setting time (FST) of cement added with the accelerator should no more than 5 and 12 minutes, respectively.According to the paste test groups in Table 4, the setting time test was carried out. For all the setting time tests, after the IST, the FST of the paste reaches very quickly. Therefore, the following comparisons as shown in Fig. 6 are for IST of the paste, which is representative of the effects of SCMs and nano-silica on the set time of the paste with the accelerator. As shown in Fig. 6(a), as the SF content increases and before it reaches 7.5%, IST increases initially gradually, but within the requirement of within 5 minutes. When the SF content reaches 7.5%, a sudden drop in IST occurs (3 min), which is shorter than the control. However, as the SF content further increases to 10% or higher percentages, IST increases to more than 6 min, failing to meet the requirement. The setting time is directly related to the hydration of the cementitious materials.
(a) At lower levels of SF content (0–5%), there are more cement particles and the hydration process is relatively thorough, resulting in a higher amount of calcium hydroxide (CH) being produced. This provides sufficient CH for the hydration of SiO2 in SF. Consequently, at this stage, the hydration reaction of the cementitious material is slower and undergoes a complex hydration process involving both cement hydration and SF hydration. The hydration equation for SF is shown below.49
| SiO2 + Ca(OH)2 + H2O → xCaO·SiO2·yH2O | (1) |
(b) When SF is added at a dosage of 5% to 7.5%, the higher amount of SF leads to a decrease in the number of cement particles. The complex hydration reactions result in the precipitation of various compounds within the matrix and even on the surface of SF particles, thereby hindering further hydration of the SF. Consequently, the predominant hydration is that of cement, leading to a shorter IST.
(c) When the dosage of SF is relatively high (7.5% to 12.5%), the increased presence of SF particles in the matrix leads to the following effects: despite some SF particles being encapsulated in the precipitate, the larger dosage of SF substitutes cement particles, resulting in a more thorough dispersion of SF particles in the matrix. This increased dispersion enhances the contact area and probability of interaction between SF and cement hydration products. Consequently, the consumption of CH in the matrix is significantly increased, thereby prolonging the hydration process and extending the IST.
Therefore, 7.5% serves as the threshold for the dosage of SF. As a result, the IST initially increases, followed by a decrease, and then increases again with the increase in SF percentage. The mechanism diagram of the reaction is illustrated in Fig. 5.
As shown in Fig. 6(b), with the increase of FAC to 15%, IST increases significantly; IST at FAC = 15% is almost 5 times that of the control, failing to meet the set time requirement of shotcrete mortar. As shown in Fig. 6(c), when both SF and FAC are added to the paste, IST of the paste generally meets the requirement for different percentages of SF and FAC except for one case (SF = 2.5%, FAC = 5%) with IST = 6 minutes, which is slightly over the requirement of 5 minutes. When SF is fixed at 2.5% or 7.5% and FAC is added, IST increases at FAC = 5%, and then decreases and tends to be stable as FAC further increases. When SF is fixed at 5%, adding FAC results in the decrease of IST. The decreasing effects are slightly compromised as FAC further increases. In summary, it is suggested to have SF fixed at about above 5% with different percentages of FAC so that the setting of the mortar meets the requirement when the accelerator is added. As shown in Fig. 6(d), when 0.5% nano-silica is further added, IST increases significantly (from about 3–6 min). As the nano-silica content further increases, IST decreases gradually within the requirement.
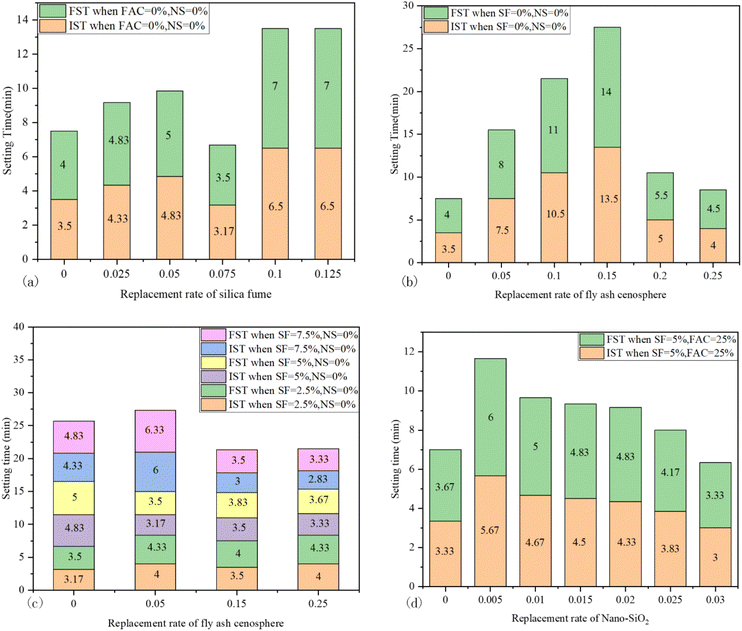 | ||
| Fig. 6 IST and FST of paste with: (a) different SF content; (b) different FAC content; (c) different SF and FAC content; (d) different SF, FAC, and nano-silica. | ||
Effects of w/b and paste/sand on the rheological behavior of mortar
Results of viscosity at 100 RPM and yield stress of mortar in different w/b and paste/sand ratios in Table 5 are shown in Fig. 7. From Fig. 7(a), as w/c ratio increases from 0.3 to 0.5, the viscosity decreases significantly from around 3000 cp to 1000 cp, and the relationship is best described by an exponential function; at a lower level of w/c ratio, the effects of w/c ratio on viscosity are more prominent compared to the higher w/c ratio range. A similar trend is shown for yield stress as it decreases with w/c ratio exponentially before w/c ratio reaches 0.5 and the complete trend is best described by sine functions; there is an abnormal point when w/c ratio = 0.5, which shows higher yield stress than that when w/c ratio = 0.45. These results are as expected and are consistent with the literature.35 A higher w/c ratio indicates that there is more free water to increase the fluidity and workability of the mortar, thus, the consistency and viscosity of the mortar are lower, meaning that the mixture can be broken up by lower stress, thus lower yield stress.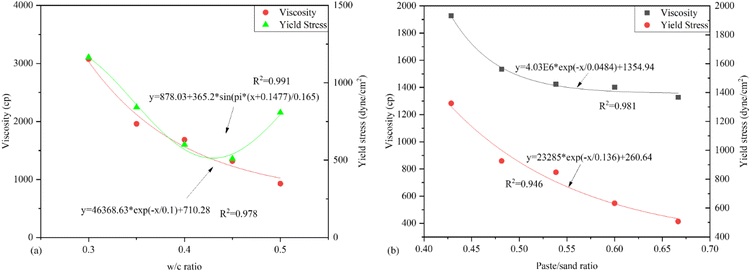 | ||
| Fig. 7 Viscosity and yield stress of mortar at 100 RPM: (a) at different w/c ratio with paste/sand ratio fixed at 0.54; (b) at different paste/sand ratio with w/c ratio fixed at 0.4. | ||
From Fig. 7(b), at w/c = 0.4, as the paste/sand ratio increases from 0.43 to 0.67, viscosity decreases and the decrease rate decreases; from 0.43 to 0.48, there is a 20% drop in viscosity, and from 0.48 to 0.67, the decrease range becomes much smaller, most of which are lower than 10%. As the paste/sand ratio increases, the yield stress decreases with a steady decrease trend; as paste/sand ratio increases, the decrease range decreases slightly.
When w/c ratio remains at 0.4, a higher paste/sand ratio results in lower viscosity and yield stress. When there is relatively less sand (or more paste content) in the mortar mixture, the consistency of the mixture is lower, thus viscosity and yield stress are lower. But as the relative proportion of sand content continues to decrease, the viscosity and yield stress of the mortar change almost insignificantly, so the rheological behavior of the mixture is more dependent on the paste itself than the whole mortar mixture. Therefore, when w/c ratio of paste is fixed, the viscosity of the mixture only changes slightly with the increase of paste/sand ratio and is mainly dependent on the w/c ratio of the paste.
On the other hand, the influence of the paste/sand ratio on yield stress is more significant since a fresh mixture with smaller sand proportion (or larger mortar proportion) can be more easily broken up; for larger sand proportion, more efforts are required to break the bond between sand particles to work on the mixture, while with little or no sand, there is only cement paste to be worked on. Therefore, as shown in Fig. 7(b), comparing different p/s, in the first half of the curve where p/s is smaller, the sand content is more, and the yield stress decreases more slowly; in the second half of the curve where p/s is larger, the sand content is less, and the yield stress decreases sharply.
Effects of SCM and nano-silica on rheological behavior of mortar for shotcrete
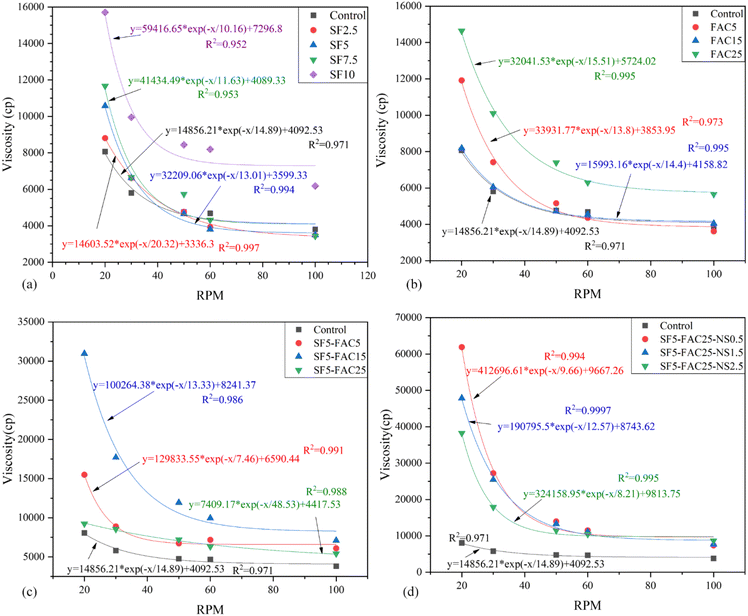 | ||
| Fig. 8 Viscosity of mortar at different RPM with different replacement rate of: (a) SF; (b) FAC; (c) SF + FAC; (d) SF + FAC + nano-silica. | ||
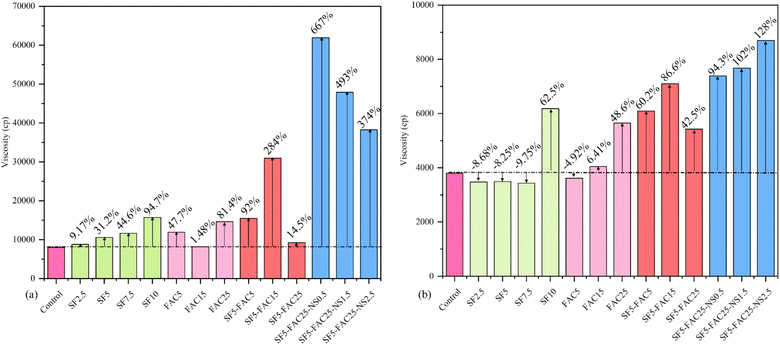
Viscosities of different SF contents compared to the control group are shown in Fig. 8(a), compared to the control group, as the SF content increases from 2.5–10%, the viscosity increases at each level of rotation speed. This is due to the fineness, high surface area, and high water absorption of silica fume during the hydration of cementitious materials, resulting in a loss in the fluidity of the mixture.50 Thus, the viscosity of the mixture increases. It is noted that the differences among different content of SF are getting smaller with higher speed; at 100 RPM, the viscosities of the control, 2.5% SF, 5% SF, and 7.5% SF are close to each other with differences of no more than 10%. The greater the speed, the more adequate the stirring, which can increase the hydration reaction of SF and the contact area between the hydration products of SF and the sand particles, allowing partial SF, which participates in the hydration, to be fully reacted; at the same time, other excessive SF content does not participate in the reaction and acts as filler particles. Therefore, when the rotation speed is high, after the SF content exceeds the actual value involved in the hydration reaction, regardless how the rotation speed increases, the viscosity of the mixture is not increasing. However, when SF content increases to 10% SF, there is a significant increase in viscosity regardless of the rotation speeds of the spindle. This is because after the SF content is sufficiently high that it far exceeds the actual amount required to participate in the reaction, the excess SF will reduce the fluidity of the mixture, and even wrap on the surface of the cemented mixture after the reaction, increasing its viscosity.
Viscosities of different FAC contents compared to the control group are shown in Fig. 8(b). Similarly, as the FAC content increases from 5–25%, the viscosity increases first and then decreases at each level of rotation speed. At 25% FAC, viscosity at each rotation speed level significantly increases. In comparison, at 2.5–10% SF and 5–25% FAC, the viscosities of the mixtures are at the close level. This is explainable as FAC has similar size as SF with high water absorption, causing low fluidity and high viscosity. However, although the viscosities are close, it is noted when working on the mixtures, the ones with FAC are more workable, smooth, and soft while those with SF are hard to be workable and are dry.
In Fig. 8(c), a combination of SF and FAC is used to replace cement, in which SF is fixed at 5%, and FAC increases from 5 to 25%. At any level of rotation speed, the viscosity of SF5-FAC5 test group is higher than that of either the CTRL or the SF5. As FAC increases to 15%, the viscosity increases significantly. However, when FAC content continues increasing to 25%, the viscosity decreases, especially at a lower RPM.
In Fig. 8(d), for SF of 5% and FAC of 25%, nano-silica is further added. It is evident that the addition of nano-silica significantly increases the viscosity of the mixture; viscosities of mixtures with nano-silica are the highest among all the test scenarios. Also, it is observed that at lower rotation speeds (20 RPM), smaller dosages of nano-silica result in higher viscosities than that with large dosages, while at the higher rotation speed (100 RPM), large dosages of nano-silica show slightly higher viscosity of the mixture. At low speed, small dose of nano-silica is easier to stir and react uniformly, so the viscosity is higher; while at high speed, large dose of nano-silica can be more fully stirred and added to the reaction, so at this time, instead of large dose of nano-silica has a higher viscosity.
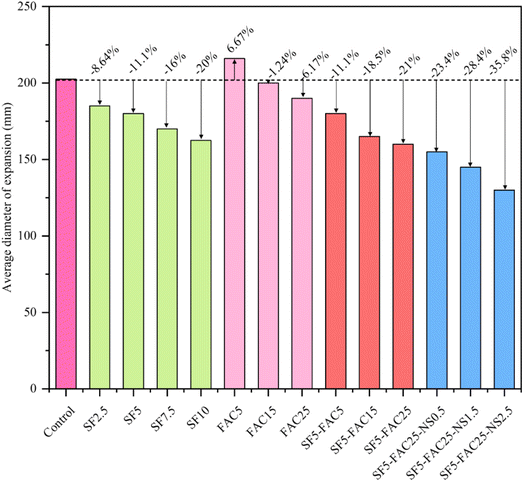
More distinct comparisons among different scenarios of SCMs and nano-silica are shown in Fig. 9. Replacement of cement in the mortar with the combination of SF and FAC helps to increase the viscosity evidently. Further addition of nano-silica results in a significant improvement in the viscosity, especially at lower rotation speed (20 RPM). At high speed (100 RPM), increasing the content of nano-silica increases the viscosity of mortar while at the lower rotation (20 RPM) speed it decreases with the increasing of nano-silica content. Therefore, it is recommended to use SF and FAC combinedly to replace cement with the addition of nano-silica to improve the viscosity of mortar, and the content of nano-silica is dependent on the rotation speed, which is related to the construction process.
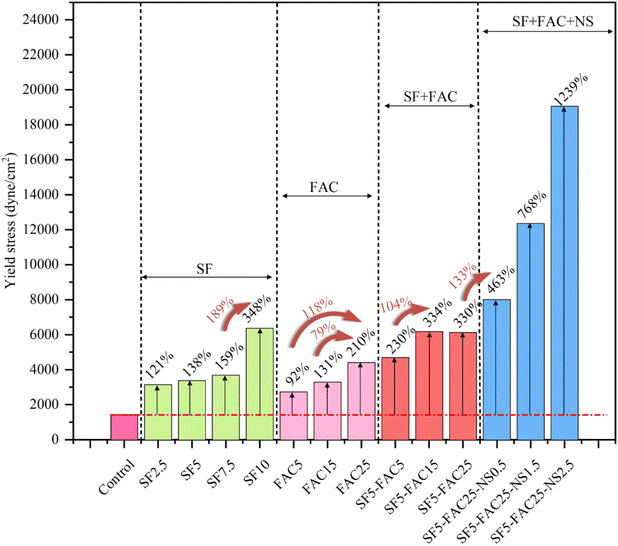
Replacement of cement with FAC from 5–25% results in a significant increase of yield stress of the mortar as well; the yield stress at 5% FAC increases 92% compared to the control group. The further increase of FAC content results in steady increase in yield stress; yield stress of 25% FAC is 79% higher than that of 15% FAC, which increases 118% than that of 5% FAC mortar.
A combination of 5% SF and 5–25% FAC shows higher yield stress than either SF or FAC is used individually in the mortar, except for that with 10% SF. It is observed that with SF fixed at 5%, FAC of 15% is about 104% higher than that with FAC of 5%. However, a further increase of FAC from 15 to 25% does not result in a further increase in yield stress of the mortar, and it is noted that the viscosity actually decreases at this circumstance (Fig. 9).
For replacement of 5% SF and 25% FAC, addition of nano-silica shows a further considerable increase in the yield stress. Compared to 5% SF and 25% FAC, addition of 0.5% nano-silica brings in about 133% increase in yield stress, which is 5.63 times of the control. At the dosage of nano-silica increases from 0.5% to 1.5 and 2.5%, a steady and high increase rate of yield stress of 776% is observed. At 2.5% nano-silica, the yield stress reaches 19![[thin space (1/6-em)]](https://www.rsc.org/images/entities/char_2009.gif) 060 dyne per cm2, which is about 3.11 times of the those without nano-silica (6124 dynes per cm2) and 13.39 times of the control (1423 dyne per cm2). Compared to the effects on the viscosity, the effects on the yield stress from nano-silica are more extrusive.
060 dyne per cm2, which is about 3.11 times of the those without nano-silica (6124 dynes per cm2) and 13.39 times of the control (1423 dyne per cm2). Compared to the effects on the viscosity, the effects on the yield stress from nano-silica are more extrusive.
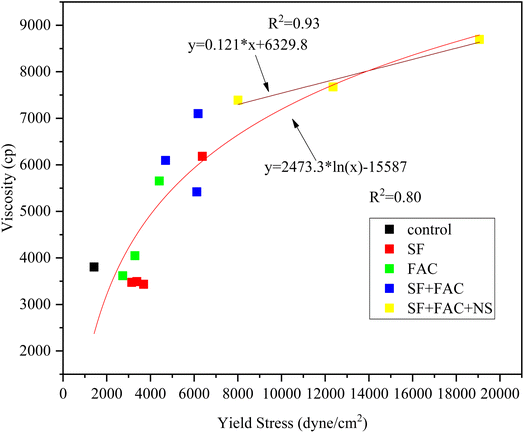
As shown in Fig. 11, the relation between viscosity and yield stress can be best described by a logarithm function, except the polynomial. In general, the viscosity and yield stress are highly correlated; the Pearson coefficient of viscosity and yield stress is 0.85. When only SCMs (SF and FAC) are added, the viscosity of mortar increases as yield stress increases at a steady rate. It is noted that when only SF is added with less than 10%, viscosity is almost constant and the yield stress increases slightly with the increase of the SF dosage. But when SF content reaches 10%, a boost occurs for both the yield stress and viscosity. While after nano-silica is added, the curve becomes more flatten; the viscosity increases slower than the yield stress of the mortar. Also, the relationship becomes more linear.
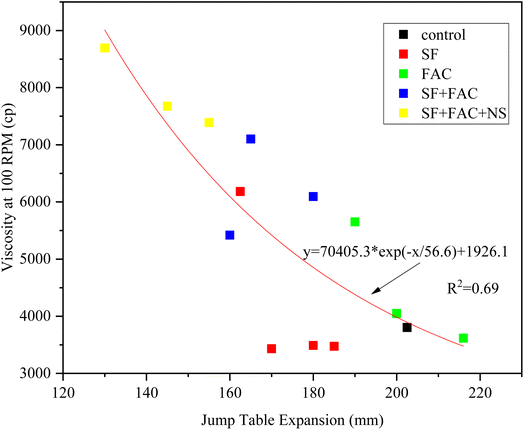
The relationship between the viscosity at 100 RPM and the fluidity of mortar with SCMs and nano-silica is shown in Fig. 13. The viscosity and fluidity are negatively correlated (the R2 = 0.69). The inconsistency mainly occurs at SF of 2.5–7.5%, in which the viscosity does not show much difference among different SF contents. Nuruzzaman et al. studied the relationship between the plastic viscosity and yield stress of mortar and its slump flow, and established linear regression models on each relationship with a fitting accuracy (R2) of 0.776 and 0.983, respectively.13
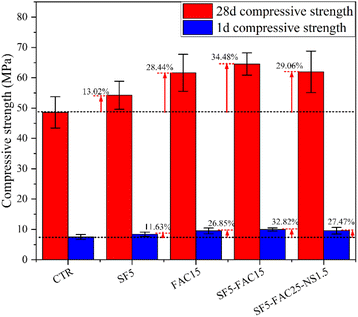
The difference in compressive strength after 28 days of standard curing is significant; the compressive strength is 48.60 MPa, 61.65 MPa, 54.25 MPa, 64.55 MPa, and 61.95 MPa, respectively, for the CTR, SF5, FAC15, SF5-FAC15, and SF5-FAC25-NS1.5 group. The strengths of groups with SCMs (SF5, FAC15, SF5-FAC15, and SF5-FAC25-NS1.5 group) increased 11.63%, 26.85%, 32.82%, and 27.47%, respectively, compared to that of the control group. Among them, the SF5-FAC15 group exhibits the largest increase in strength. This is attributed to the presence of both silica and a certain amount of alumina in the FAC, leading to a dual hydration effect. Additionally, both SF and FAC have pozzolanic effects, enabling secondary hydration.
Micro analysis of mortar
The variation of the macropore area distribution and age of mortar under different test groups is shown in Fig. 15. At the age of 2.5 h, the macropore areas of CTRL, SF5, FAC15, SF5-FAC15, SF5-FAC25-NS1.5 test groups were 39.57%, 37.90%, 36.71, 35.18%, and 31.96%, respectively. This is because the fineness of the cement-based materials plays a great role in the hydration process. The finer the cementitious materials are, the more fully the hydration reaction is carried out, the more the hydration products are filled into the pores and the smaller the final macroporous area distribution is. The fineness of cement, SF, FAC and nano-silica decreased in this order. Therefore, the change of macroporous area distribution in test groups showed the above change variation.
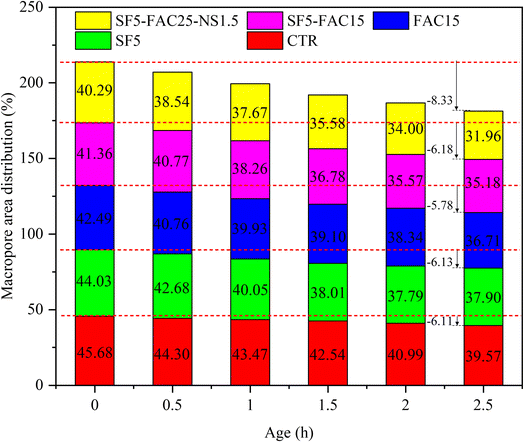 | ||
| Fig. 15 Relationship between macropore area distribution and age of mortar with different SCMs and nano-silica. | ||
The analysis of SF5-FAC25-NS1.5 test group showed that with the increase of age, the macropore area distribution became smaller and smaller. Compared with other test groups, the difference between the macropore distribution area of 2.5 h and the initial value was the largest, reaching 8.33%. The secondary hydration reaction of SCMs (SF, FAC) continuously generates products to fill the pores, and the ultrafine filling effect of nanomaterials makes the microstructure of mortar more compact and reduces the macropore area distribution.
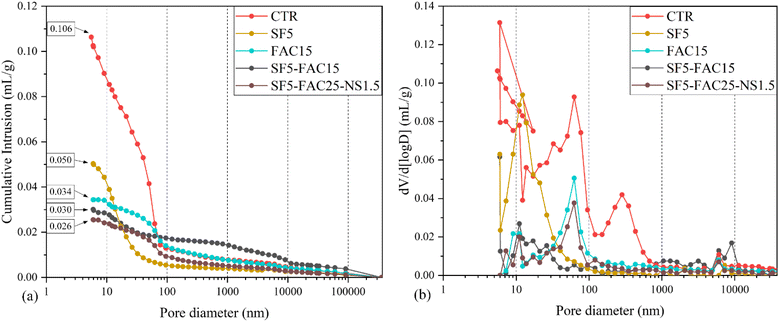
The mercury intrusion test results of the SF5-FAC25-NS1.5 group show that the pore volume of gel pores (<0.01 μm) and transitional pores (0.01–0.1 μm) is almost negligible, indicating a highly dense gel structure. The pores are concentrated within the range of 0.01 to 0.05 μm, and the most probable pore size is significantly smaller than that of the CTR group. This is attributed to the volcanic ash effect of the supplementary cementitious material, which acts as a filler by generating secondary hydration products, leading to a denser structure.
Conclusions
The setting time of the paste and the rheological properties and microstructure of the mortar after replacing OPC cement with SCMs (SF, FAC) and nano-silica were studied. The conclusions of this study can be drawn as follows.(1) The mortar with supplementary cementitious materials (SCMs) and nano-silica in this study is intended for shotcrete applications. It is critical to see if adding these SCMs affect the setting time of the mortar with accelerator. When SF is added in mortar solely, IST increases slowly as SF increases and drops suddenly at SF = 7.5%. A further increase of SF results in significant increases in IST. Therefore, SF is suggested to be around 5–7.5%, considering its effects on both strength and rheological behaviour of the mortar. When FAC is added in mortar individually, IST increases extraordinarily and gradually and does not meet the requirement of IST for shotcrete mortar (<5 min). Only when the dosage of FAC increases to more than 20%, IST drops to the required levels. When SF and FAC are both added in mortar, regardless of SF dosage, the dosage of FAC should be kept at higher than 15% to ensure required IST. With SF and FA in mortar, when nano-silica (1%) is further added, IST increases slightly. However, IST decreases gradually with the increase of nano-silica from 1–3% and meets the acceptable level (IST ≤ 5 min). In conclusions, to meet the requirement of IST for mortar with accelerator, which is intended to be used for shotcrete, SF is suggested to be around 5–7.5%, FAC is suggested to be higher than 20%, and nano-silica is suggested to be around 1–3%.
(2) As the w/c ratio decreases, both viscosity and yield stress of mortar decrease in an exponential manner. Also, at high w/c ratios, the yield stress of mortar is mainly dependent on the yield stress of paste and the effects of sand become minor. At a higher paste/sand ratio, the viscosity is more dependent on paste than the entire mortar.
(3) With the increase of SF contents from 2.5–10%, the viscosity of the mortar increases at different spindle rotation speeds. The differences of the effects for SF contents from 2.5–7.5% are smaller at higher speed. As the FAC increases from 5–25%, the viscosity of mortar increases first and then decreases, yield stress increases, while fluidity decreases at each level of rotation speed. When SF and FAC fixed at 5% and 25%, respectively, adding nano-silica from 0.5–1.5% results in a remarkable increase in viscosity, especially at a lower rotation rate, of the mixture. Compared to that without nano-silica, the flowability of the mortar decreases gradually with the increases of nano-silica dosage. Therefore, it is suggested to only add smaller dosages of nano-silica such to improve the viscosity and yield stress.
(4) The relationship between viscosity and yield stress or viscosity and fluidity of the studied mortar mixtures in this study can be best presented by a logarithm or negative logarithm function, except for the group with nano-silica, the relationship is approximately line.
(5) The compressive strengths of mortar with different supplementary cementitious materials (SCMs) at early ages are close. This is because the development of strength is closely related to the content and the hydration process of cementitious materials. In the early stage, strength of the mixture mainly forms through cement hydration, and the replacement ratios of SCMs in each group are similar, showing similar effects on hydration. The difference in compressive strength after 28 days of standard curing is significant. The SF5-FAC15 group exhibits the largest increase in strength for 32.82%. This is attributed to the presence of both silica and a certain amount of alumina in the FAC, leading to a dual hydration effect. Additionally, both SF and FAC have pozzolanic effects, enabling secondary hydration.
(6) At the age of 2.5 h, the macropore areas distribution of SF5-FAC25-NS1.5 test groups were 31.96%, which is the least macropore area distribution. The fineness of the cement-based materials plays a great role in the hydration process. The finer the cementitious materials are, the smaller the final macropore area distribution is. The analysis of different test group showed that with the increase of age, the macropore area distribution became smaller and smaller. At SF5-FAC25-NS1.5 test group, the difference between the macropore distribution area of 2.5 h and the initial value was the largest, reaching 8.33%. The secondary hydration reaction of SCMs (SF, FAC) continuously generates products to fill the pores, and the ultrafine filling effect of nanomaterials makes the microstructure of mortar more compact and reduces the macropore area distribution.
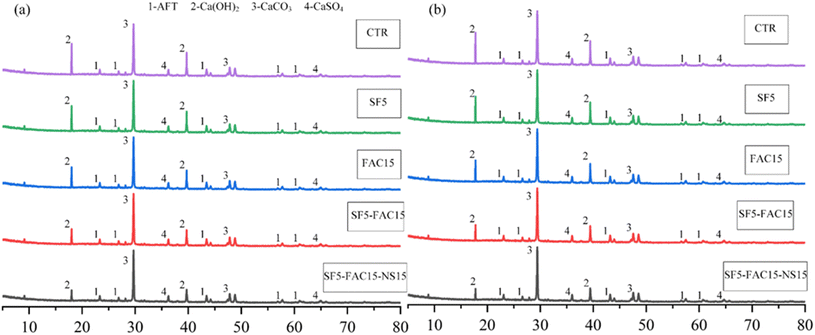
(7) From the pore size distribution perspective, the pores in the CTR group are concentrated within the range of 0.01 to 1 μm, which belong to macropores. The high porosity of the CTR group might be due to the remained water after the consumption of water in the late stage of hydration reaction. The mercury intrusion test results of the SF5-FAC25-NS1.5 group show that the pore volume of gel pores (<0.01 μm) and transitional pores (0.01–0.1 μm) is almost negligible. The pores are concentrated within the range of 0.01 to 0.05 μm, and the most probable pore size is significantly smaller than that of the CTR group. This is attributed to the volcanic ash effect of the supplementary cementitious material, which acts as a filler by generating secondary hydration products, leading to a denser structure. Both the early and later stages exhibit diffraction peaks corresponding to hydration products such as AFt, calcium hydroxide, calcium carbonate, and gypsum. In the later stage compared to the early stage, the diffraction peaks of these substances are enhanced. As the overall replacement level of SCMs increases, the diffraction peak of calcium hydroxide gradually weakens.
Author contributions
Conceptualization, data curation, image processing, writing – original draft, writing – review & editing, Chang Cai; funding acquisition, resources, supervision, Qian Su; data analysis, image processing, formal analysis, Shaoning Huang; funding acquisition, investigation, data curation, Fuhai Li; investigation, validation, project administration, Hesong Jin; resources, supervision, Xian Yu; funding acquisition, Yuelei Liu; investigation, data curation, Yang Yang; writing – review & editing, project administration, supervision, Zhao Chen. All authors have read and agreed to the published version of the manuscript.Conflicts of interest
The authors declare no conflict of interest.Acknowledgements
The authors would like to acknowledge the National Key R and D Program of China (2021YFB2600900), Railway Basic Research Joint Fund (U2268213), the Sichuan Province Science and Technology Planning Project (2023NSFSC0025, 2022NSFSC1095) and the Open Fund of Sichuan Provincial Engineering Research Center of City Solid Waste Energy and Building Materials Conversion and Utilization Technology (GF2022ZD006). The authors would also like to thank Analytical and Testing Center of Southwest Jiaotong University for Miss Xiaoke Zheng and eceshi (http://www.eceshi.com) for the laser particle size analyzer test.Notes and references
- K. H. Khayat, W. Meng, K. Vallurupalli and L. Teng, Cem. Concr. Res., 2019, 124, 105828 CrossRef CAS.
- L. Teng, W. Meng and K. H. Khayat, Cem. Concr. Res., 2020, 138, 106222 CrossRef CAS.
- M. Zhou, Z. M. Wu, X. Ouyang, X. Hu and C. J. Shi, Cem. Concr. Compos., 2021, 124, 104242 CrossRef CAS.
- Y. Liu, C. J. Shi, Q. Yuan, X. P. An, D. W. Jiao, L. L. Zhu and K. H. Khayat, Constr. Build. Mater., 2020, 237, 117530 CrossRef.
- C. J. Shi, Z. M. Wu, K. X. Lv and L. M. Wu, Constr. Build. Mater., 2015, 84, 387–398 CrossRef.
- C. F. Lu, Z. H. Zhang, C. J. Shi, N. Li, D. W. Jiao and Q. Yuan, Cem. Concr. Compos., 2021, 121, 104061 CrossRef CAS.
- C. Zhang, V. N. Nerella, A. Krishna, S. Wang, Y. M. Zhang, V. Mechtcherine and N. Banthia, Cem. Concr. Compos., 2021, 122, 104155 CrossRef CAS.
- T. Ishida and K. Nakada, Nihon Reoroji Gakkaishi, 2023, 51, 1–8 CrossRef CAS.
- I. Harbouz, A. Yahia, E. Roziere and A. Loukili, Cem. Concr. Compos., 2023, 138, 104965 CrossRef CAS.
- R. Jayathilakage, P. Rajeev and J. Sanjayan, Buildings, 2022, 12, 12081190 CrossRef.
- F. Heidarnezhad and Q. Zhang, Constr. Build. Mater., 2022, 323, 126545 CrossRef.
- C. F. Ferraris, K. H. Obla and R. Hill, Cem. Concr. Res., 2001, 31, 245–255 CrossRef CAS.
- M. Nuruzzaman, T. Ahmad, P. K. Sarker and F. U. A. Shaikh, J. Build. Eng., 2023, 68, 106127 CrossRef.
- Q. Q. Zhang, J. Chen, J. Zhu, Y. Yang, D. L. Zhou, T. Wang, X. Shu and M. Qiao, Materials, 2022, 15, 15248730 Search PubMed.
- L. J. Chen, G. M. Liu, W. M. Cheng and G. Pan, SpringerPlus, 2016, 5, 489–498 CrossRef PubMed.
- L. J. Chen, G. G. Ma, G. M. Liu and Z. X. Liu, Constr. Build. Mater., 2019, 225, 311–323 CrossRef.
- J. Kaufmann, K. Frech, P. Schuetz and B. Munch, Constr. Build. Mater., 2013, 49, 15–22 CrossRef CAS.
- M. Jolin and D. Beaupre, ACI Mater. J., 2004, 101, 131–135 Search PubMed.
- C. K. Y. Leung, R. Lai and A. Y. F. Lee, Cem. Concr. Res., 2005, 35, 788–795 CrossRef CAS.
- N. Ginouse and M. John, Tunn. Undergr. Space Technol., 2016, 58, 177–185 CrossRef.
- M. Pfeuffer and W. Kusterle, Cem. Concr. Res., 2001, 31, 1619–1625 CrossRef CAS.
- D. Zampini, A. Walliser, M. Oppliger, T. Melbye, C. Maltese, C. Pistolesl, G. Tansini, E. Portigliatti and E. D. Negro, Water Energy, 2005, 15, 132–142 Search PubMed.
- J. Warner, Concr. Int., 1995, 17, 59–64 CAS.
- J. Warner, Concr. Int., 1995, 17, 37–41 CAS.
- H. S. Armelin and N. Banthia, Mater. Struct., 1998, 31, 91–98 CrossRef CAS.
- H. S. Armelin and N. Banthia, Mater. Struct., 1998, 31, 195–202 CrossRef CAS.
- K. K. Yun, S. Y. Choi and J. H. Yeon, Constr. Build. Mater., 2015, 78, 194–202 CrossRef.
- G. Pan, P. C. Li, L. J. Chen and G. M. Liu, Constr. Build. Mater., 2019, 224, 1069–1080 CrossRef CAS.
- P. Choi, K. K. Yun and J. H. Yeon, Constr. Build. Mater., 2017, 142, 376–384 CrossRef CAS.
- F. Sanchez and K. Sobolev, Constr. Build. Mater., 2010, 24, 2060–2071 CrossRef.
- M. S. Morsy, S. H. Alsayed and M. Aqel, Constr. Build. Mater., 2011, 25, 145–149 CrossRef.
- M. H. Zhang, J. Islam and S. Peethamparan, Cem. Concr. Compos., 2012, 34, 650–662 CrossRef CAS.
- M. Oltulu and R. Sahin, Energy Build., 2013, 58, 292–301 CrossRef.
- M. Stefanidou and I. Papayianni, Composites, Part B, 2012, 43, 2706–2710 CrossRef CAS.
- Y. Liu, J. G. Han, M. Y. Li and P. Y. Yan, Constr. Build. Mater., 2018, 190, 255–264 CrossRef.
- P. Mehta and P. Monteiro, Concrete: microstructure, properties, and materials, McGraw-Hill Education, 2014 Search PubMed.
- R. Snellings, H. Kamyab, S. Joseph, P. Nielsen, M. Loots and L. Van den Abeele, Proceedings ICSBM 2019 Volume 2, New Cementitious Binders, 2019, p. 227 Search PubMed.
- D. Maeijer, P. Kara, B. Craeye, H. Kazemi-Kamyab, R. Snellings and M. Loots, 2021.
- A. B. Hossain, S. Shrestha and J. Summers, Transp. Res. Rec., 2009, 41–46, DOI:10.3141/2113-05.
- P. Kara De Maeijer, B. Craeye, R. Snellings, H. Kazemi-Kamyab, M. Loots, K. Janssens and G. Nuyts, Constr. Build. Mater., 2020, 263, 120493 CrossRef CAS.
- H. M. Sujay, N. A. Nair, H. S. Rao and V. Sairam, Constr. Build. Mater., 2020, 262, 120738 CrossRef CAS.
- W. T. Lin, Mater. Today Commun., 2020, 25, 101466 CrossRef CAS.
- ASTM C33-03, Standard Specification for Concrete Aggregates, ASTM International, West Conshohocken, PA, 2003 Search PubMed.
- ASTM C150/C150M-21, Standard Specification for Portland Cement, ASTM International, West Conshohocken, PA, 2020 Search PubMed.
- ISO 679, Method of Testing Cements-Determination of Strength, 1989 Search PubMed.
- ISO 9597, Cement-Test Methods-Determination of Setting Time and Soundness, 2008 Search PubMed.
- ASTM C1437-20, Standard Test Method for Flow of Hydraulic Cement Mortar, ASTM International, West Conshohocken, PA, 2020 Search PubMed.
- GB/T 35159-2017, Standard for test methods of flash setting admixtures for shotcrete, Standardization Administration of China Academy of Building Research, Beijing, 2017 Search PubMed.
- Q. Sun, S. Tian, Q. Sun, B. Li, C. Cai, Y. Xia, X. Wei and Q. Mu, J. Cleaner Prod., 2019, 225, 376–390 CrossRef CAS.
- J. E. Wallevik, J. Non-Newtonian Fluid Mech., 2005, 132, 86–99 CrossRef CAS.
| This journal is © The Royal Society of Chemistry 2023 |


