
 Open Access Article
 This Open Access Article is licensed under a Creative Commons Attribution-Non Commercial 3.0 Unported Licence
Enhanced volatile fatty acid production from waste activated sludge by urea hydrogen peroxide: performance and mechanisms
Siyi Wanga,
Tianbing Jianga,
Xiaoguo Chen *ab,
Kai Xionga and
Yanzhe Wanga
*ab,
Kai Xionga and
Yanzhe Wanga
aSchool of Resources and Environmental Engineering, Wuhan University of Technology, Wuhan 430070, China
bHubei Key Laboratory of Mineral Resources Processing and Environment, Wuhan 430070, China. E-mail: xiaoguo_chen@whut.edu.cn
First published on 24th May 2023
Abstract
Anaerobic acidogenesis of waste activated sludge (WAS) presents significant potential for resource recovery and waste treatment. However, the slow hydrolysis of WAS limits the efficiency of this approach. In this study, we applied urea hydrogen peroxide (UHP) pretreatment to enhance WAS hydrolysis and investigated the effects of operating parameters on volatile fatty acid (VFA) production and the associated mechanisms. Results demonstrated that UHP significantly improved WAS hydrolysis and VFA production, with a three-fold increase in soluble chemical oxygen demand (SCOD) compared to the control group. UHP dosage emerged as the most critical factor for VFA production, with the maximum VFA concentration increasing from 1127.6 to 8800.9 mg COD per L as UHP dosage ranged from 0 to 6 mmol g−1 VSS (Volatile suspended solids). At an optimal UHP dosage of 4 mmol g−1 VSS, both the unit oxidant promotion efficiency (ΔVFAs/ΔUHP) and the maximum VFA concentration reached relatively high levels, at 35.3 mg COD per mmol and 7527.3 mg COD per L, respectively. UHP pretreatment generated alkaline conditions, H2O2, ·OH and free ammonia, which collectively disrupted the extracellular polymeric substances (EPS) structure, transforming unextractable EPS into extractable forms and promoting the release of organic matter during both the pretreatment and fermentation stages. Excitation-emission matrix (EEM) analysis revealed that UHP increased the concentration of easily utilizable organic matter, providing more substrates for acidogenic bacteria and enhancing VFA production. Furthermore, weak alkaline conditions and high free ammonia concentrations in the UHP group facilitated VFA accumulation by preventing rapid acidification and suppressing methanogen activity. This study offers valuable insights into the potential of UHP pretreatment for enhancing WAS hydrolysis and VFA production, with promising applications in wastewater treatment and resource recovery.
1 Introduction
The activated sludge process is widely used in wastewater treatment plants (WWTP), during which a large amount of waste activated sludge (WAS) is generated. WAS usually contains plenty of unstable organic matter and harmful components such as heavy metals, organic micropollutants and pathogens1 and therefore needs to be treated to prevent its environmental risk. Currently, the main treatment processes are sanitary landfill, incineration, composting and anaerobic digestion.2 Due to the huge volume and high treatment cost, the disposal of WAS takes up to 60% of a WWTP total operation cost.3 WAS contains a large amount of organic carbon and inorganic nutrients, making it an important renewable resource. As anaerobic digestion (AD) can recover resources and energy through biogas production while stabilizing sludge, it is considered a cost-effective approach for both stabilizing sludge and recovering resources.4 However, a large amount of biogas produced is flared directly because of moisture and impurities that make it difficult to utilize.5During AD of WAS, volatile fatty acids (VFAs) are also produced as intermediate products, which can be utilized as alternative carbon sources for biological denitrification6 or as building blocks for high-value products such as biodiesel7 and polyhydroxyalkanoates.8 Compared to biogas, VFAs provide a higher commercial value and require less fermentation time.4 In addition, VFAs production reduce greenhouse gas emissions through recovery of carbon sources and contribute to achieving zero carbon emissions from WWTP. Therefore, recovering VFAs through anaerobic fermentation provides a promising WAS treatment approach to compensate operating costs and reduce greenhouse gas emissions.4
However, the slow hydrolysis rate of WAS reduces the yield and production rate of VFAs from anaerobic fermentation, since most of the organics are present in sludge cells or entangled in the extracellular polymeric substances (EPS) matrix, which cannot be directly used by VFAs-forming bacteria.4 To enhance the hydrolysis of WAS, several pretreatments have been proposed, such as physical, chemical, and biological pretreatments.9 Oxidative pretreatments such as potassium permanganate,10 potassium permanganate/sodium sulfite,11 persulfate,12 and hydrogen peroxide,13 are proved to effectively promote VFAs production through enhancing the hydrolysis of WAS, indicating that oxidative pretreatment is a promising pretreatment technology for VFAs production. However, these traditional oxidizers have limitations such as transportation difficulties, safety hazards, and introducing exogenous elements, making post-treatment of fermentation broth and residues more difficult.
Urea hydrogen peroxide (UHP) is an inexpensive and environmentally friendly solid oxidizer that has been successfully used for the treatment of organic contaminants in water.14 Recent research indicates that UHP treatment can effectively enhance the dewatering performance of WAS15. UHP has a higher reactive oxygen content and greater oxidation capacity than other peroxide counterparts,16 which can facilitate the dissolution of organic matter in WAS15, making it a potentially promising pretreatment technology for VFAs production. However, there is no report on UHP pretreatment of WAS for VFAs production.
The aims of this paper were to: (a) explore whether UHP pretreatment enhance the hydrolysis of WAS and thus increase the accumulation of VFAs; (b) determine the factors affecting the pretreatment efficiency such as pretreatment time, UHP dosage and initial pH; (c) unravel the mechanism of UHP pretreatment enhancing WAS hydrolysis and VFAs production.
2 Materials and methods
2.1 WAS and reagents
The sludge was sampled from the sludge dewatering unit of a domestic WWTP located in Wuhan, China, which operates using a double effluent (DE) oxidation ditch system. Its main characteristics are as follows: total suspended solids (TSS) of 15.6 ± 0.1%, volatile suspended solids (VSS) of 8.3 ± 0.1%, total solid nitrogen of 16.0 ± 1.0 mg g−1 TSS, total solid phosphorus of 23.0 ± 0.7 mg g−1 TSS, and total organic carbon of 30.6 ± 1.7 mg g−1 TSS. The sludge suspension with 5% TSS was prepared by adding pure water to the WAS and its total chemical oxygen demand (TCOD) is 31![[thin space (1/6-em)]](https://www.rsc.org/images/entities/char_2009.gif) 373.3 ± 1882.4 mg L−1. The UHP (CH6N2O3, ≥99.5%) used in this study was purchased from Condice (Wuhan, China), and all other reagents used were of analytical grade and obtained from Sinopharm Chemical Reagent Co., Ltd (Shanghai, China).
373.3 ± 1882.4 mg L−1. The UHP (CH6N2O3, ≥99.5%) used in this study was purchased from Condice (Wuhan, China), and all other reagents used were of analytical grade and obtained from Sinopharm Chemical Reagent Co., Ltd (Shanghai, China).
2.2 Experimental procedure
The experiment was conducted using serum bottles of 500 mL as reactors. The reactors were initially fed with 300 mL of 5% TSS WAS suspension and supplemented with 2 mmol UHP per g VSS. The reactors were then incubated at 25 °C and 120 rpm for 1 hour for pretreatment, followed by flushing with ultra-high purity nitrogen for 3 min and incubated at 35 °C and 120 rpm for anaerobic fermentation. No additional inoculation was performed and the pH was not controlled during the entire experiment. Samples were taken before and after pretreatment and periodically during anaerobic fermentation. Sampling was carried out under the protection of high-purity nitrogen gas. After the sampling was completed, nitrogen gas was continuously introduced for an additional 3 minutes to ensure that the reactor maintains an anaerobic environment. The samples were centrifuged at 8000 rpm for 10 min and the supernatant was filtered through a 0.45 μm cellulose acetate membrane for VFAs, soluble chemical oxygen demand (SCOD), dissolved organic matter (DOM), and NH4+–N determination, while the precipitate was used for loosely bond EPS (LB-EPS) and tightly bond EPS (TB-EPS) analysis. The control experiments followed the same procedures as described above, with the exception that no UHP was added.To examine the effects of various UHP pretreatment factors on WAS hydrolysis and VFAs production, we altered the pretreatment time, UHP dosage, and initial pH independently. The pretreatment time was assessed using incubation times of 1, 6, 12, 24 and 48 hours. Different dosages of UHP (0, 0.5, 1, 2, 4, and 6 mmol g−1 VSS) were added to the reaction system. Prior to UHP addition for pretreatment, the initial pH values of the WAS suspension were adjusted to 5.0, 7.0, 9.0 and 11.0 using NaOH or HCl, as needed. All experiments were carried out in triplicate, and the average values with standard deviations were reported.
To determine whether ·OH is generated during the UHP pretreatment of WAS and its contribution to WAS hydrolysis, tert-butanol (TBA) was used as a quenching agent for the ·OH radical scavenging experiment. In the experimental group, 1 mmol UHP per g VSS + 0.1 mmol TBA per g VSS was added, while the control group only received 1 mmol UHP per g VSS. The experimental procedure was the same as described earlier. Samples were taken before and after the pretreatment and the SCOD was measured.
2.3 Analytical methods
The SCOD, TCOD and NH4+–N were analyzed using the standard methods.17 The pH was measured in the reactors using a Sartorius PB-10 pH meter (Sartorius, Germany). The EPS extraction method was performed as previously reported.18 The EPS protein (PN) content was measured using the Coomassie Brilliant Blue G-250 method, with bovine serum albumin (BSA) as a standard.19 The polysaccharide (PS) content of EPS was determined using the anthrone–sulfuric acid method.20The excitation-emission matrix (EEM) spectra were determined using an EEM spectrofluorometer (F-380, Gangdong, Tianjin, China) with emission wavelength and excitation wavelength ranging from 200 nm to 600 nm at 0.5 nm increments. The band-pass of excitation and emission slits was set at 5 nm, and all measurements were carried out at a scanning speed of 12000 nm min−1. The EEM fluorescence spectra data was processed according to ref. 21.
The composition of VFAs was analyzed using an Agilent 7820A gas chromatograph (Agilent, USA) equipped with a flame ionization detector and a DB-FFAP column (30 m × 250 μm × 0.25 μm). A sample injection volume of 1.0 μl was used, and 2-ethylbutyric acid was used as an internal standard. The oven temperature program employed for separation of VFAs was as follows: started at 60 °C, linearly increased by 12 °C min−1 to 160 °C, and then hold at 160 °C for 3 min. The VFAs concentration was converted into the COD concentration using the conversion factors.22
2.4 Data analysis
Statistical significance between experimental groups was determined using an independent samples t-test in IBM SPSS Statistics 26 software, with a significance level of P < 0.05.The rate of sludge hydrolysis (V) was calculated using eqn (1).
 | (1) |
The degree of sludge disintegration (DDCOD) was calculated using eqn (2) to express the increase of soluble organic matter in released organic matter.23
 | (2) |
3 Results and discussions
3.1 Enhancement of WAS hydrolysis and VFAs production by UHP pretreatment
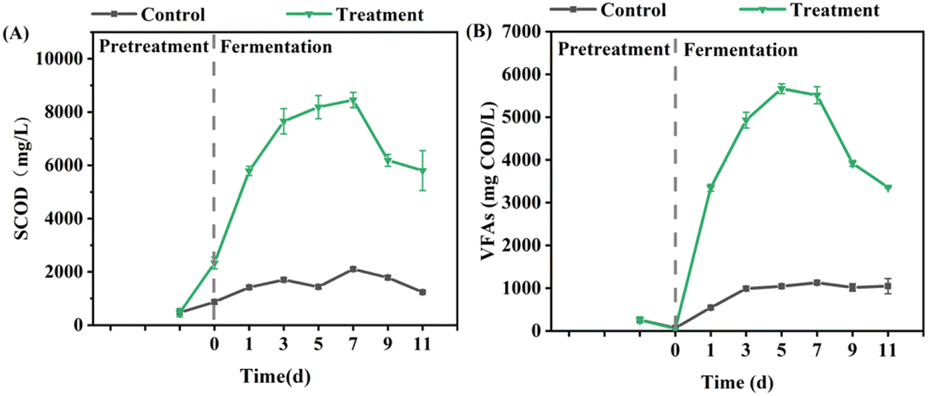 | ||
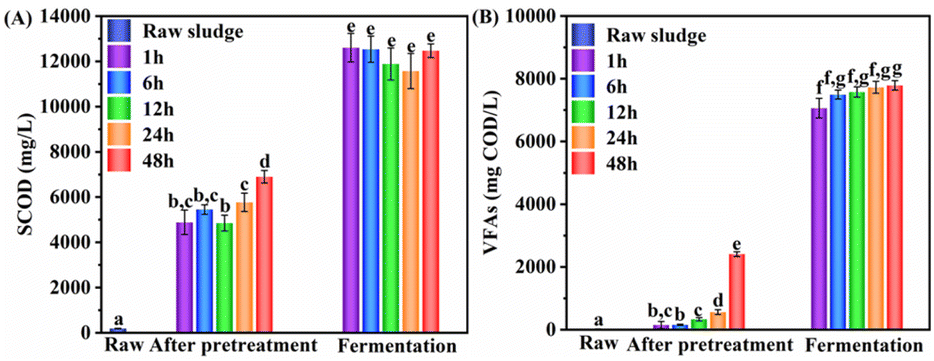
| Fig. 1 Performances of pretreatment on (A) WAS hydrolysis and (B) VFAs production after 1 h pretreatment with 2 mmol UHP per g VSS. | ||
As shown in Fig. 1A, the SCOD in UHP group further increased substantially during fermentation, reaching a maximum value of 8453.3 mg L−1, while the control group remained consistently low, ranging from 1236.7 to 2103.3 mg L−1. The maximum DDCOD value in the UHP group reached 25.84%, significantly higher than the control group's 5.29%. These results suggest that UHP pretreatment has a strong promoting effect on the hydrolysis of WAS during the fermentation phase, and this effect is even more significant than during the pretreatment phase. Zhang et al.25 investigated the pretreatment efficiency of CaO2 and found that the maximum SCOD of 0.3 g CaO2 per g VSS treatment group was 1.7 times higher than that of control group. Wang et al.26 treated WAS with 0.1 g sodium percarbonate (SPC) per g TSS, and showed that the SCOD of SPC-treated group was 1.7 times higher than that of control group. The oxidant dosage used in this study was only 0.19 g g−1 VSS (equal to 0.1 g g−1 TSS), which was lower than or comparable to those in the literature. Nonetheless, the SCOD increase was 3.0 times, higher than that in these references. These findings indicate that UHP is a more effective oxidant for enhancing WAS hydrolysis.
| Oxidants | Dosage (mg g−1 VSS) | VFAs yield (mg COD per g VSS) | Treatment/Control | References | |
|---|---|---|---|---|---|
| Control | Treatment | ||||
| KMnO4 | 299 | 34 | 295 | 8.7 | 10 |
| K2FeO4 | 500 | 135 | 254 | 1.9 | 28 |
| K2FeO4 | 500 | 46 | 177 | 3.8 | 29 |
| Ca(ClO)2 | 16.4 | 48 | 174 | 3.6 | 30 |
| K2SO4·KHSO4·2KHSO5 | 147.1 | 29 | 311 | 10.7 | 12 |
| Na2CO3·1.5H2O | 197.5 | 155 | 445 | 2.9 | 26 |
| Na2CO3·1.5H2O | 161.3 | 24 | 64 | 2.7 | 27 |
| CaO2 | 120 | 315 | 456 | 1.5 | 31 |
| H2O2 | 60.1 | 315 | 349 | 1.1 | 31 |
| CO(NH2)2·H2O2 | 188 | 43 | 215 | 5.0 | This study |
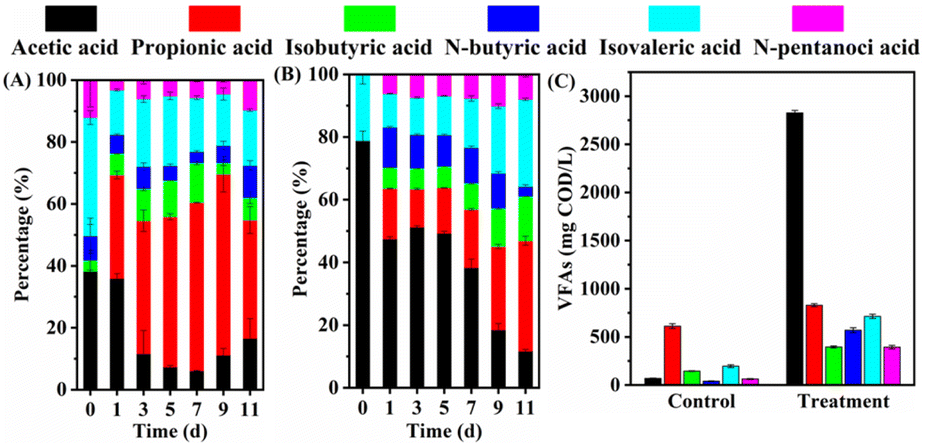 | ||
| Fig. 2 Changes in VFAs composition after 1 h of 2 mmol UHP per g VSS pretreatment for (A) control group and (B) UHP group, and (C) the VFAs composition under the optimal acid production conditions for each respective group. | ||
In the later stages of fermentation, both the proportion and concentration of acetic acid in the UHP group decreased substantially. During this period, the pH ranged from 7.67 to 7.91, and the free ammonia (FA) concentration varied between 87.5 and 163.7 mg L−1. Given that high pH and FA levels may inhibit the methanogenesis process,32,33 the decline in acetic acid concentration is less likely to be caused by methanogenesis and more likely due to microbial utilization of acetic acid for polyhydroxyalkanoate synthesis.34–36
3.2 Effect of UHP pretreatment conditions on anaerobic fermentation of WAS
570.0 to 12603.3 mg L−1. The change in VFAs was similar to that of SCOD, increasing with the extension of fermentation time and reaching the maximum concentration on day 9, with concentrations ranging from 7063.3 to 7787.1 mg COD per L and no significant difference among the experimental groups (Fig. 3B).
 | ||
| Fig. 3 Effect of pretreatment duration on (A) WAS hydrolysis and (B) VFAs production with 6 mmol UHP per g VSS. Data in fermentation phase were collected at their maximum concentration time (day 9). | ||
Interestingly, a substantial amount of VFAs was generated after UHP pretreatment and prior to fermentation. The concentration of VFAs increased considerably as the pretreatment duration extended, with the 48 hour group showing an increase from 23.9 mg COD per L before treatment to 2411.2 mg COD per L after treatment. Notably, the primary component of the produced VFAs was acetic acid, accounting for over 50% of the total VFAs. This suggests that a high concentration of UHP (6 mmol UHP per g VSS) during the pretreatment stage not only enhances the release of organic matter in WAS but also directly oxidizes a portion of the organic matter into VFAs, predominantly acetic acid. However, a similar trend was not observed in Fig. 1B, where both the UHP group and the control group experienced a notable decrease in VFAs after pretreatment. This discrepancy could be attributed to the higher initial VFAs concentration (256.6 mg COD per L) and the lower UHP dosage (2 mmol UHP per g VSS) in this particular reaction system. The low concentration of UHP resulted in a smaller quantity of VFAs produced through the oxidation process. Simultaneously, the high initial VFAs concentration led to increased losses due to volatilization during the pretreatment process, ultimately causing a net decrease in VFAs concentration.
30 for WAS pretreatment. Furthermore, when the Ca(ClO)2 dosage exceeded a certain threshold (e.g., 0.2 g g−1 TSS), the SCOD concentration even dropped lower than that of the blank control group.30 This might be attributed to the excessive oxidant reacting with the dissolved organic matter, oxidizing it, and subsequently causing a decrease in SCOD.29
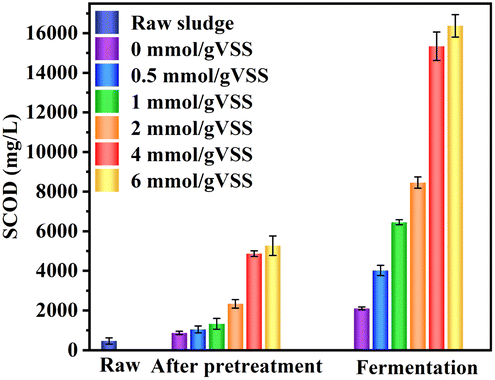 | ||
| Fig. 4 Variations in SCOD for WAS with different UHP dosages after 1 h pretreatment, Data in fermentation phase were collected at their maximum concentration time. | ||
The maximum VFAs concentration during fermentation increased from 1127.6 to 8800.9 mg COD per L with the increase in UHP dosage from 0 to 6 mmol g−1 VSS. A similar trend was observed in studies involving potassium monopersulfate (PMS)37 and CaO2.38 However, as the UHP dosage increased, ΔVFAs/ΔUHP initially increased and then decreased. At a UHP dosage of 4 mmol g−1 VSS, both ΔVFAs/ΔUHP and the maximum VFAs concentration reached relatively high levels, at 35.3 mg COD per mmol and 7527.4 mg COD per L, respectively. Further increasing the dosage to 6 mmol g−1 VSS raised the VFAs to 8800.9 mg COD per L, but led to a significant decrease in ΔVFAs/ΔUHP, down to 24.2 mg COD per mmol. Taking into account the final VFAs yield and the efficiency of increasing VFAs per unit of UHP, the optimal UHP dosage was determined to be 4 mmol g−1 VSS.
Fig. 5B demonstrates that UHP pretreatment significantly influenced the composition of VFAs. In the control group without UHP, propionic acid was the main component of VFAs, accounting for 54.3%, followed by isovaleric acid at 17.4%, and acetic acid at a mere 6.1% (69.0 mg COD per L). The introduction of 0.5 mmol UHP per g VSS had minimal impact on VFAs composition. However, as the UHP dosage increased, acetic acid's proportion rose substantially while propionic acid's proportion decreased. When the UHP addition exceeded 2 mmol g−1 VSS, VFAs composition became relatively stable, with acetic acid having the highest proportion (49.3–56.2%), followed by isovaleric acid (12.5–14.0%) and propionic acid (11.5–14.8%). Acetic acid production increased with UHP addition, from 2807.3 mg COD per L to 4944.7 mg COD per L, when UHP addition ranged between 2 and 6 mmol g−1 VSS. Concurrently, the time required for acetic acid and VFAs to reach their maximum production extended from 5 to 9 days.
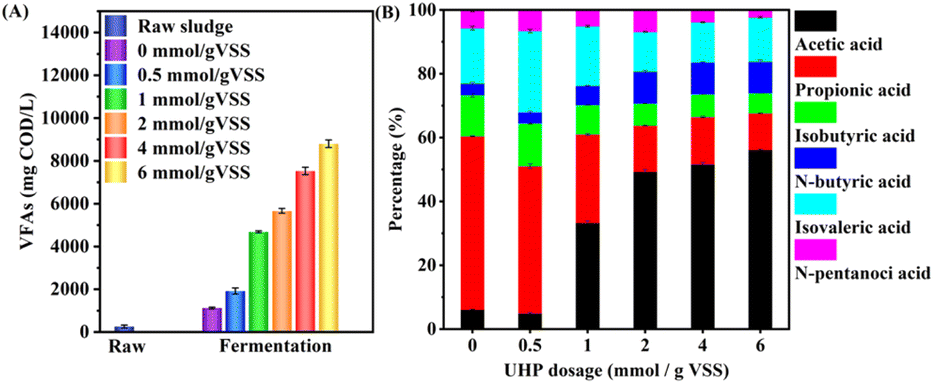 | ||
| Fig. 5 Variations in (A) VFAs concentration and (B) VFAs composition at the time of maximum VFAs production with different UHP dosages. | ||
Similar patterns were observed with other oxidants. He et al.39 treated WAS with potassium ferrate (PF) and found that the proportion of acetic acid increased from 13.1% in the control to 18.4, 26.3, 48.2, 54.0, and 68.4% with PF dosages of 14, 28, 56, 84, and 140 mg Fe(VI) per g TSS, respectively. Yang et al.12 reported that when PMS addition increased from 0 to 0.09 g g−1 TSS, the proportion of acetic acid rose from 17.3% to 60.3%, and when the addition further increased to 0.24 g g−1 TSS, the proportion of acetic acid declined to 40.0%. These results indicate that increasing oxidant dosage indeed promotes the production and accumulation of acetic acid. This may be attributed to the conversion of higher molecular weight VFAs (e.g., butyric acid, propionic acid, and valeric acid) to acetic acid through oxidant treatment40 or biodegradation to acetic acid in the anaerobic fermentation system by acetic acid-forming bacteria.41,42
830.0 mg L−1, significantly higher than that observed under neutral and acidic conditions (4165.0 mg L−1 and 4031.7 mg L−1). However, during fermentation, the SCOD increase for the group pretreated at pH 11 was less pronounced, while other groups experienced a marked increase. By the end of the experiment (day 13), the concentrations reached 13380.0–13,713.3 mg L−1, approaching the 15226.7 mg L−1 found in the pH 11 group. These results suggest that the initial pH during pretreatment has limited impact on the ultimate hydrolysis extent of WAS.
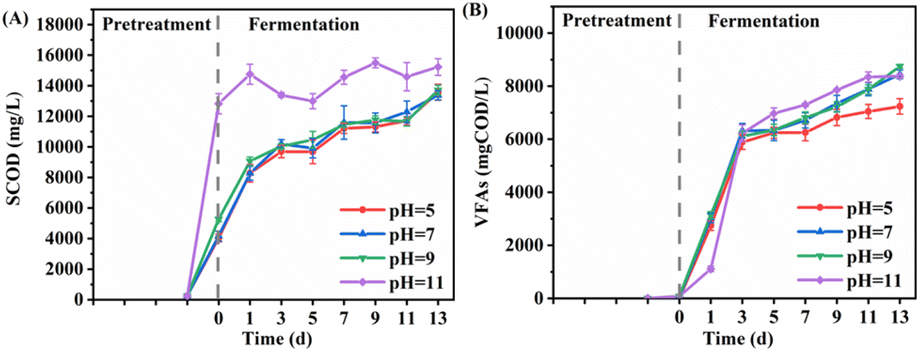 | ||
| Fig. 6 Effect of initial pH on (A) WAS hydrolysis and (B) VFAs production after 1 h pretreatment with 6 mmol UHP per g VSS. | ||
In contrast to SCOD trends, VFAs production in the strongly alkaline group (pH = 11) was notably suppressed at the onset of fermentation (day 1) but quickly rebounded. This suppression might be attributed to the high pH (10.37), which inhibited acid-producing bacteria.43 Subsequently, the VFAs production in this group increased rapidly, even exceeding other groups, possibly due to the higher hydrolysis extent of WAS providing ample carbon sources for fermentation. However, by the end of the experiment, VFAs production in this group was comparable to other groups, except for the pH 5 group, with values ranging between 8375.9 and 8747.2 mg COD per L. This finding indicates that while strongly alkaline conditions promote WAS hydrolysis, they do not enhance VFAs production. Maspolim et al.43 reported similar conclusions. The total VFAs production in the acidic treatment group (pH = 5) was only 7236.9 mg COD per L, significantly lower than that in neutral and alkaline treatment groups. As the pH of this group remained above 8.0 in the later stage of fermentation, it is less likely that inhibition of acid-producing bacteria caused the observed difference, warranting further investigation into the specific cause.
3.3 Mechanisms of enhanced VFAs production by UHP pretreatment
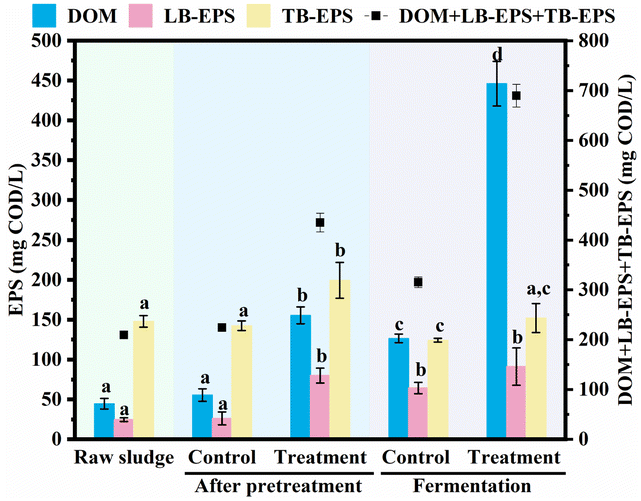 | ||
| Fig. 7 Variations in DOM, LB-EPS, and TB-EPS after 1 h of 2 mmol UHP per g VSS pretreatment and on day 7 of fermentation. DOM, LB-EPS, and TB-EPS represent the sum of PN and PS concentrations. Distinct letters above bars denote significant differences (p < 0.05) for the same parameter. | ||
Following UHP pretreatment, DOM increased considerably, indicating that some LB-EPS was converted into a soluble form. The TB-EPS/LB-EPS ratio after UHP pretreatment was 2.5, significantly lower than the 5.4 before pretreatment and smaller than the control group's 6.0, suggesting that some TB-EPS was transformed into LB-EPS. TB-EPS, as tightly bound EPS, primarily maintains the stability of the WAS structure. A decrease in the TB-EPS/LB-EPS ratio negatively impacts WAS stability. Moreover, PS and PN analysis in LB-EPS and TB-EPS revealed that the PS/PN of LB-EPS increased only slightly after UHP pretreatment (from 1.29 to 1.38), while the PS/PN of TB-EPS dropped sharply from 2.71 to 1.93. As the primary substances responsible for maintaining the rigid structure of sludge,44 a substantial decrease in the proportion of PS would inevitably compromise the sludge's stability.
Previous research has shown that extractable EPS accounts for only a small portion of EPS in WAS, with the majority being non-extractable EPS.29 Our study discovered that after UHP treatment, although DOM increased significantly, the extractable EPS (the sum of LB-EPS and TB-EPS) did not decrease but rather increased by 0.6 times (from 172.8 mg COD per L to 279.6 mg COD per L), while the control group experienced a slight decrease to 168.7 mg COD per L. This finding suggests that UHP treatment can convert non-extractable EPS in WAS into extractable EPS. Similar result was also found for co-treatment by free nitrous acid and calcium peroxide of WAS.4 In comparison to extractable EPS, non-extractable EPS is more tightly bound to WAS and contributes more significantly to WAS structure stability. By converting non-extractable EPS into extractable EPS, UHP further diminishes WAS stability. This destructive effect on WAS stability during the pretreatment process enhances further hydrolysis during the subsequent fermentation stage, aligning with the substantial increase in DOM observed in the UHP group during fermentation.
UHP can decompose in water, generating H2O2 and urea. Urea further hydrolyzes to produce ammonia nitrogen, leading to an increase in the system's pH. These intermediate substances may alter the composition of EPS, affecting the hydrolysis of WAS. To further determine how UHP changes the composition of EPS in WAS, the pH of the system before and after treatment was measured (Fig. 8A), and the concentrations of FA and H2O2 were theoretically calculated to analyze their possible impacts on EPS. The UHP used in this study can theoretically produce 52.8 mmol L−1 of H2O2. In addition to its inherent oxidizing ability, H2O2 can generate highly active ·OH under the catalysis of transition metals present in WAS13, although the amount of produced ·OH is not very large15. To determine the contribution of ·OH to the hydrolysis of WAS, we conducted a radical quenching experiment using the ·OH scavenger TBA. The results showed that the addition of the quencher reduced the SCOD of UHP pretreated WAS by 11.3%, indicating that the ·OH generated by the decomposition of UHP indeed had a certain promoting effect on the hydrolysis of WAS. These findings suggested that H2O2 and the produced ·OH may break the bonds connecting the EPS skeleton through oxidation, thereby disrupting the EPS structure and accelerating its hydrolysis45. This could be a crucial mechanism for UHP-promoted changes in EPS composition and organic matter release.
 | ||
| Fig. 8 Variations in (A) pH and (B) NH4+–N after 1 h of pretreatment using 2 mmol UHP per g VSS. | ||
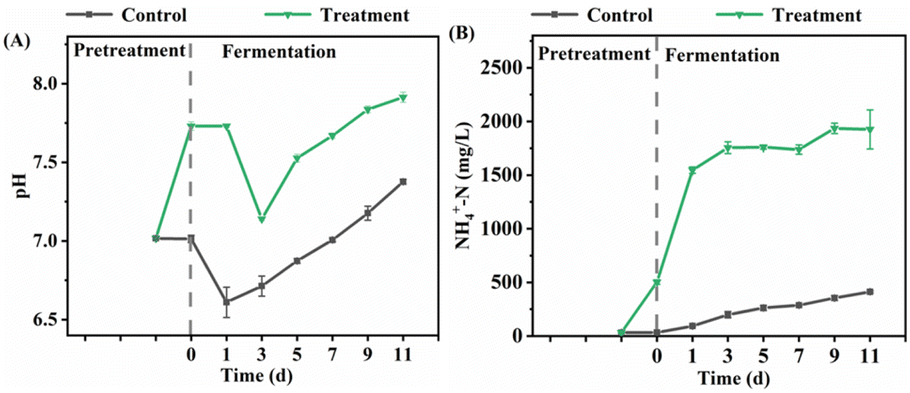
After UHP pretreatment, the pH value increased from 7.0 to 7.7, while the control group's pH remained around 7.0 (Fig. 8A). Alkaline conditions favor the dissociation of acidic groups in EPS, resulting in some EPS components carrying negative charges. The repulsive forces between these negatively charged components can promote the dissolution of PN and PS in EPS.46 The significant increase in PN and PS concentrations in the DOM of the UHP group supports this hypothesis. Therefore, the elevation of pH promoting the dissolution of PN and PS in EPS may be another crucial mechanism for UHP pretreatment-enhanced EPS hydrolysis. The increased pH also converts ammonium ions to FA. According to the reaction system's pH and ammonia nitrogen concentration,47 the FA concentration after pretreatment in the UHP group was 14.9 mg L−1, significantly higher than the 0.2 mg L−1 in the control group. Previous studies have shown that FA can attack tyrosine-like proteins and aromatic-like proteins in sludge EPS and thus destroy hydrogen bonding networks,48 making the EPS structure loose or even dissolving.49 This could be an essential reason for UHP causing non-extractable EPS to transform into extractable EPS and the conversion of TB-EPS to LB-EPS and DOM.
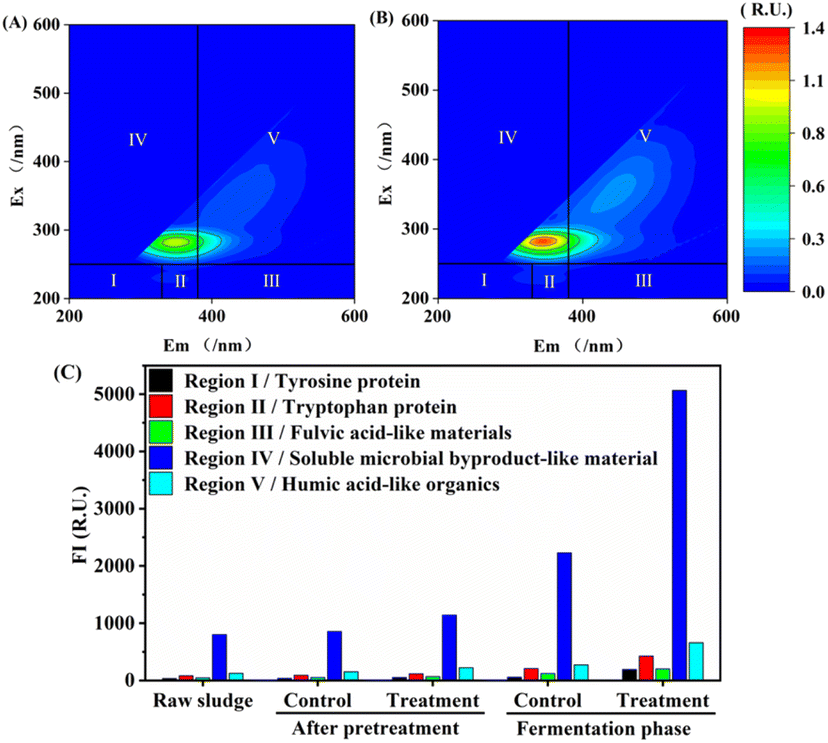 | ||
| Fig. 9 EEM fluorescence spectra of WAS supernatant after 1 h pretreatment with 2 mmol UHP per g VSS in (A) control group and (B) UHP group, and (C) FRI after pretreatment and on day 1 of fermentation. All samples were diluted 15 times. | ||
Although the proportion of regions IV + I in the total FI of the UHP group after pretreatment (74.1%) was slightly lower than that of the control group (75.2%), it was higher during the fermentation stage (80.3–80.6%) compared to the control group (79.1–79.8%). This finding indicates that UHP treatment did not negatively impact the bioavailability of hydrolysis products while enhancing WAS hydrolysis and even exhibited a promoting effect, which is advantageous for boosting VFAs production. The higher VFAs/SCOD ratio in the UHP group compared to the control group supports this assertion.
Further investigation revealed that the ΔPN/ΔPS of DOM in the UHP group was 1.1 after pretreatment, significantly higher than that in the control group (0.86) and higher than that in the initial WAS LB-EPS and TB-EPS (0.78 and 0.37, respectively). This result suggests that UHP pretreatment is more conducive to PN solubilization in WAS. The elevated PN proportion promotes acetic acid production during fermentation,51 resulting in a marked increase in both the concentration (2826.2 mg COD per L) and proportion (near 50%) of acetic acid in the UHP group, thereby enhancing overall VFAs production.
Since the pH range of the UHP group is 7.1–7.9 (Fig. 8A), it exhibits weak alkalinity, which can neutralize acids and prevent rapid acidification during fermentation from inhibiting acidogenic bacterial activity.52 This slightly alkaline environment is beneficial for the growth of acid-producing bacteria such as Sedimentibacter43. Consequently, the elevated pH caused by the UHP treatment promotes the production of VFAs. Furthermore, the pH in the UHP group is higher than that of the control group (6.6–7.4) (Fig. 8A) and exceeds the optimal pH range for methanogenic bacteria (6.8–7.2),32 which is unfavorable for methanogen growth. Additionally, the high FA concentration (64.7–163.7 mg L−1) in the UHP group during fermentation inhibits methanogenic enzyme activity53. These UHP treatment characteristics restrict the conversion of VFAs to methane, thereby fostering the accumulation of VFAs.
4 Conclusions
This study demonstrated the effectiveness of UHP pretreatment in enhancing WAS hydrolysis and VFAs production. UHP pretreatment significantly increased the SCOD and VFAs concentration, with UHP dosage being the most crucial factor for optimal results. The mechanisms underlying the enhancement of WAS hydrolysis and VFAs production include the disruption of EPS structure, promotion of organic matter release, and increase in easily utilizable organic matter concentrations. Additionally, weak alkaline conditions and high free ammonia concentrations in the UHP group facilitated VFAs accumulation by preventing rapid acidification and inhibiting methanogen activity. The findings of this study provide valuable insights into the potential of UHP pretreatment for WAS hydrolysis and VFAs production enhancement, paving the way for innovative applications in wastewater treatment and resource recovery.Conflicts of interest
There are no conflicts to declare.Acknowledgements
We would like to express our gratitude to Jianmin Qiu, Zixun Qin and Yiting Cheng for their assistance in sample measurement.References
- W. Fang, X. Zhang, P. Zhang, J. Wan, H. Guo, D. S. M. Ghasimi, X. C. Morera and T. Zhang, J. Environ. Sci., 2020, 87, 93–111 CrossRef CAS PubMed.
- T. Liang, K. Elmaadawy, B. Liu, J. Hu, H. Hou and J. Yang, Process Saf. Environ. Prot., 2021, 145, 321–339 CrossRef CAS.
- W. Q. Guo, S. S. Yang, W. S. Xiang, X. J. Wang and N. Q. Ren, Biotechnol. Adv., 2013, 31, 1386–1396 CrossRef CAS PubMed.
- J. Wang, Y. Lou, K. Feng, H. Zhou, B. Liu, G. Xie and D. Xing, J. Hazard. Mater., 2022, 423, 127022 CrossRef CAS PubMed.
- Q. Zeng, F. Zan, T. Hao, S. K. Khanal and G. Chen, Water Res., 2022, 208, 117839 CrossRef CAS PubMed.
- Y. Wang, X. Liu, Y. Liu, D. Wang, Q. Xu, X. Li, Q. Yang, Q. Wang, B. J. Ni and H. Chen, Bioresour. Technol., 2020, 318, 124266 CrossRef CAS PubMed.
- S. Dufreche, R. Hernandez, T. French, D. Sparks, M. Zappi and E. Alley, J. Am. Oil Chem. Soc., 2007, 84, 181–187 CrossRef CAS.
- N. Frison, E. Katsou, S. Malamis, A. Oehmen and F. Fatone, Environ. Sci. Technol., 2015, 49, 10877–10885 CrossRef CAS PubMed.
- Y. Yuan, X. Hu, H. Chen, Y. Zhou, Y. Zhou and D. Wang, Sci. Total Environ., 2019, 694, 133741 CrossRef CAS PubMed.
- Q. Xu, Q. Fu, X. Liu, D. Wang, Y. Wu, Y. Li, J. Yang, Q. Yang, Y. Wang, H. Li and B. J. Ni, Chem. Eng. J., 2021, 406, 126797 CrossRef CAS.
- W. Li, Y. Lou, A. Fang, K. Feng and D. Xing, Chem. Eng. J., 2020, 394, 124920 CrossRef CAS.
- J. Yang, X. Liu, D. Wang, Q. Xu, Q. Yang, G. Zeng, X. Li, Y. Liu, J. Gong, J. Ye and H. Li, Water Res., 2019, 148, 239–249 CrossRef PubMed.
- Preethi, J. Rajesh Banu, S. Kavitha, R. Yukesh Kannah, S. Varjani and M. Gunasekaran, Sci. Total Environ., 2022, 817, 152873 CrossRef CAS PubMed.
- Q. Chen, Z. Cheng, X. Li, C. Wang, L. Yan, G. Shen and Z. Shen, Appl. Catal., B, 2022, 302, 120866 CrossRef CAS.
- D. Wang, C. Pan, L. Chen, D. He, L. Yuan, Y. Li and Y. Wu, Water Res., 2022, 225, 119195 CrossRef CAS PubMed.
- J. Zhou and H. Wang, Chem. Eng. J., 2020, 390, 124567 CrossRef CAS.
- SEPA, Water and Wastewater Monitoring Methods China, Environmental Science Publishing House, Beijing, 2002 Search PubMed.
- Y. Wang, X. Wang, K. Zheng, H. Guo, L. Tian, T. Zhu and Y. Liu, Bioresour. Technol., 2022, 364, 128024 CrossRef CAS PubMed.
- R. W. Blakesley and J. A. Boezi, Anal. Biochem., 1977, 82, 580–582 CrossRef CAS PubMed.
- B. Frølund, R. Palmgren, K. Keiding and P. H. Nielsen, Water Res., 1996, 30, 1749–1758 CrossRef.
- C. Yang, A. Zhou, Z. He, L. Jiang, Z. Guo, A. Wang and W. Liu, Environ. Sci. Pollut. Res., 2015, 22, 9100–9109 CrossRef CAS PubMed.
- P. Jin, X. Wang, Q. Zhang, X. Wang, H. H. Ngo and L. Yang, Bioresour. Technol., 2016, 200, 722–730 CrossRef CAS PubMed.
- H. Sari Erkan and G. Onkal Engin, J. Environ. Chem. Eng., 2020, 8, 103918 CrossRef CAS.
- O. G. Apul and F. D. Sanin, Bioresour. Technol., 2010, 101, 8984–8992 CrossRef CAS PubMed.
- Q. Zhang, X. Gao, Y. Jin, L. Zhao, H. Zhu and P. Zhang, Bioresour. Technol., 2020, 309, 123379 CrossRef CAS PubMed.
- Y. Wang, P. Sun, H. Guo, K. Zheng, T. Zhu and Y. Liu, J. Environ. Manage., 2022, 313, 115025 CrossRef CAS PubMed.
- Q. Zhang, X. Cheng, F. Wang, S. Fang, L. Zhang, W. Huang, F. Fang, J. Cao and J. Luo, Sci. Total Environ., 2022, 838, 156054 CrossRef CAS PubMed.
- L. Li, J. He, M. Wang, X. Xin, J. Xu and J. Zhang, ACS Sustainable Chem. Eng., 2018, 6, 16819–16827 CrossRef CAS.
- L. Li, J. He, X. Xin, M. Wang, J. Xu and J. Zhang, Chem. Eng. J., 2018, 332, 456–463 CrossRef CAS.
- Q. Zhang, Y. Wu, J. Luo, J. Cao, C. Kang, S. Wang, K. Li, J. Zhao, M. Aleem and D. Wang, Sci. Total Environ., 2020, 712, 136500 CrossRef CAS PubMed.
- J. Xu, X. Li, L. Gan and X. Li, Sci. Total Environ., 2018, 644, 547–555 CrossRef CAS PubMed.
- X. Wang and Y. C. Zhao, Int. J. Hydrogen Energy, 2009, 34, 245–254 CrossRef CAS.
- C. Zhang, Y. Qin, Q. Xu, X. Liu, Y. Liu, B. J. Ni, Q. Yang, D. Wang, X. Li and Q. Wang, ACS Sustainable Chem. Eng., 2018, 6, 9120–9129 CrossRef CAS.
- H. Satoh, Y. Iwamoto, T. Mino and T. Matsuo, Water Sci. Technol., 1998, 38, 103–109 CrossRef CAS.
- H. Salehizadeh and M. C. M. Van Loosdrecht, Biotechnol. Adv., 2004, 22, 261–279 CrossRef CAS PubMed.
- K. Sudesh, H. Abe and Y. Doi, Prog. Polym. Sci., 2000, 25, 1503–1555 CrossRef CAS.
- B. Jin, J. Niu, J. Dai, N. Li, P. Zhou, J. Niu, J. Zhang, H. Tao, Z. Ma and Z. Zhang, Bioresour. Technol., 2018, 265, 8–16 CrossRef CAS PubMed.
- Y. Li, J. Wang, A. Zhang and L. Wang, Water Res., 2015, 83, 84–93 CrossRef CAS PubMed.
- Z. W. He, W. Z. Liu, Q. Gao, C. C. Tang, L. Wang, Z. C. Guo, A. J. Zhou and A. J. Wang, Bioresour. Technol., 2018, 247, 174–181 CrossRef CAS PubMed.
- A. Shanableh and S. Jones, Water Sci. Technol., 2001, 44, 129–135 CrossRef CAS PubMed.
- Z. W. He, C. X. Yang, L. Wang, Z. C. Guo, A. J. Wang and W. Z. Liu, Chem. Eng. J., 2016, 290, 125–135 CrossRef CAS.
- C. Yang, W. Liu, Z. He, S. Thangavel, L. Wang, A. Zhou and A. Wang, Bioresour. Technol., 2015, 175, 509–516 CrossRef CAS PubMed.
- Y. Maspolim, Y. Zhou, C. Guo, K. Xiao and W. J. Ng, Bioresour. Technol., 2015, 190, 289–298 CrossRef CAS PubMed.
- S. S. Adav, D. J. Lee and J. H. Tay, Water Res., 2008, 42, 1644–1650 CrossRef CAS PubMed.
- S. Pilli, S. Yan, R. Tyagi and R. Surampalli, Rev. Environ. Sci. Biotechnol., 2015, 14, 453–472 CrossRef CAS.
- J. Wingender, Microbial Extracellular Polymeric Substances:Characterization, Structure and Function, 2011 Search PubMed.
- D. Wang, Y. Huang, Q. Xu, X. Liu, Q. Yang and X. Li, Bioresour. Technol., 2019, 275, 163–171 CrossRef CAS PubMed.
- Q. Fu, S. Long, Y. Xu, Y. Wang, B. Yang, D. He, X. Li, X. Liu, Q. Lu and D. Wang, J. Hazard. Mater., 2023, 452, 131305 CrossRef CAS PubMed.
- J. Zhang, D. Wang, X. Li, X. Liu, Q. Yang, Q. Xu, G. Yang, A. Duan and Y. Fang, J. Cleaner Prod., 2023, 389, 135862 CrossRef CAS.
- X. Jia, C. Zhu, M. Li, B. Xi, L. Wang, X. Yang, X. Xia and J. Su, Int. J. Hydrogen Energy, 2013, 38, 8691–8698 CrossRef CAS.
- Y. Chen, J. Luo, Y. Yan and L. Feng, Appl. Energy, 2013, 102, 1197–1204 CrossRef CAS.
- Y. Lu, H. Yuan, B. Yan, X. Zuo and X. Li, Biomass Bioenergy, 2022, 164, 106553 CrossRef CAS.
- H. Yuan and N. Zhu, Renewable Sustainable Energy Rev., 2016, 58, 429–438 CrossRef CAS.
| This journal is © The Royal Society of Chemistry 2023 |