 Open Access Article
Dry tribological properties of textured PMMA composites by embedding microspheres with different thermal conductivities
Dapeng Gu ab,
Hui Xieac,
Ziyu Liua,
Suwen Chen
 *d,
Zibo Wangae and
Siyuan Gaoa
aSchool of Mechanical Engineering, Yanshan University, Qinhuangdao 066004, China
bAviation Key Laboratory of Science and Technology on Generic Technology of Self-lubricating Spherical Plain Bearing, Yanshan University, Qinhuangdao 066004, China
cKey Laboratory of Self-Lubricating Spherical Plain Bearing Technology of Hebei Province, Yanshan University, Qinhuangdao, 066004, China
dSchool of Environmental and Chemical Engineering, Yanshan University, Qinhuangdao, 066004, China. E-mail: chensuwende@163.com
eTianjin Jingwei Hirain Technologies Co., Ltd., Tianjin 300074, China
First published on 24th May 2023
Abstract
Textured surfaces were prepared by embedding microspheres with different thermal conductivities of brass microspheres (BS), 304 stainless steel microspheres (SS), and polyoxymethylene microspheres (PS) on the surface of polymethyl methacrylate (PMMA). The effects of surface texture and filling modification on the dry tribological properties of BS/PMMA, SS/PMMA, and PS/PMMA composites were studied by ring-on-disc contact. Based on the finite element analysis of friction heat, the wear mechanisms of BS/PMMA, SS/PMMA, and PS/PMMA composites were analyzed. The results show that regular surface texture can be achieved by embedding microspheres on the PMMA surface. The friction coefficient and wear depth of the SS/PMMA composite are both the lowest. The worn surfaces of BS/PMMA, SS/PMMA, and PS/PMMA composites are divided into three micro-wear-regions. The wear mechanisms of different micro-wear-regions are different. Finite element analysis shows that thermal conductivity and thermal expansion coefficient affect the wear mechanisms of BS/PMMA, SS/PMMA, and PS/PMMA composites.
1. Introduction
Polymers and their composites are an important class of materials in national defense, military, and frontier science. They can be used as substitutes for metals and ceramics in mechanical parts mainly for load-bearing, transmission, and sealing because of their lightweight, insulation, corrosion resistance, high chemical stability, easy structure design, and easy processing.1 PMMA is a widely used polymer friction material. The single application of pure PMMA often results in high friction coefficient and serious wear, which limits its application in friction pairs of mechanical parts.2–4 Numerous scholars have attempted to improve the antifriction and antiwear properties of PMMA. The modification of PMMA by filling it with organic, inorganic, or metal particles is one of the most effective ways to improve its mechanical and friction properties under serious conditions.5–7 Akinci et al.8 studied the friction and wear properties of pure PMMA and zirconia (ZrO2) filled PMMA composites under dry sliding conditions. They found that the ZrO2 content significantly affected the friction coefficient. The more ZrO2 content in ZrO2/PMMA composite, the lower the wear rate. The smoothness of the worn surface increased with an increase in the ZrO2 content. Zhang et al.9 studied the mechanical and tribological properties of titanium oxide (TiO2) with HCl surface treatment-filled PMMA composite. The surface treatment of TiO2 can significantly improve wear resistance, and the optimum content of TiO2 is 3 wt%. The surface-treated ultra-high molecular weight polyethylene (UHMWPE) fiber and silicon dioxide (SiO2) also achieve good interface bonding with the PMMA matrix, thereby improving the tribological properties of UHMWPE/SiO2/PMMA composites.10,11 Aguilera-Camacho et al.12 prepared PMMA/calcium oxide (CaO) nanocomposite and found that the friction coefficient of PMMA/CaO nanocomposite is lower than that of pure PMMA coating. Farhan et al. prepared TiO2-ZnO/PMMA composite.13 The tribological test results show that its wear rate is related to the content of TiO2, and the higher the content of TiO2, the more serious the wear. The friction coefficient and wear rate of PMMA can be significantly improved by filling modification, as shown in Table 1.| References | Filler/matrix | Friction coefficient | Wear rate (mm3 Nm−1) | Test conditions |
|---|---|---|---|---|
| 8 | 5 wt% ZrO2/PMMA | 0.28 | 2 × 10⁻⁶ | 5 N, 0.5 m s−1 |
| 9 | 3 wt% HCl-TiO2/PMMA | 0.12 | — | 50 N, 0.424 m s−1 |
| 9 | 3 wt% HCl-TiO2/PMMA | 0.122 | — | 100 N, 0.424 m s−1 |
| 12 | PMMA/UHMWPE | 0.18 | 4.95 × 10⁻⁵ | 2 N |
| 12 | PMMA-CaO/UHMWPE | 0.12 | 2.75 × 10⁻⁵ | 2 N |
| 13 | 1 vol% TiO2-ZnO/PMMA | 0.27 | 2 × 10⁻⁷ | 5 N, 3.48 m s−1 |
| 13 | 3 vol% TiO2-ZnO/PMMA | 0.28 | 5.5 × 10⁻⁷ | 5 N, 3.48 m s−1 |
Improving tribological performance by preparing regular and arranged micro-structures to form surface texture is an effective method.14–16 Zhang et al.17 found that the deepest, tightest mating surfaces with the deepest grooves have the highest wear rates and transient wear (wear in break-in sliding). The shallow groove texture produces less wear than the deep groove texture. Experimental and numerical simulations show that the dimple size18 also affects tribological properties. He et al.19 studied the effect of surface texture on the tribological properties of polydimethylsiloxane (PDMS) elastomers. The results show that the friction coefficient of the columnar textured surface is lower than that of the smooth surface. The reason why textured surfaces significantly reduce the wear rate may be because the texture acts as a debris reservoir at the sliding interface to facilitate the formation of a transfer film.20,21 Current methods for the preparation of surface texture include milling, blasting, and energy beam processing. Among them, the most effective preparation method is prepared using laser surface texture. Gu et al.22 prepared the surface texture by embedding 304 stainless steel microspheres on the surface of the composite. The dry tribological properties of PTFE/PMMA and PEEK/PMMA composites with different mass fractions under the same surface textures were studied. To date, few reports have been published on the preparation of surface textures by embedding microspheres with different thermal conductivities on the surfaces of composites. Thus, in this study, three kinds of microspheres with different thermal conductivities of brass microspheres, 304 stainless steel microspheres, and polyoxymethylene (POM) microspheres were selected to prepare surface textures by embedding them on the surfaces of PMMA-based composites. The embedded microspheres achieve the dual effect of filling modification and surface texture together. The dry tribological properties and mechanisms of textured PMMA composites were investigated by ring-on-disc contact. The wear mechanism was analyzed by combining it with finite element thermodynamic analysis.
2. Experimental
2.1. Materials
A commercial acrylic product of polymethyl methacrylate powder was supplied by Arkema, France. Methyl methacrylate (MMA) aqueous (99.5%) and catechol (99.5%) were provided by Aladdin Reagent Co., Ltd, China. The brass microspheres and 304 stainless steel microspheres are provided by China Yiwu Yue Li Hardware Products Co., Ltd, China. The polyoxymethylene microspheres were supplied by Shangyu Yixin Balls Industry Co., Ltd, China. The diameters of the above three microspheres are 2.381 mm. The benzoyl peroxide (BPO, ≥98%, containing 28–32% water) and N,N-dimethyl-p-toluidine (Dmpt, 98%) were both supplied by Sinopharm Chemical Reagent Co., Ltd, China.2.2. Specimen preparation
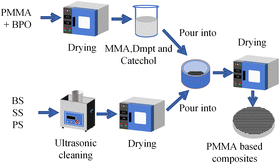
The PMMA-based composites with microspheres embedded on their surfaces were prepared using the self-curing method at room temperature. The preparation method is the same as that described in the literature (ref. 22). A schematic diagram of the preparation of PMMA-based composites is shown in Fig. 1. Soak the microspheres in ethanol before use and wash ultrasonically for 20 min. The ultrasound microspheres, PMMA powder and BPO powder were placed together in a constant temperature drying oven (25 °C) for 24 h. After drying, the microspheres were laid flat in a soft rubber mold to form a certain regular arrangement. Weigh a certain quality of PMMA and BPO powder, and mix well to obtain a powder mixture. Weigh a certain proportion of MMA aqueous, Dmpt and Catechol to form a liquid mixture. The powder mixture and liquid mixture are mixed and poured into the soft rubber mold before fully curing. Place the mold in a constant temperature drying oven (25 °C) for 4 h. Then, the PMMA matrix composites are demolded. Microspheres with different materials embedded on the PMMA surfaces were prepared and abbreviated, as listed in Table 2.| Full name | Abbreviation |
|---|---|
| Microspheres/PMMA | S/PMMA |
| Brass microspheres/PMMA | BS/PMMA |
| 304 stainless steel microspheres/PMMA | SS/PMMA |
| Polyoxymethylene microspheres/PMMA | PS/PMMA |
2.3. Friction and wear tests
Dry friction experiments were conducted on a ring-on-disc test rig under ambient conditions with a load of 80 N, a sliding speed of 100 rpm, and a sliding time of 1.5 h. Each experiment was repeated three times. The upper specimen (hereinafter referred to as “the counterpart ring”) was a ring with an outer diameter of 26 mm and an inner diameter of 20 mm, which was made of 304 stainless steel. The lower specimen (disc) is S/PMMA composites, with a diameter of 40 mm and a height of 8 mm. The treatment methods of the upper and lower specimens before the friction test are the same as those described in the literature (ref. 22). The roughness Ra of the counterpart ring range is 0.2–0.4 μm. The wear volume of the lower specimen is measured by utilizing a small size three-dimensional measuring instrument provided by GF Messtechnik, Germany. The wear performance is characterized by the wear depth.2.4. Material characterization
A white light confocal microscope, provided by Anton Paar, Switzerland, was used to observe the shape and arrangement of the surface texture of S/PMMA composites before and after wear. Scanning electron microscopy (SEM) was used to characterize the worn surfaces of S/PMMA composites. To improve conductivity, the specimens were sprayed with gold using an ion sputterer before the SEM observation.3. Results and discussion
3.1. Surface characteristics
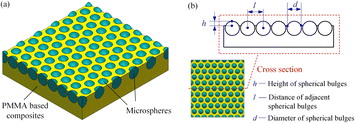
Fig. 2 shows the surface morphologies and characterizations of BS/PMMA and PS/PMMA composites. The surface morphologies and characterizations of the SS/PMMA composite are shown in Fig. 3(a) and (d), respectively, of the literature (ref. 22). It can be observed that the dual effect of filling modification and surface texture (regular and ordered spherical bulges) is achieved by embedding different microspheres on the surfaces of PMMA-based composites. The characterization method applied for analyzing surface texture is the same as that illustrated in the literature (ref. 22). Table 3 shows the geometrical characteristics of the spherical bulges of BS/PMMA, SS/PMMA, and PS/PMMA composites. As shown in Fig. 3, the main parameters of the spherical bulges are the diameter d, the height h, and the distance of adjacent spherical bulges l. Moreover, the area density r of the spherical bulges can be calculated using the following equation:
 | (1) |
3.2. Friction and wear results
Fig. 4 shows the dry friction coefficients and wear depth of BS/PMMA, SS/PMMA, and PS/PMMA composites. The data on SS/PMMA composite is from the literature (ref. 22). As depicted in Fig. 4(a), the friction coefficients of SS/PMMA and BS/PMMA composites are generally stable with little fluctuation, while the friction coefficient for PS/PMMA composite fluctuates more seriously. In the run-in period, the friction coefficient of SS/PMMA composite increases more gently than those of BS/PMMA and PS/PMMA composites. In Fig. 4(b), it can be observed that SS/PMMA composite exhibits the lowest average friction coefficient (about 0.42), while the highest average friction coefficient for PS/PMMA composite is about 0.60. The rule of wear depth is similar to that of friction coefficient, SS/PMMA < BS/PMMA < PS/PMMA. SS/PMMA composite shows that the lowest wear depth is about 5.37 × 10⁻² mm. It is nearly 50% lower than the highest wear depth of the PS/PMMA composite, which is about 10.76 × 10⁻² mm. This is mainly because the hardness and thermal conductivity of POM microspheres are less than 304 stainless steel and brass microspheres.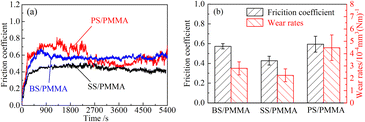 | ||
| Fig. 4 Tribological properties of BS/PMMA, SS/PMMA, and PS/PMMA. (a) Friction coefficient changing with time and (b) average friction coefficient and wear depth. * Friction coefficient of pure PMMA: data from the literature (ref. 23). | ||
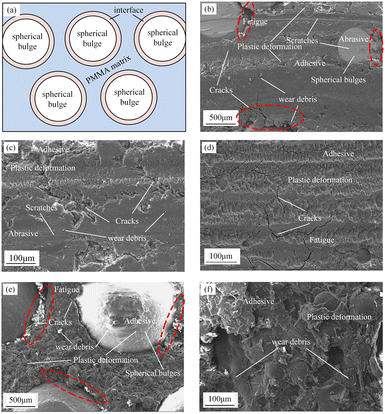
SEM micrographs were performed on the worn surfaces of BS/PMMA, and PS/PMMA composites, as shown in Fig. 5. The SEM micrograph of the SS/PMMA composite is shown in Fig. 10(a) of the literature (ref. 22). By comparing the wear surface of pure PMMA,23 the plastic deformation of the wear surface of the PMMA-based composites embedded with microspheres was significantly reduced. The wear mechanism changes from adhesion wear of pure PMMA to abrasive wear, fatigue wear and adhesion wear of PMMA matrix composites. As shown in Fig. 5(a), the worn surface is divided into three micro-wear-regions: the spherical bulge region, the PMMA matrix region, and the interface region between the spherical bulge and PMMA matrix. Correspondingly, the wear mechanism is different in each region. As illustrated in Fig. 5, for BS/PMMA, SS/PMMA, or PS/PMMA composites, the spherical bulge region is responsible for the main wear. In Fig. 5(b), some scratches and a small amount of wear debris can be observed on the spherical bulge region of BS/PMMA composite, and the main wear forms of the spherical bulge region are abrasive wear and adhesive wear. There are obvious cracks and wear fragments in the interface region, which may be due to the poor adhesion between the microspheres and the PMMA matrix. Moreover, owing to the friction heat generated during the friction process, fatigue wear and a small amount of adhesive wear mainly occur in the interface region. In Fig. 5(c), a small number of scratches, wear fragments, and plastic deformation are observed in the PMMA matrix of BS/PMMA composite, and the main wear forms in the PMMA matrix region are adhesive wear and a small amount of abrasive wear. From Fig. 10(a) of the literature (ref. 22), it can be observed that the wear form in the spherical bulge region of SS/PMMA is adhesive wear and in the interface region is a small amount of fatigue wear. In Fig. 5(d), it can be observed that there are a large number of cracks and plastic deformations in the PMMA matrix region of the SS/PMMA composite, and the wear forms are mainly fatigue wear and adhesive wear. In Fig. 5(e), a large number of wear debris and plastic deformation can be observed in the spherical bulge region of the PS/PMMA composite. Thus, the wear form is mainly adhesive wear. A large number of plastic deformations, wear debris and a small number of cracks are observed in the interface region, and the wear forms in the interface region are adhesive wear and a small amount of fatigue wear. In Fig. 5(f), a large number of plastic deformation and wear debris are observed in the PMMA matrix region of PS/PMMA composite, and the wear form is adhesive wear.
3.3. Finite element analysis of temperature fields
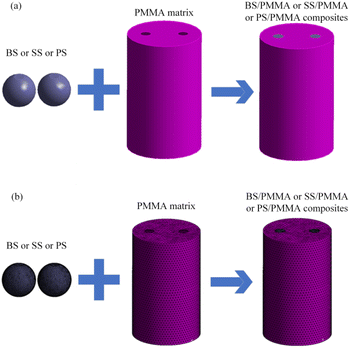
To further analyze the effect of friction heat generated during friction on the wear of the three micro-wear-regions, a finite element analysis of temperature fields was performed by WORKBENCH. To simplify the study of the temperature field between multiple microspheres, a simplified physical model with two microspheres was created. The steady-state thermodynamic analysis module and the static structure analysis module were used to construct the solution interface, and the temperature distribution and displacement distribution in the micro-wear-regions between the two microspheres were analyzed. Based on the relevant parameters of the tribological test described above, the material is set as an isotropic linear elastic material. Table 4 lists the thermodynamic and static parameters of the related materials. The corresponding finite element model is shown in Fig. 6(a). The finite element model is composed mainly of two microspheres and the PMMA matrix. Microspheres are embedded in the PMMA matrix, and the microspheres and the PMMA matrix are set as bound contacts. The microspheres are regarded as contact surfaces, and the PMMA matrix is regarded as the target surface. As shown in Fig. 6(b), tetrahedral meshes with grid sizes of 0.1 mm and 0.2 mm are used for microspheres and the PMMA matrix, respectively. The lower surface of the specimen is fixed. The displacement in the x and z directions of the circumferential surface is limited to 0, and the displacement in the y direction is free. The heat flux is applied to the upper surface of the specimen, a convection boundary is employed, and the ambient temperature is defined. The initial temperature is set to 22 °C. The surface heat dissipation coefficient in thermal convection is set to 0.00036 W mm−2 °C. The heat fluxes of BS/PMMA, SS/PMMA, and PS/PMMA composites are calculated using formula (2), which were 0.019 W mm−2, 0.0224 W mm−2, and 0.0264 W mm−2, respectively:| ϕq =(Fs·s)/(t·A) | (2) |
| Material | Young's modulus (MPa) | Poisson's ratio | Density (kg mm−3) | Thermal conductivity (W/(m K)) | Coefficient of thermal expansion (K−1) | Specific heat capacity (J/(kg K−1)) |
|---|---|---|---|---|---|---|
| a The data in this table comes from the Solidworks Material Library. | ||||||
| BS | 108 | 0.33 | 8.5 × 10⁻⁶ | 110 | 1.8 × 10⁻⁵ | 390 |
| SS | 2 × 10⁵ | 0.3 | 8 × 10⁻⁶ | 16.3 | 1.8 × 10⁻⁵ | 500 |
| PS | 2.6 × 10⁵ | 0.39 | 1.39 × 10⁻⁶ | 0.3 | 8.3 × 10⁻⁵ | 1378 |
| PMMA | 3 × 10⁵ | 0.24 | 1.19 × 10⁻⁹ | 0.19 | 8.3 × 10⁻⁵ | 1250 |
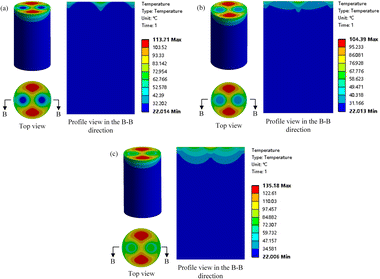
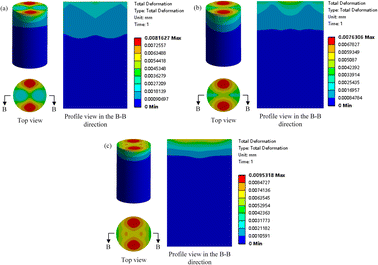
The temperature distributions of friction heat generated by the friction processes of BS/PMMA, SS/PMMA, and PS/PMMA composites are shown in Fig. 7. In Fig. 7, it can be observed that the friction heat generated by PS/PMMA composite is significantly higher than that of BS/PMMA and SS/PMMA composites. It can be observed from Table 4 that the 304 stainless steel is more conducive to the friction heat dispersed in the friction and brass microspheres have better thermal conductivity performance compared to POM microspheres, which can be processed. Owing to the insufficient heat dispersion of POM microspheres, friction heat tends to accumulate on the surface of the PS/PMMA composite during the friction process. The friction heat causes thermal deformation of the three micro-wear-regions. The displacement change clouds of BS/PMMA, SS/PMMA, and PS/PMMA composites are shown in Fig. 8. Owing to the thermal expansion coefficient of POM microspheres being higher than that of brass and 304 stainless steel microspheres, the thermal deformation displacement of POM microspheres is large.
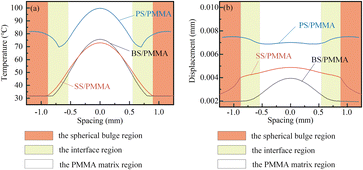
Fig. 9 shows the changes in temperature and displacement at various positions between the two microspheres during friction. Corresponding to the division of the front worn surface, it is also divided into the spherical bulge, PMMA matrix, and interface regions to facilitate the analysis of wear mechanisms. In Fig. 9(a) and (b), it can be observed that the changes in the temperature and displacement between the two microspheres of PS/PMMA composite are significantly higher than those of BS/PMMA and SS/PMMA composites. Because the thermal conductivity of PMMA is lower than that of various microspheres, the friction heat generated during friction is transferred to and accumulated in the PMMA matrix region. Thus, the temperature of the PMMA matrix region is higher than that of the spherical bulge region. The highest temperature is formed in the middle of the PMMA matrix region. For PS/PMMA composite, although the temperature in the PMMA matrix region is higher than that in the spherical bulge region, its specific heat capacity and density are higher than those of PMMA. Thus, the accumulated heat in the spherical bulge region is higher than that in the PMMA matrix region. This is why the displacement in the spherical bulge region of the PS/PMMA composite is higher than in the PMMA matrix region.
3.4. Discussion
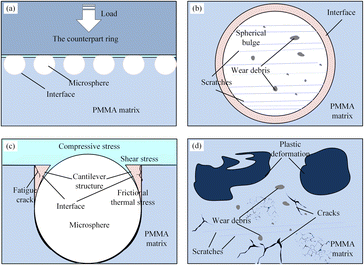
Fig. 10 shows a schematic of the friction and wear mechanisms of S/PMMA composites. In Fig. 10(a), because the height of the microsphere is slightly higher than that of the PMMA matrix, the counterpart ring preferentially touches the spherical bulge region. Therefore, in the initial stage, the spherical bulge region is mainly involved in friction and wear. During this stage, the friction coefficient curves of BS/PMMA and SS/PMMA composites with high hardness and good thermal conductivity fluctuated relatively flat, while PS/PMMA composite with poor hardness and thermal conductivity fluctuated rapidly, as shown in Fig. 4(a). The wear debris generated by the wear of 304 stainless steel and brass microspheres in the spherical bulge region forms scratches on the worn surface, causing abrasive wear, as shown in Fig. 5(b). As shown in Fig. 9, owing to the poor thermal conductivity and high thermal expansion coefficient of POM microspheres, the generated friction heat is significantly higher than that of the other two microspheres, which produces large displacement deformation compared to the other two microspheres. Therefore, plastic deformation and adhesive wear are mainly found in the spherical bulge region of the POM microspheres, as shown in Fig. 5(e). For BS/PMMA, SS/PMMA, and PS/PMMA composites, significant changes in temperature and displacement in the interface regions are observed in Fig. 9. Therefore, under the action of additional mechanical and thermal stresses, as shown in Fig. 10(c), a PMMA cantilever structure was formed owing to debonding between the microspheres and the PMMA matrix. Then, under the action of compressive stress and shear stress, fatigue cracks and fractures appear on the cantilever structure in the interface region. A portion of PMMA that breaks off from the cantilever structure forms a third-body abrasive wear on the worn surface. Another part is stored in the gap between the interfaces, which is due to insufficient contact between the interfaces of the microspheres and the PMMA matrix. In Fig. 10(d), because of the presence of metal wear debris from the spherical bulge region and the thermoplastic nature of PMMA, scratches and plastic deformations are formed on the PMMA matrix regions of BS/PMMA and SS/PMMA composites, resulting in abrasive wear and adhesive wear, as shown in Fig. 5(c) and (d). However, severe plastic deformation occurs in the PMMA matrix region of the PS/PMMA composite, resulting in adhesive wear, as shown in Fig. 5(g). POM or PMMA adheres to the surface of the counterpart ring during the friction process, resulting in a higher friction coefficient than that of BS/PMMA and SS/PMMA composites, as shown in Fig. 4(a). As shown in Fig. 9, for the PMMA matrix region of PS/PMMA composite, excessive displacement deformation, high friction heat, and poor hardness led to an increase in the wear depth. This agrees with Fig. 4(b) that PS/PMMA composite has the highest wear depth. For BS/PMMA and SS/PMMA composites, although the displacement of SS/PMMA composite is higher than that of BS/PMMA composite, the hardness of 304 stainless steel is greater than that of brass. Thus, SS/PMMA composite has the smallest wear depth, as depicted in Fig. 4(b).4. Conclusions
(1) Regular and ordered spherical bulges (surface textures) are prepared by embedding brass microspheres (BS), 304 stainless steel microspheres (SS), and polyoxymethylene microspheres (PS) on the surfaces of PMMA-based composites. The friction coefficient and wear depth obey the following order: SS/PMMA < BS/PMMA < PS/PMMA. The lowest wear depth of the SS/PMMA composite is about 5.37 × 10⁻² mm, which is nearly 50% lower than the highest wear depth PS/PMMA composite of 10.76 × 10⁻² mm.(2) The main wear mechanisms of BS/PMMA and SS/PMMA composites are abrasive wear, fatigue wear, and adhesive wear. The main wear mechanisms of PS/PMMA composite are fatigue wear and adhesive wear.
(3) The temperature and displacement of PS/PMMA composite are significantly higher than those of BS/PMMA and SS/PMMA composites by finite element analysis. The accumulated friction heat and deformation significantly affect the wear mechanism, especially in the interface region.
Author contributions
Dapeng Gu: funding acquisition, writing – review & editing. Hui Xie: writing – original draft, validation. Ziyu Liu: software, visualization. Suwen Chen: conceptualization, methodology. Zibo Wang: data curation, investigation. Siyuan Gao: formal analysis.Conflicts of interest
There are no conflicts to declare.Acknowledgements
This work was supported by Natural Science Foundation of Hebei Province (Grant No. E E2019203033).Notes and references
- H. Yuan, S. Yang, X. Liu, Z. Wang, L. Ma, K. Hou, Z. Yang and J. Wang, Composites, Part A, 2017, 102, 9–17 CrossRef CAS.
- Z. Cai, M. Zhu, S. Yang, X. Xiao, X. Lin and H. Yu, Wear, 2011, 271, 2242–2251 CrossRef CAS.
- S. Gross, D. Camozzo, V. Di Noto, L. Armelao and E. Tondello, Eur. Polym. J., 2007, 43, 673–696 CrossRef CAS.
- A. Oral, M. A. Tasdelen, A. L. Demirel and Y. Yagci, Polymer, 2009, 50, 3905–3910 CrossRef CAS.
- R. Karthick, P. Sirisha and M. R. Sankar, Procedia Mater. Sci., 2014, 6, 1989–2000 CrossRef CAS.
- K. Friedrich, Z. Zhang and A. Schlarb, Compos. Sci. Technol., 2005, 65, 2329–2343 CrossRef CAS.
- S. Bahadur, Wear, 2000, 245, 92–99 CrossRef CAS.
- A. Akinci, S. Sen and U. Sen, Composites, Part B, 2014, 56, 42–47 CrossRef CAS.
- J. Zhang, J. Thermoplast. Compos. Mater., 2014, 27, 603–610 CrossRef CAS.
- G. Tang, X. Hu, T. Tang and C. Claramunt, Surf. Interface Anal., 2017, 49, 898–903 CrossRef CAS.
- G. Du and J.-J. Wang, Surf. Interface Anal., 2017, 49, 940–944 CrossRef CAS.
- L. D. Aguilera-Camacho, C. Hernández-Navarro, K. J. Moreno, J. S. García-Miranda and A. Arizmendi-Morquecho, J. Coat. Technol. Res., 2015, 12, 347–355 CrossRef CAS.
- F. K. Farhan, B. B. Kadhim, B. D. Ablawa and W. A. Shakir, Eur. J., Eng. Sci., Tech., 2017, 2, 6 Search PubMed.
- A. Usman and C. W. Park, Tribol. Int., 2016, 99, 224–236 CrossRef.
- S.-C. Vlădescu, S. Medina, A. V. Olver, I. G. Pegg and T. Reddyhoff, Tribol. Lett., 2016, 62, 19 CrossRef.
- N. Biboulet and A. A. Lubrecht, Tribol. Int., 2016, 96, 269–278 CrossRef.
- K. Zhang, K. Liu, T. Gao, Y. Qiao, Y. Zhang, X. Liu, W. Wang and J. Ye, Wear, 2021, 486–487, 204084 CrossRef CAS.
- X. Wang, W. Liu, F. Zhou and D. Zhu, Tribol. Int., 2009, 42, 1118–1123 CrossRef CAS.
- B. He, W. Chen and Q. Jane Wang, Tribol. Lett., 2008, 31, 187–197 CrossRef CAS.
- J. Ye, Y. Zhang, K. Zhang, W. Wang, X. Liu and K. Liu, Tribol. Lett., 2020, 68, 33 CrossRef CAS.
- J. Ye, K. Zhang, T. Gao, Y. Zhang, X. Liu and K. Liu, Tribol. Lett., 2019, 67, 56 CrossRef.
- D. Gu, Z. Wang, K. Liu, M. Xu, S. Chen, Z. Li, Z. Tang and S. Wang, Tribol. Trans., 2022, 1–12 Search PubMed.
- D. Gu, L. Zhang, S. Chen, K. Song and S. Liu, Polymers, 2018, 10, 966 CrossRef PubMed.
| This journal is © The Royal Society of Chemistry 2023 |

