 Open Access Article
Molecular dynamics study on defect evolution during the plastic deformation of nickel-based superalloy GH4169 single crystal under different rolling temperatures
Fang Yu a,
Jiachun Li*a and
Xun Luob
aCollege of Mechanical Engineering, Guizhou University, Guiyang, 550025, China. E-mail: lijiachunguid@163.com
bSchool of Mechatronic Engineering, Southwest Petroleum University, Chengdu, 610500, China
First published on 6th June 2023
Abstract
Nickel-based superalloy GH4169 is widely used as an important material in the aviation field. The rolling forming process can improve its surface quality and performance. Therefore, conducting an extensive investigation into the microscopic plastic deformation defect evolution process of nickel-based single crystal alloys during the rolling process is crucial. This study can offer valuable insights for optimizing rolling parameters. In this paper, a nickel-based superalloy GH4169 single crystal alloy was rolled at different temperatures from the atomic scale using the molecular dynamics (MD) method. The crystal plastic deformation law, dislocation evolution and defect atomic phase transition under different temperature rolling were studied. The results show that the dislocation density of nickel-based single crystal alloys increases as the temperature increases. When the temperature continues to increase, it is accompanied by an increase in vacancy clusters. When the rolling temperature is below 500 K, the atomic phase transition of the subsurface defects of the workpiece is mainly a Close-Packed Hexagonal (HCP) structure; when the temperature continues to increase, the amorphous structure begins to increase, and when the temperature reaches 900 K, the amorphous structure increases significantly. This calculation result is expected to provide a theoretical reference for the optimization of rolling parameters in actual production.
1. Introduction
Nickel-based superalloy GH4169 is widely used in important industrial fields as a main part, such as heat transfer tubes, integral impellers, and blades in aerospace and nuclear power plant manufacturing.1 The excellent properties of nickel-based alloys are enhanced by specially designed precision forming processes, and stress damage also occurs during processing and forming, for example, cutting can improve surface quality, and cutting hardening will increase material brittleness and stress damage to subsurface,2,3 which adversely affects the performance of the workpiece. To eliminate the influence of cutting on material damage, the surface rolling process is usually carried out after the cutting process is completed to improve the surface quality and strength of the workpiece. To improve the surface strength of nickel-based alloy bolts, the rolling process is widely used in aviation fastener processing.The research on the microscopic evolution process of the rolling plastic deformation of nickel-based single crystal alloy can not only deeply understand the rolling process to improve the surface quality and strengthening mechanism but also provide theoretical references for the optimization of rolling process parameters. At present, there are great technical difficulties in observing the evolution process of the micro-plastic deformation of nickel-based single crystal alloys in macro-rolling experiments, such as observing the evolution process of dislocations and defect atoms. However, the microscopic deformation evolution process of materials can be well simulated by applying the MD method. To study and predict the processing deformation behaviour of materials at the nanoscale, MD simulation has proven to be a very powerful computational method.4,5 MD has been widely used to analyze nanometric machining.6–9 For example, Wang et al.10 revealed the unique deformation mechanism of dislocation interaction in the confined volume of nanocrystals by molecular MD. Madec et al.11 studied the role of collinear interaction in dislocation-induced hardening using the MD method and found that the interaction between two dislocations with collinear Burgers vector in the intersecting slip plane is the strongest of all reactions so far.
Owing to the high cost of nickel-based alloys, the rolling process uses plastic deformation of materials rather than material removal to achieve the purpose of forming.12 Therefore, the rolling process has special economic value for nickel-based alloy processing.13,14 Similarly, the rolling process can improve the corrosion resistance and fatigue life of the machined surface while improving the surface quality and strength of the nickel-based alloy.15 At present, the research on the rolling process is mainly to optimize the rolling parameters (i.e., rolling speed, rolling force, rolling depth and rolling times).16 For example, Banh et al.12 designed and manufactured a new ball grinding tool for improving the surface quality and hardness of the machined surface and determined the optimal ball rolling conditions. Saalfeld et al.17 conducted deep rolling research on steel SAE 1045 and found that the residual stress relaxation behavior under deep rolling material conditions is strongly affected by the cyclic yield strength of each material state, so it is related to cyclic plastic deformation. Rodríguez et al.18 conducted a complete experiment and analysis of deep rolling, and they confirmed that it can not only improve the surface quality but also have a positive impact on the compressive residual stress. Amdouni et al.19 studied six rolling strategies for 2017A-T451 aluminum alloy, and their results show that the two-pass cross-ball rolling strategy has the best potential to improve surface roughness. However, the two-pass ball milling strategy is best for improving surface hardness. Beghini et al.20 studied the influence of rolling pressure and rolling amount on 7075-T6 aluminium alloys; their results showed that the surface hardness was significantly affected by the feed rate, whereas the rolling force was insignificantly affected. Huang et al.21 studied the differential speed of the rolling amount of Mg–3Al–1Zn alloy. Their results showed that with the increase in pass reduction, the number of unidirectional shear bands increased, resulting in a more uniform microstructure in the middle layer and a weaker basal texture. However, although there are numerous studies on the rolling process, there are few studies on the micro-evolution process of plastic deformation of rolling materials and the influence of different rolling temperatures on nickel-based single crystal alloys.
Therefore, in this study, the MD method is used to simulate the nickel-based single crystal alloy at different rolling temperatures (300 K, 500 K, 700 K, and 900 K). The rolling surface morphology, such as rolling force, atomic kinetic energy and rolling surface atomic accumulation, were analyzed. The dislocation evolution was analyzed by performing dislocation analysis (DXA), and the evolution of defect atoms was analyzed by common neighbour analysis (CNA). In this way, it provides insights for understanding the influence of different rolling temperatures on nickel-based single crystal alloys and provides a theoretical reference for optimizing the nano-rolling parameters of nickel-based single crystal alloys.
2. Simulation models and methods
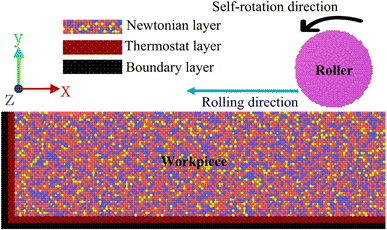
The sketch of the nano-rolling model is shown in Fig. 1; the model comprises a rolling ball and a workpiece. The workpiece is set to a face-centered cubic (FCC) single crystal structure, which is divided into boundary, thermostat and Newtonian layers. The boundary layer is used to fix the workpiece, the thermostat layer is set to constant temperature to simulate the actual rolling process, the Newtonian layer is the deformable part of the workpiece rolling, and the atom follows Newton's second theorem.22 Owing to the complex composition of nickel-based superalloy GH4169, elements with low content are ignored in the simulation process.2,3,23 To be close to the actual material performance parameters, the three highest content elements Ni, Fe and Cr are considered in the calculation, and their contents are 52%, 30% and 18%, respectively.24 In the actual rolling process, the material of the rolling ball is significantly larger than the hardness of the workpiece. Therefore, in the simulation process, the rolling ball is set to an undeformable diamond structure. The rolling speed and self-rotation speed of the rolling ball are 45 m s−1 and 40 m s−1, respectively. It is noteworthy that this is higher than the actual rolling speed; however, many studies have shown that high speed in MD simulation can better reveal the deformation mechanism of materials.25–28 The rolling direction is [−1 0 0], and the specific rolling parameters are shown in Table 1.| Variable name | Variable value |
|---|---|
| Dimensions of the workpiece specimen | 86 nm × 26 nm × 26 nm (X, Y and Z-direction) |
| Number of Ni atoms in the specimen | 120![[thin space (1/6-em)]](https://www.rsc.org/images/entities/char_2009.gif) 924 924 |
| Number of Fe atoms in the specimen | 69![[thin space (1/6-em)]](https://www.rsc.org/images/entities/char_2009.gif) 763 763 |
| Number of Cr atoms in the specimen | 41![[thin space (1/6-em)]](https://www.rsc.org/images/entities/char_2009.gif) 857 857 |
| Diamond of the roller radius | 3 nm |
| Number of carbon atoms in the diamond | 19![[thin space (1/6-em)]](https://www.rsc.org/images/entities/char_2009.gif) 961 961 |
| Rolling speed | 45 m s−1 |
| Diamond of the roller self-rotation speed | 40 m s−1 |
| Rolling deep | 2 nm |
| Rolling surface | (0 1 0) |
| Rolling direction | [−1 0 0] |
| Rolling distance | 18 nm |
| Timestep | 1 fs |
The accuracy of the calculation results is closely related to the potential function. To ensure the reliability of the simulation results, the interaction between the Ni, Fe and Cr atoms of the workpiece adopts the EAM29 alloy potential, and the potential file adopts 2013-Bonny NiFeCr.EAM.alloy.30 The EAM alloy calculation formula is as follows31,32:
 | (1) |
The interaction Morse between the rolling ball C atom and the workpiece NiFeCr atom is adopted, and the detailed parameters are shown in Table 2.33 The equation of the Morse function is calculated as follows:34
| E = D0[e−2a(r −r0) − 2e−a(r −r0)], r < rc | (2) |
| Atomic species | D (eV) | a (1/A) | r0 (A) |
|---|---|---|---|
| Ni–C | 1.009392 | 1.98745 | 2.61994 |
| Fe–C | 1.005664 | 1.97175 | 2.649299 |
| Cr–C | 1.034172 | 2.06355 | 2.617589 |
To eliminate the influence of the random distribution of Fe and Cr atoms in the model on the structural stability and the accuracy of the calculation results, we use the energy minimization modeling method to construct 100 models and select four of them. The minimum energy model is calculated, and the average value of the calculation results of the four models is taken. To make the model structure atoms reach a full equilibrium state, the model was relaxed for 100 ps before rolling. To eliminate the influence of the size effect, periodic boundary conditions are adopted in the Z-direction, and the whole simulation process is carried out under a microcanonical ensemble (NVE).35 The temp/rescale temperature control method was adopted. Lammps36 and Ovito37 are used for calculation and visualization, respectively.
3. Results and discussion
The rolling process is divided into three stages. The first stage is when the roller presses down to the specified 2 nm rolling depth. The second stage occurs when the roller rolls at 18 nm in the [−1 0 0] direction. The third stage is the unloading stage, that is, the roller is separated from the workpiece. In this study, the evolution process of plastic deformation defects of nickel-based single crystal alloy during the second stage rolling process is mainly analyzed.3.1. Surface morphology analysis
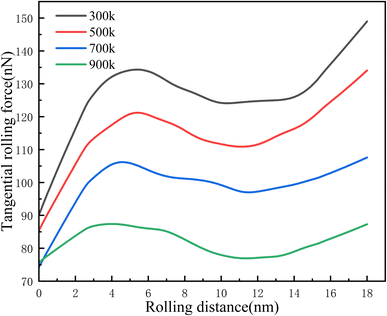
Rolling force is an important factor in measuring the ability of a material to resist deformation. Rolling force mainly comes from overcoming the elastic deformation and plastic deformation of the material, as well as the friction resistance between the rolling ball and the workpiece.38 Generally, the rolling force comprises two parts: normal (Y-direction) and tangential (X-direction).39 The tangential rolling force mainly overcomes rolling resistance, while the normal rolling force mainly affects surface quality.Fig. 2 shows the variation curve of the tangential rolling force with rolling distance at different temperatures. It can be observed that the tangential rolling force increases rapidly from the beginning of rolling. With the increase in rolling distance, the increasing trend begins to flatten; in the later stage of rolling, the tangential rolling force begins to increase with the accumulation of atoms at the front end of the rolling ball. With an increase in the rolling temperature, the tangential rolling force is smaller. This shows that with an increase in rolling temperature, the tangential rolling resistance of nickel-based single crystals decreases gradually.
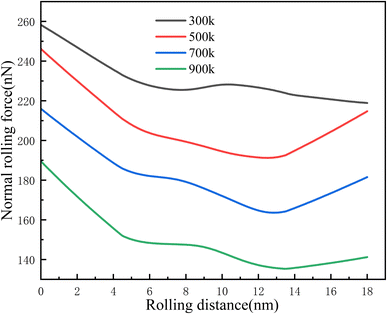
Fig. 3 shows the curve of the normal rolling force with rolling distance at different temperatures. It can be clearly observed that the normal rolling force decreases rapidly from the beginning of rolling, and the normal rolling force decreases gradually with the increase in distance. The normal rolling force decreases with an increase in temperature. This indicates that with an increase in temperature, the ability of nickel-based single crystal alloy to resist deformation decreases.
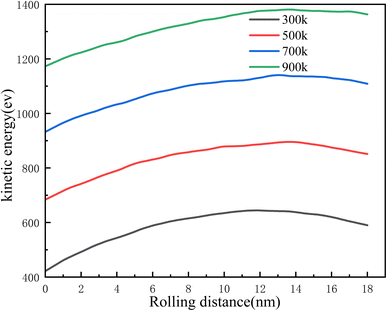
Atomic kinetic energy is an important measure of atomic activity in the model. Fig. 4 shows the statistics of subsurface atomic kinetic energy at different rolling temperatures. We find that as the rolling distance increases, the kinetic energy tends to increase slowly. As the rolling distance continues to increase, the increasing trend of kinetic energy begins to slow down, and the kinetic energy of subsurface atoms increases as the temperature increases.
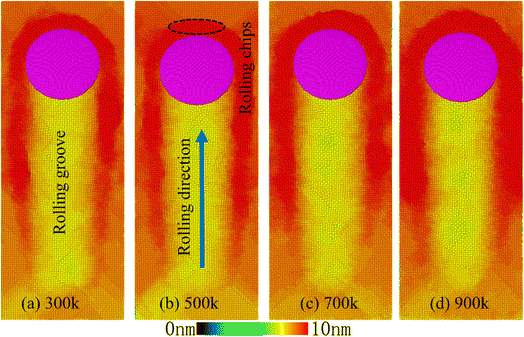
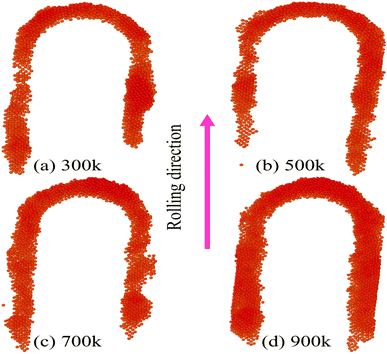
Fig. 5 is a sketch of the rolling surface topography. We observed that as the rolling ball rolled forward, the atoms accumulate to the front end of the rolling groove and the front end of the roller, and the accumulation was more obvious as the rolling distance increased. Fig. 6 is a schematic diagram of atomic accumulation on the surface rolled at different temperatures. It can be observed that, during the rolling process, as the temperature increases, the atoms accumulate more seriously on both sides of the rolling and in front of the rolling. This is because as the temperature increases, the kinetic energy of the atoms inside the crystal increases. When subjected to external loads, the possibility of atoms moving increases. Some atoms are squeezed to rearrange to a new stable structure, and some atoms are squeezed to the surface of the model. Therefore, the higher the temperature, the more significant the accumulation of atoms on the model surface during the rolling process.
3.2. Dislocation evolution analysis
The generation and movement of dislocations is one of the main methods of plastic deformation in nickel-based single crystal alloys, and dislocation density is an important measure of the degree of plastic deformation of the workpiece. Therefore, we use the DXA40 analysis method to statistically analyze the dislocation density of workpieces rolled at different temperatures, and we compare the distribution of dislocation line types on the subsurface of workpieces rolled at differdent temperatures. The dislocation density calculation formula is as follows:1
 | (3) |
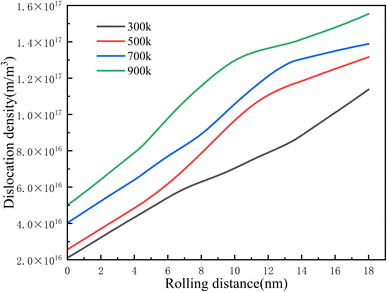
Fig. 7 shows the evolution curve of dislocation density at different rolling temperatures. We found that in the initial stage of rolling, the higher the temperature, the higher the dislocation density. As the rolling distance increases, the dislocation density increases. However, the higher the temperature, the more significant the increase in dislocation density.
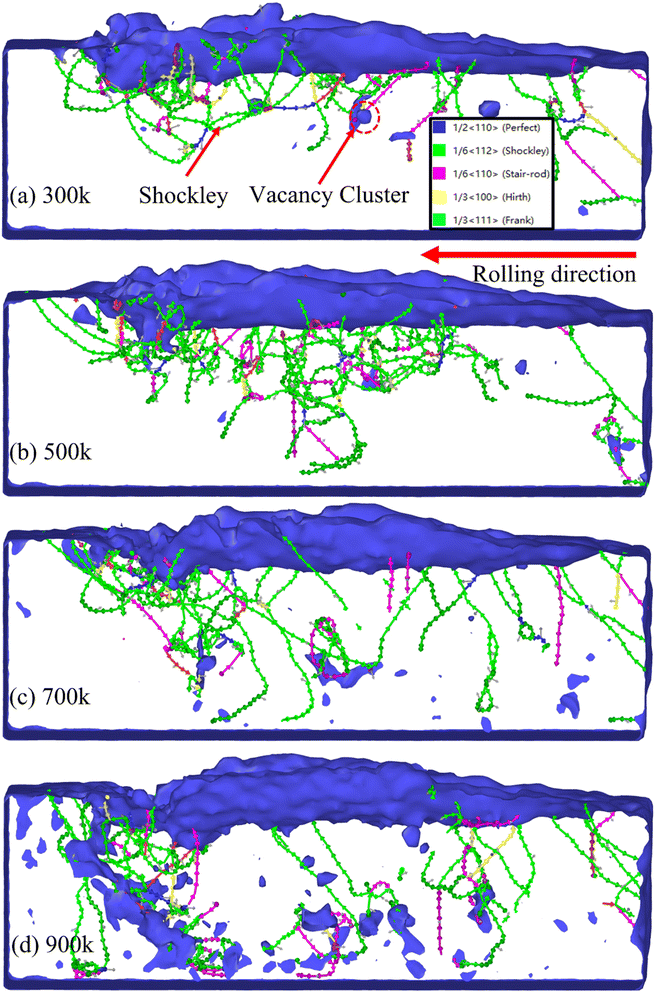
Fig. 8 shows the distribution of dislocation types in the workpiece after rolling at different temperatures. It can be observed that plastic deformation occurs in GH4169 single crystal alloy, and the dislocation type is mainly 1/6 (1 1 2) Shockley. Kurpaska et al.41 studied nickel-based single crystal alloys through nanoindentation experiments and simulations; the results also show that the plastic deformation dislocations of nickel-based single crystal alloys are mainly 1/6 (1 1 2) Shockley, which verifies the reliability of the model and calculation results in this study. With an increase in rolling temperature, the vacancy clusters increase with the generation and increase in dislocations. In addition, the higher the temperature, the wider the depth and range of defects affecting the subsurface of the workpiece, as shown in Fig. 8(a)–(d).
Several scholars10,42 have studied through experiments and simulations and believe that the plastic deformation of metal alloys is closely related to point, line, surface and body dislocations. Sun et al.43 through experimental research further revealed that the microscopic mechanism of plastic deformation of GH4169 alloy is the generation and movement of dislocations in the material and dislocations release energy in a slip way during plastic deformation.44 As the rolling temperature increases, the kinetic energy of the model system increases; when the strain energy stored in the deformed lattice exceeds a certain level, the atoms are rearranged to the lower lattice in turn to relax the lattice strain.27 A large number of dislocations are generated on the subsurface near the workpiece in contact with the rolling ball, as shown in Fig. 8(b). As the rolling temperature continues to increase, the atoms at the original position of some vacancy defects begin to deviate from the equilibrium position to form many clusters,45 as shown in Fig. 8(c) and (d). Zhang et al.46 through experiments found that many Cr elements were found in the cluster samples formed by nickel-based alloys at high temperatures. It is believed that the formation of clusters is closely related to Cr elements. With an increase in temperature, the generation and annihilation of dislocations are accelerated,1 and the ability of dislocations to interact with precipitates to resist material deformation is reduced.47 When the rolling temperature is low, the propagation velocity of plastic waves is low, and many dislocations are easy to nucleate and diffuse into the dislocation network, which hinders dislocation movement.44 Simultaneously, these dislocations capture each other with the minimum energy to achieve strain hardening,11 resulting in a greater rolling force. On the contrary, when the rolling temperature increases, the propagation speed of the plastic wave is faster, the generation, movement and annihilation of dislocations are faster, the difficulty of dislocation nucleation increases, the hindrance to dislocation movement decreases, and the difficulty of dislocation capturing each other to form a stable configuration increases. Therefore, the ability to resist deformation is reduced, and the rolling force generated is smaller.
3.3. Defect atom evolution analysis
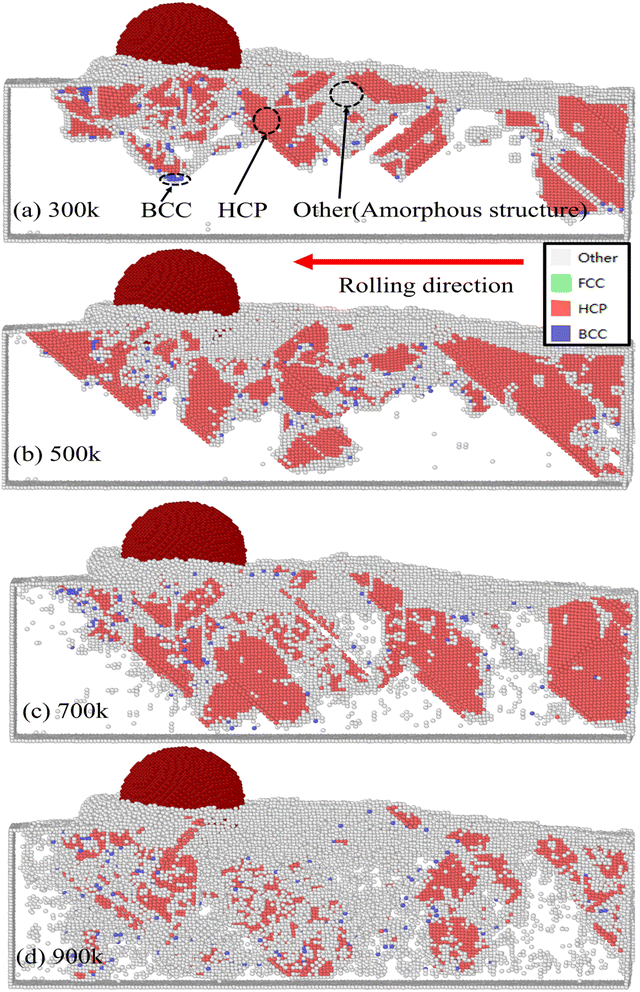
The evolution of defect atoms in nickel-based single crystal alloys is an important measure to determine the degree of plastic deformation. Therefore, we use the CNA48,49 analysis method to analyze the defect atoms of nickel-based single crystal alloys at different rolling temperatures.Fig. 9 shows a schematic diagram of the subsurface phase transformation structure at different rolling temperatures (to better show the effect of the phase transformation structure, the FCC structure atoms are deleted). We can see that the phase transition structure of GH4169 nickel-based single crystal alloy is dominated by the HCP, BCC and amorphous structures after plastic deformation by rolling. Zhang et al.23 studied the cutting of GH4169 by MD and found that the plastic deformation defect atomic phase transition is mainly HCP, BCC and amorphous structures, which is basically consistent with the calculation results in this study. This shows that the calculation results of the model constructed in this study have certain reliability. At 300 K and 500 K, the phase transition structure is mainly HCP, as shown in Fig. 9(a) and (b). As the temperature increases to 700 K, the amorphous structure begins to increase rapidly. When the rolling temperature reaches 900 K, the amorphous structure increases significantly based on 700 K, as shown in Fig. 9(c) and (d).
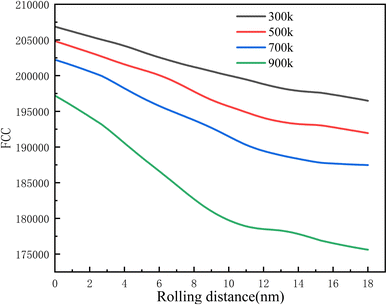
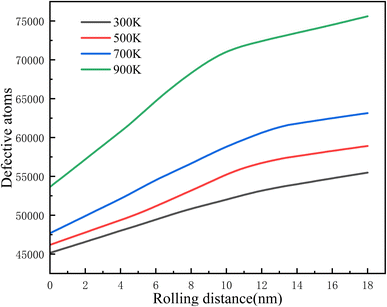
Fig. 10 and 11 show the evolution of the FCC structure and defect atoms with an increase in rolling distance. It can be clearly observed that with the increase in the rolling distance, the higher the temperature, the more obvious the decrease in the number of FCC structure atoms, and simultaneously, the more significant the increase in defect atoms.
Wang et al.45 demonstrated that during the deformation of the material, the subsurface atoms released a large amount of energy. The stacking faults migrate to the surface and eventually disappear. However, owing to the existence of step dislocations with relatively stable structures, subsurface defects are eventually formed. Hao et al.1 believed that the nickel-based single crystal alloy was regulated by the strong competition between twin nucleation and dislocation movement during plastic deformation. Owing to the competition between twins and dislocations, the FCC was transformed into an HCP structure. With an increase in rolling temperature, the atomic energy of the workpiece exceeds a certain level. When subjected to an external load, a part of the atoms is rearranged to a lower lattice to form a stable structure, and a part of the atoms cannot reach a lower lattice position during movement, thus forming an unstable amorphous structure. The higher the temperature, the greater the atomic fluctuation, and the more significant the amorphous structure formed.
4. Conclusions
In this study, GH4169 nickel-based single crystal alloy was rolled at different rolling temperatures to study the evolution process of micro-plastic deformation defects. The surface morphology, dislocation evolution and atomic defect evolution were analyzed using DXA and CNA methods. In this way, we hope to provide new ideas for the optimization of the nanorolling process parameters of GH4169 nickel-based single crystal alloy. The main conclusions are as follows:(a) With an increase in rolling temperature, the deformation resistance of the nickel-based single crystal alloy surface decreases, the tangential and normal rolling force decreases, and the stacking atoms on the rolling surface increase.
(b) The dislocation density increases with the increase in rolling temperature; when the temperature reaches more than 700 K, the vacancy clusters increase.
(c) When the rolling temperature is below 500 K, the subsurface plastic deformation phase transformation of the workpiece is mainly HCP; when the temperature reaches 700 K, the amorphous structure increases, and when the temperature is 900 K, the amorphous phase structure increases significantly.
Conflicts of interest
There are no conflicts to declare.Acknowledgements
The authors wish to thank the Supported by the Guizhou Province Science and Technology Planning Project (Grant No. [2022] 196).References
- H. Zhaopeng, L. Zaizhen and F. Yihang, J. Manuf. Process., 2021, 68, 14–33 CrossRef.
- Z. Hao, Z. Lou and Y. Fan, Precis. Eng., 2021, 68, 35–56 CrossRef.
- Z. Hao, Z. Lou and Y. Fan, Precis. Eng., 2020, 66, 347–362 CrossRef.
- S. Huang and C. Zhou, JOM, 2017, 69, 2256–2263 CrossRef.
- W. Wu, Y. Hu, X. Meng, J. Dai and H. Dai, J. Manuf. Process., 2022, 79, 356–368 CrossRef.
- J. J. Zhang, T. Sun, A. Hartmaier and Y. D. Yan, Comput. Mater. Sci., 2012, 59, 14–21 CrossRef CAS.
- R. Komanduri, N. Chandrasekaran and L. M. Raff, Wear, 2000, 240, 113–143 CrossRef CAS.
- T.-H. Fang and C.-I. Weng, Nanotechnology, 2000, 11, 148–153 CrossRef CAS.
- Q. Pei, C. Lu, H. Lee and Y. Zhang, Nanoscale Res. Lett., 2009, 4, 444 CrossRef CAS PubMed.
- J. Wei Wang, S. Narayanan, J. Yu Huang, Z. Zhang, T. Zhu and S. X. Mao, Nat. Commun., 2013, 4, 2340 CrossRef PubMed.
- R. Madec, B. Devincre, L. Kubin, T. Hoc and D. Rodney, Science, 2003, 301, 1879–1882 CrossRef CAS PubMed.
- Q.-N. Banh and F.-J. Shiou, Arabian J. Sci. Eng., 2016, 41, 639–652 CrossRef CAS.
- K. Vijay Reddy and S. Pal, Comput. Mater. Sci., 2020, 184, 109935 CrossRef CAS.
- P. Balland, L. Tabourot, F. Degre and V. Moreau, Int. J. Mach. Tools Manuf., 2013, 65, 29–36 CrossRef.
- N. H. Loh, S. C. Tam and S. Miyazawa, J. Mech. Work. Technol., 1989, 18, 53–61 CrossRef.
- M. H. El-Axir, Int. J. Mach. Tools Manuf., 2000, 40, 1603–1617 CrossRef.
- S. Saalfeld, M. Krochmal, T. Wegener, B. Scholtes and T. Niendorf, Int. J. Fatigue, 2021, 151, 106360 CrossRef CAS.
- A. Rodríguez, L. N. López de Lacalle, A. Celaya, A. Lamikiz and J. Albizuri, Surf. Coat. Technol., 2012, 206, 2817–2824 CrossRef.
- H. Amdouni, H. Bouzaiene, A. Montagne, A. Van Gorp, T. Coorevits, M. Nasri and A. Iost, Int. J. Adv. Manuf. Technol., 2017, 90, 2271–2282 CrossRef.
- M. Beghini, L. Bertini, B. D. Monelli, C. Santus and M. Bandini, Surf. Coat. Technol., 2014, 254, 175–186 CrossRef CAS.
- X. Huang, K. Suzuki, A. Watazu, I. Shigematsu and N. Saito, Scr. Mater., 2009, 60, 964–967 CrossRef CAS.
- S. Shimada, N. Ikawa, H. Tanaka, G. Ohmori, J. Uchikoshi and H. Yoshinaga, CIRP Ann., 1993, 42, 91–94 CrossRef.
- P. Zhang, Q. Zhang, Y. Fang, X. Yue, X. Yu and Y. Wang, Vacuum, 2021, 192, 110439 CrossRef CAS.
- Y. Fan, W. Wang, Z. Hao and C. Zhan, J. Alloys Compd., 2020, 819, 153331 CrossRef CAS.
- H. Dai, G. Chen, C. Zhou, Q. Fang and X. Fei, Appl. Surf. Sci., 2017, 393, 405–416 CrossRef CAS.
- P. Zhu, Y. Hu, T. Ma and H. Wang, Tribol. Lett., 2011, 41, 41–46 CrossRef.
- J. J. Zhang, T. Sun, Y. D. Yan, Y. C. Liang and S. Dong, Appl. Surf. Sci., 2008, 254, 4774–4779 CrossRef CAS.
- Y. Wang, J. Shi and C. Ji, Appl. Phys. A, 2014, 115, 1263–1279 CrossRef CAS.
- G. J. Ackland and H. Fox, J. Phys.: Condens. Matter, 2005, 17, 1851–1859 CrossRef CAS.
- G. Bonny, N. Castin and D. Terentyev, Modell. Simul. Mater. Sci. Eng., 2013, 21, 085004 CrossRef CAS.
- M. S. Daw and M. I. Baskes, Phys. Rev. B: Condens. Matter Mater. Phys., 1984, 29, 6443–6453 CrossRef CAS.
- M. S. Daw and M. I. Baskes, Phys. Rev. Lett., 1983, 50, 1285–1288 CrossRef CAS.
- Z. Hao, R. Cui, Y. Fan and J. Lin, Int. J. Mech. Sci., 2019, 150, 625–636 CrossRef.
- Q. X. Pei, C. Lu, F. Z. Fang and H. Wu, Comput. Mater. Sci., 2006, 37, 434–441 CrossRef CAS.
- K. D. Hammonds and D. M. Heyes, J. Chem. Phys., 2021, 154, 174102 CrossRef CAS PubMed.
- S. Plimpton, J. Comput. Phys., 1995, 117, 1–19 CrossRef CAS.
- A. Stukowski, Modell. Simul. Mater. Sci. Eng., 2010, 18, 015012 CrossRef.
- X. Meng, W. Wu, B. Liao and H. Dai, Ceram. Int., 2022, 48, 17034–17045 CrossRef CAS.
- H. Dai, F. Zhang and J. Chen, Int. J. Mech. Sci., 2019, 157–158, 254–266 CrossRef.
- A. Stukowski, V. V. Bulatov and A. Arsenlis, Modell. Simul. Mater. Sci. Eng., 2012, 20, 085007 CrossRef.
- L. Kurpaska, F. J. Dominguez-Gutierrez, Y. Zhang, K. Mulewska, H. Bei, W. J. Weber, A. Kosińska, W. Chrominski, I. Jozwik, R. Alvarez-Donado, S. Papanikolaou, J. Jagielski and M. Alava, Mater. Des., 2022, 217, 110639 CrossRef CAS.
- K. Lu, L. Lu and S. Suresh, Science, 2009, 324, 349–352 CrossRef CAS PubMed.
- Z. Sun, H. Wang, Y. Ye, Z. Xu and G. Tang, Int. J. Adv. Des. Manuf. Technol., 2018, 95, 2835–2842 CrossRef.
- Q. Fang, Q. Wang, J. Li, X. Zeng and Y. Liu, RSC Adv., 2017, 7, 42047–42055 RSC.
- Q. Wang, Q. Bai, J. Chen, Y. Sun, Y. Guo and Y. Liang, Appl. Surf. Sci., 2015, 344, 38–46 CrossRef CAS.
- Q. Zhang, Y. Chang, L. Gu, Y. Luo and B. Ge, Scr. Mater., 2017, 126, 55–57 CrossRef CAS.
- A. Prakash, J. Guénolé, J. Wang, J. Müller, E. Spiecker, M. J. Mills, I. Povstugar, P. Choi, D. Raabe and E. Bitzek, Acta Mater., 2015, 92, 33–45 CrossRef CAS.
- J. D. Honeycutt and H. C. Andersen, J. Phys. Chem., 1987, 91, 4950–4963 CrossRef CAS.
- D. Faken and H. Jónsson, Comput. Mater. Sci., 1994, 2, 279–286 CrossRef CAS.
| This journal is © The Royal Society of Chemistry 2023 |

