DOI:
10.1039/D3RA02168H
(Paper)
RSC Adv., 2023,
13, 14506-14516
Ganoderma lucidum bran-derived blue-emissive and green-emissive carbon dots for detection of copper ions†
Received
2nd April 2023
, Accepted 2nd May 2023
First published on 12th May 2023
Abstract
Ganoderma lucidum bran (GB) has a broad application prospect in the preparation of activated carbon, livestock feed, and biogas, but the preparation of carbon dots (CDs) from GB has never been reported. In this work, GB was applied as a carbon source and nitrogen source to prepare both blue fluorescent CDs (BCDs) and green fluorescent CDs (GCDs). The former were prepared at 160 °C for 4 h by a hydrothermal approach, while the latter were acquired at 25 °C for 24 h by chemical oxidation. Two kinds of as-synthesized CDs exhibited unique excitation-dependent fluorescence behavior and high fluorescent chemical stability. Based on the fantastic optical behavior of the CDs, they were utilized as probes for fluorescent determination of copper ions (Cu2+). In the range of 1–10 μmol L−1, the fluorescent intensity of BCDs and GCDs decreased linearly with the increase of Cu2+ concentration; the linear correlation coefficient reached 0.9951 and 0.9982, and the limit of detection (LOD) was 0.74 and 1.08 μmol L−1, respectively. In addition, these CDs remained stable in 0.001–0.1 mmol L−1 salt solutions; BCDs were more stable in the neutral pH range, but GCDs were more stable in neutral to alkaline conditions. The CDs prepared from GB are not only simple and low-cost, but also can realize the comprehensive utilization of biomass.
1. Introduction
The application of heavy metals and their compounds is more and more extensive, and the discharge of wastewater containing heavy metals is also increasing with a rapid development of chemical industry.1 Heavy metals can interact with ligands in the soil to form complexes or chelates, resulting in more excellent solubility and migration activity of heavy metals in soil. The long-term accumulation of heavy metals in the body will cause significant damage to the kidneys and bones.2,3 They comprise one of the most harmful pollutants to human health. Heavy metals cannot be degraded by microorganisms and are potential long-term environmental harmful substances.4 In recent years, great efforts have been made to develop efficient heavy metal detection techniques to prevent the increase of heavy metal concentrations, such as ultraviolet spectrophotometry,5 atomic absorption spectrometry,6 fluorescence spectrometry,7 inductively coupled plasma,8 atomic fluorescence spectrometry,9 and inductively coupled plasma mass spectrometry.10 Among them, fluorescence spectrometry is one of the most economical and promising strategies for detecting heavy metals.11 The advantage of fluorescent spectrometry is non-destructive testing, and which can directly analyze finished products.
The increase of global population has led to a sharp growth in the demand for food, which has contributed to the accumulation of agricultural waste.12 Agricultural waste is known to be rich in lignocellulose. Rational disposal of agricultural waste has far-reaching significance. On the one hand, it can reduce environmental pressure, on the other hand, it can create economic value. Therefore, it is necessary to develop new ways to employ agricultural waste.13–15 A large number of fungus brans, like GB are piled up everywhere, which not only wastes resources but also pollutes the environment.16 The comprehensive utilization of agricultural wastes must be paid attention to achieving sustainable development. The GB is the residue after harvest cultivated with rice straw, wood chips and other raw materials,17 and usually composed of cellulose, hemicellulose, and lignin, each of which can be utilized as a raw material for valuable chemicals.18,19 After the edible fungi are collected, a large number of mycelium and beneficial bacteria are left on the rod, and a variety of sugars, organic acids, enzymes, and bioactive substances are produced through enzymatic hydrolysis during the growth of mycelium.20 The bacterial residue is rich in protein, cellulose, and amino acids.21 Here, the degradation of GB into high value-added products is expected.
CDs is a new type of zero-dimensional carbon nanomaterials composed of ultrafine, dispersed, quasi-spherical carbon nanoparticles with a size of less than 10 nm. Compared with other nanomaterials, CDs exhibits their unique characteristics, such as low toxicity, good solubility, chemical durability and remarkable photoluminescence, thus demonstrating application prospects in many fields, such as optoelectronics medical imaging technology, environmental monitoring, chemical analysis, catalyst preparation, energy development, and so on. Many methods for preparing CDs have been proposed, which can be roughly divided into “top–down” and “bottom–up” methods. Compared with the former method, the latter is more diverse. Various biomass materials (such as watermelon peel, coconut shell, orange juice, silkworm leaves, etc.), organic molecules (such as citric acid, sugars, amino acids, ammonium citrate, etc.), and macromolecules (such as chitosan, polyethylene glycol, bovine serum albumin, etc.) can be adopted as precursors.22–25 However, synthesizing CDs from organic reagents and polymers do not conform to the concept of green chemistry. Agricultural by-products as carbon sources to prepare high-value-added carbon materials have attracted significant attention because biomass is renewable, which aligns with green chemistry and sustainable development concepts. Methods for preparing CDs include are discharge method,26 laser ablation method,27 chemical oxidation method,28 electrochemical method,29 template method,30 hydrothermal method,31 direct pyrolysis method,32 and microblog-assisted method.33 In this case, two kinds of CDs were prepared by hydrothermal and chemical oxidation, and their fluorescence quenching for different metal ions and stability were investigated. In this study, CDs with two colors were prepared by a simple method with very sensitive detection of Cu2+, providing a new source of carbon for the preparation of detection materials and realizing a high-value use of waste agricultural crops.
2. Experimental section
2.1 Reagents and materials
Sodium hydroxide (NaOH) and hydrogen peroxide (H2O2) were provided by Aladdin Industries Co., Ltd (Shanghai, China). Standard solutions of metal ions (Zn2+, Ca2+, Li+, Cd2+, Co2+, Cr3+, Cu2+, Fe3+, K+, Mg2+, Na+, Pb2+ and Zr4+) were prepared with ultrapure water from respective metal salts of ZnCl2, CaCl2, LiCl, Cd(NO3)2·4H2O, CoCl2·6H2O, Cr(NO3)3·9H2O, CuSO4, FeCl3·6H2O, KCl, Mg(NO3)2, NaCl, Pb(NO3)2 and ZrCl4, which were also from Aladdin (Shanghai). Hydrochloric acid (HCl) was provided by Sinopharm Chemical Reagent (Shanghai). GB was provided by Ningxia Academy of Agricultural and Forestry Sciences (Yinchuan, China).
2.2 Preparation of CDs
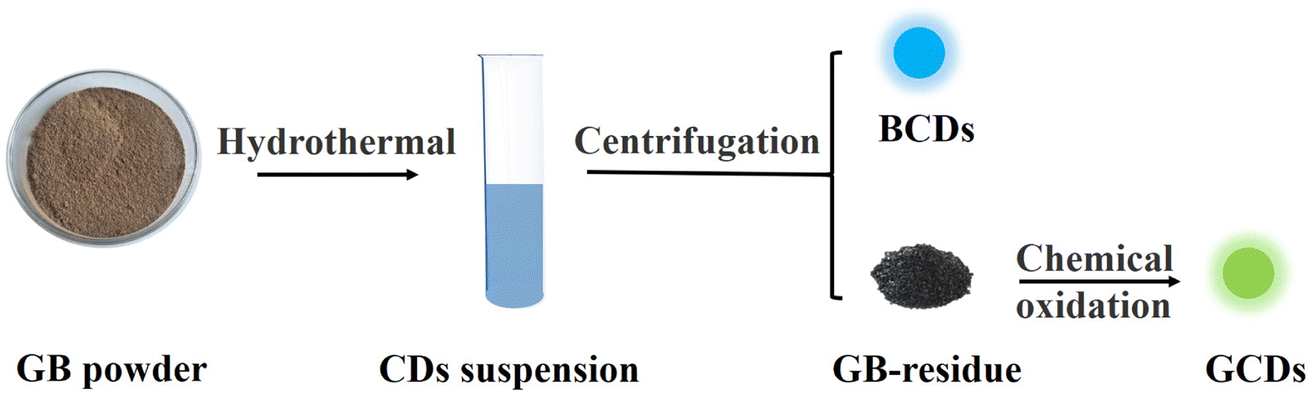
The schematic process is shown in Fig. 1. First, GB was cut into 2–3 mm and dried in an oven at 60 °C for 24 h, and then crushed by a high-energy grinder. After screened through 30 mesh, the GB powder was dispersed into 60 ml of deionized water and placed in a reaction kettle and reacted at 160 °C for 4 h. After the reaction kettle was cooled to room temperature, the BCDs and the GB-residue were generated and separated by centrifugation. The GB-residue further reacted in a solution containing 0.2 mol L−1 NaOH and H2O2 (5![[thin space (1/6-em)]](https://www.rsc.org/images/entities/char_2009.gif) :1, v/v) at 25 °C for 24 h. After the reaction, the obtained GCDs suspension was neutralized with HCl. Thus, the GCDs was fabricated by chemical oxidation. The reacted liquid is filtered through a 0.22 μm microporous membrane to remove insoluble impurities. The CDs solution was then dialyzed with a dialysis membrane (MV = 1000 Da) for 24 h. The obtained CDs were stored at 4 °C for further assays.
:1, v/v) at 25 °C for 24 h. After the reaction, the obtained GCDs suspension was neutralized with HCl. Thus, the GCDs was fabricated by chemical oxidation. The reacted liquid is filtered through a 0.22 μm microporous membrane to remove insoluble impurities. The CDs solution was then dialyzed with a dialysis membrane (MV = 1000 Da) for 24 h. The obtained CDs were stored at 4 °C for further assays.
 |
| | Fig. 1 Schematic diagram of preparation of BCDs and GCDs. | |
2.3 Characterization of material
Transmission electron microscopy (TEM) images were obtained by FEI Tecnai G2 F20 (China). Surface functional groups were determined by Fourier-transform infrared spectroscopy (FT-IR, presri-21400–4000 cm−1). X-ray photoelectron spectroscopy (XPS) was performed on ESCALAB 250XI XPS spectrometer (Thermo Scientific, USA). Fluorescence spectra were measured with a fluorescence spectrometer (RF-5301 PC, Shimadzu, Japan). X-ray diffraction was obtained by scanning with Smartlab SE (XRD, XRD-6100200 Ma, Japan). Fluorescent characteristics were analyzed by an ultraviolet-visible spectrophotometer (UV, TU-1950).
2.4 Fluorescent property of CDs
2.4.1 Fluorescent quantum yield CDs. Fluorescent quantum yield is an important parameter to evaluate the fluorescent ability of materials. Therefore, the fluorescent quantum yield of CDs was estimated according to the standard method. Quinine sulfate with similar excitation wavelength (366 nm) was selected as the standard reference. The fluorescent quantum yield could be calculated according to the eqn (1):| | |
Y1 = (Y2 × S1 × A2 × n12)/(S2 × A1 × n22)
| (1) |
where Y is the fluorescent quantum yield, S is the fluorescent peak area, A is the absorbance, and n is the refractive index of the solvent. Quinine sulfate was selected in this experiment. The literature shows that its quantum yield (Y2) is 0.54.
2.4.2 Fluorescent selective and sensitive detection for metal ions by CDs. The fluorescent quenching degree of CDs depending on the concentration of Cu2+ was calculated by Stern–Volmer eqn (2):where F0 is the fluorescent intensity of CDs without metal ions, F is CDs combined with Cu2+, C is the concentration of Cu2+, and KSV is the quenching constant.
3. Results and discussion
3.1 Preparation and characterization of CDs
The synthesis of multicolor fluorescent CDs from biomass is still an exciting research field.34,35 The main component of biomass is lignin, which has the perfect robustness that comes from its remarkable and compact morphology structure. This particular structure makes lignin difficult to pyrolysis, limiting its deep development and utilization.36 Hydrothermal approach is one of commonly utilized methods for pyrolysis of lignocellulose under high temperature and high pressure.37 After reaction, macromolecular polymers can become fluorescent CDs.38,39 The CDs prepared by hydrothermal approach has the advantages of small particle size, uniform distribution, light particle agglomeration, and cheaper raw materials. Chemical oxidation is a method to oxidize (such as H2O2 and other strong oxidants) the target by losing electrons with oxidants.40 The advantages of chemical oxidation include manageable control, convenient operation, etc. In this work, GB was selected as raw material, and its main components include cellulose, hemicellulose, and lignin. As shown in Fig. 1, BCDs was synthesized by a simple hydrothermal approach, while GBDs was prepared by chemical oxidation approach.
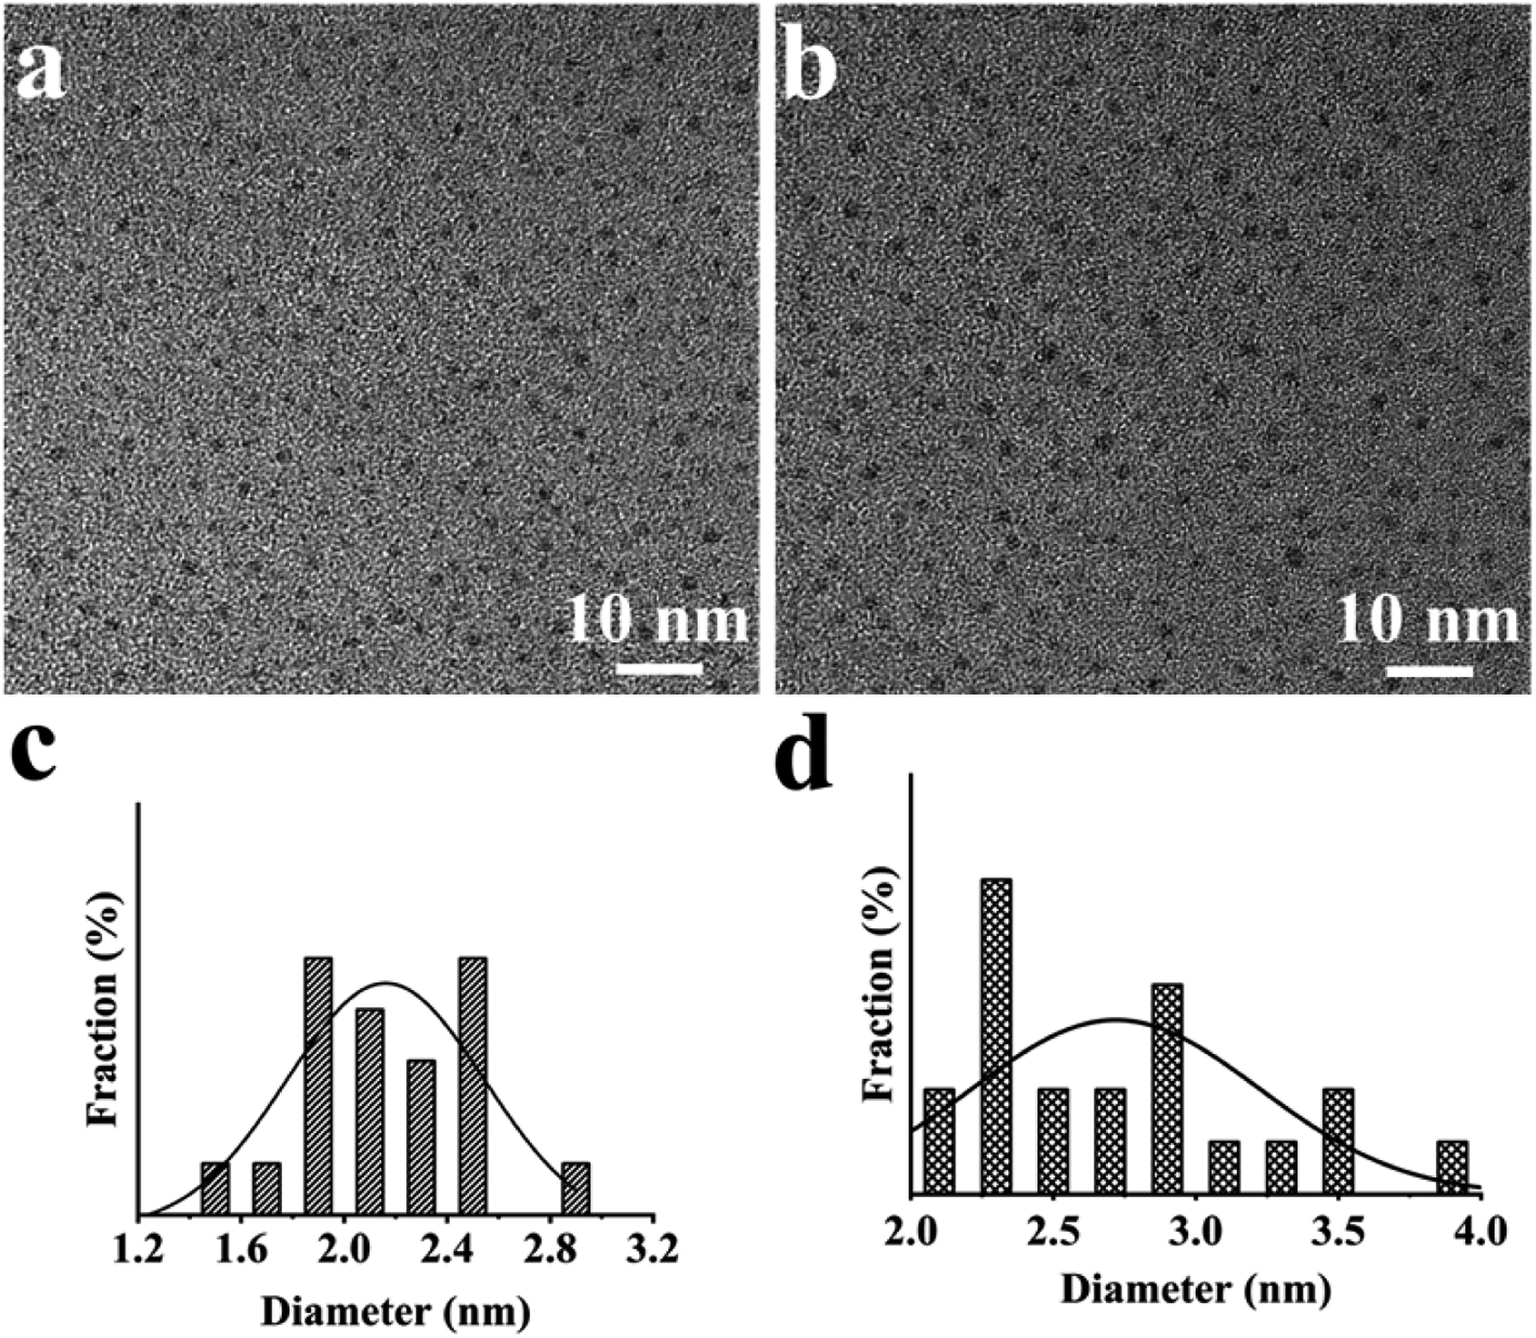
The fluorescent color of CDs is related to particle size, graphitization degree and functional group.41 The microscopic appearance of the two CDs was observed by TME. As shown in Fig. 2a and b, both BCDs and GCDs exhibited well dispersity, and morphology of CDs were spherical. The size distribution ranged in 1.57–2.83 nm (Fig. 2c) and 2.03–3.85 nm (Fig. 2d), respectively, indicating uniform particle size distribution of BCDs and GCDs.42
 |
| | Fig. 2 TEM image of (a) BCDs and (b) GCDs, particle size distribution diagram of (c) BCDs and (d) GCDs. | |
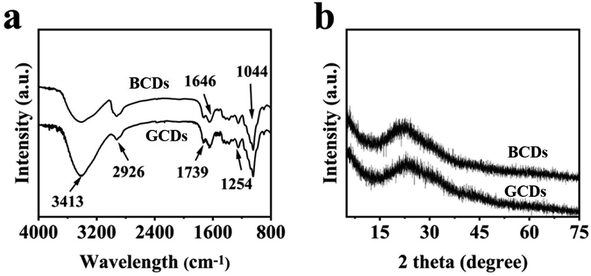
The chemical structures of the BCDs and GCDs were studied by FT-IR spectra and the results are shown in Fig. 3a. A wide peak at 3413 cm−1 was assigned as tensile vibration of –NHx or –OH, while the peak at 1739 cm−1 was assigned as a bending vibration of C![[double bond, length as m-dash]](https://www.rsc.org/images/entities/char_e001.gif) O.43 The absorption peak at 1646 cm−1 was the tensile vibration of aromatic compound CC. The absorption peaks at 1254 and 1044 cm−1 were asymmetric stretching vibration peaks of C–O and C–H. Compared with spectrum of BCDs, the absorption peaks at 3413 cm−1 in spectrum of GCDs was significantly enhanced, which was attributed to a large number of oxygen-containing or amino functional groups formed by chemical oxidation.44 The content of oxygen and nitrogen functional groups were closely related to fluorescent color of CDs.45–47 The prepared CDs exhibited excellent compatibility with water, which was related to existence of these hydrophilic functional groups and provided favorable conditions for luminescence.
O.43 The absorption peak at 1646 cm−1 was the tensile vibration of aromatic compound CC. The absorption peaks at 1254 and 1044 cm−1 were asymmetric stretching vibration peaks of C–O and C–H. Compared with spectrum of BCDs, the absorption peaks at 3413 cm−1 in spectrum of GCDs was significantly enhanced, which was attributed to a large number of oxygen-containing or amino functional groups formed by chemical oxidation.44 The content of oxygen and nitrogen functional groups were closely related to fluorescent color of CDs.45–47 The prepared CDs exhibited excellent compatibility with water, which was related to existence of these hydrophilic functional groups and provided favorable conditions for luminescence.
 |
| | Fig. 3 (a) FT-IR spectra and (b) XRD diffraction of CDs. | |
The phase structure analysis of BCDs and GCDs was carried out by XRD technique, as shown in Fig. 3b. A hump-shaped diffraction peak was located at 22.33°, which was assigned as characteristic peak of crystal planes of carbon material (002), indicating that the diffraction peaks of BCDs and GCDs were still mainly graphite-like structures.48 The stacking between layers in CDs was similar to graphite, which means that highly conjugated sp2 carbon atoms were closely stacked, demonstrating the rich graphene structure of CDs. However, compared with the spectrum of BCDs, the diffraction peaks at 22.33° was non-obvious changed in the spectrum of GCDs, indicating that the graphitization degree were similar.49
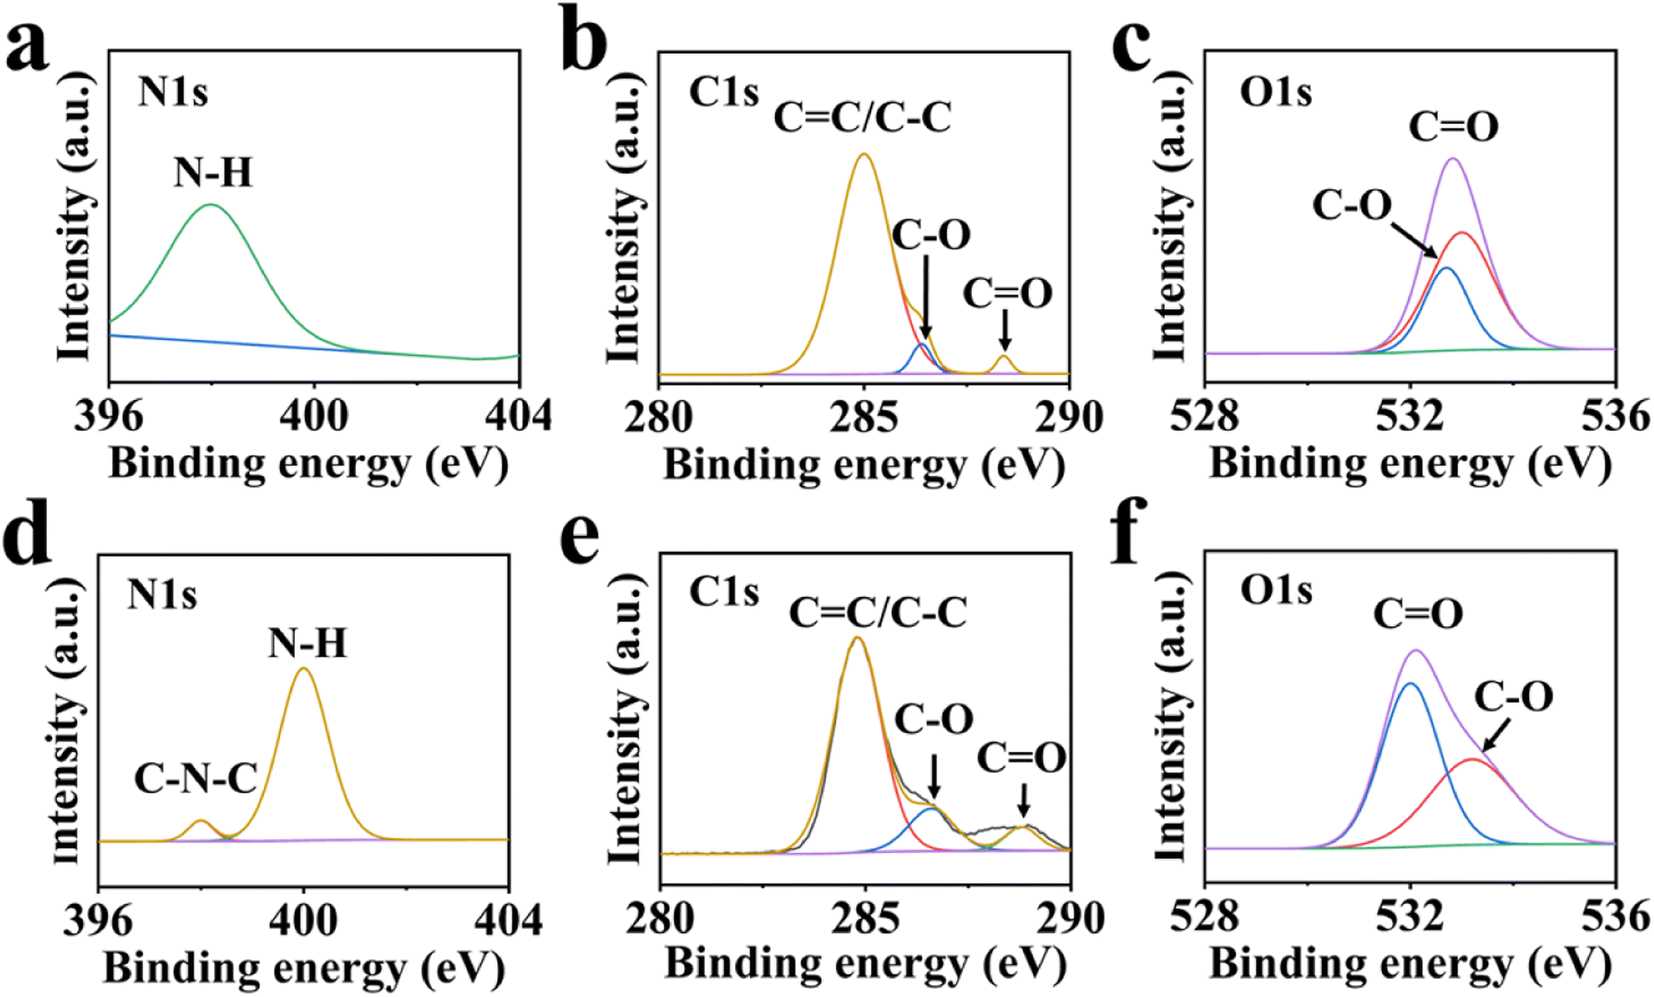
XPS was performed to investigate the surface chemical composition, and the high-resolution full spectra of BCDs and GCDs are shown in Fig. 4. In the N 1s spectrum of BCDs (Fig. 4a), the peak at 398.0 eV belonged to N–H group, while in the N 1s spectrum of GCDs (Fig. 4d), the increase in the nitrogen content of GCDs due to the new chemical bond C–N at 400.2 eV after oxidation of GCDs leads to the color change of GCDs. The peaks at 398.4 and 400.2 eV belonged to C–N and N–H groups.50 In Fig. 4b, the peaks at 284.8, 287.4 and 289.2 eV were assigned as CC/C–C, C–O and CO group in BCDs, respectively. In C1s XPS spectrum of GCDs (Fig. 4e), the peaks at 284.2, 286.6 and 288.8 eV belonged to CC/C–C, C–O and CO group, respectively. The peaks at 532.7 and 533.0 eV belonged to CO and C–O groups, respectively, in O 1s spectrum of BCDs (Fig. 4c). The peaks at 532.1 and 533.5 eV belonged to CO and C–O groups in BCDs (Fig. 4f).51,52 These results indicated that BCDs and GCDs possessed almost same functional groups, the existence of which also proved that CDs was not a complete sp2 structure, but doped with nitrogen and oxygen atoms.
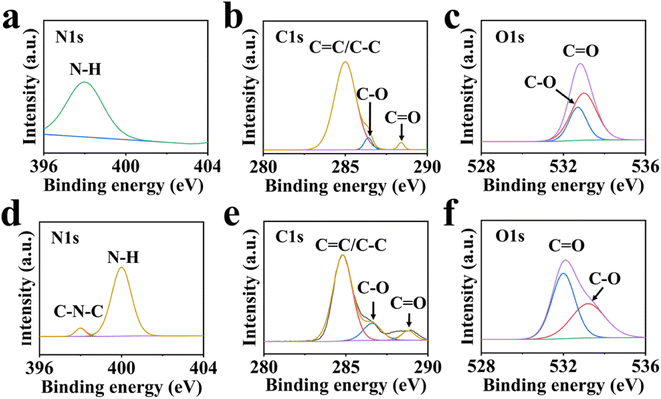 |
| | Fig. 4 High resolution XPS spectra of (a and d) N 1s, (b and e) C 1s, (c and f) O 1s of (a, b and c) BCD and (d, e and f) GCD. | |
3.2 Fluorescent property of CDs
The formation of natural substances is complex, mainly connected by hydrogen bonds and various chemical bonds.53 Deionized water under high pressure and high temperature provides the impetus for the breaking of chemical bonds, thus making GB degradation and destruction under high temperature and pressure to form oligomers and micro-molecules, which contain carboxyl groups and other tubular energy groups in these micro-molecules, making the solution acidic, under continuous high temperature and pressure carbohydrates are further degraded to form more under continuous high temperature and pressure, carbohydrates are further degraded to form more water-soluble small molecules, which are aggregated to form polymers and become macromolecular compounds, and finally these macromolecular compounds form CDs in solution, in which the aqueous solution not only acts as an oxidant and catalyst, but also helps to form CDs.54,55 Then tiny molecular substances were successively converted into BCDs through polymerization and condensation. The GCDs was prepared by adding a certain proportion of NaOH and H2O2 to the GB-residue, thus fluorescent color was changed by a simple chemical oxidation.
In the UV-vis spectrum of BCDs (Fig. S1†), the peaks at 225 and 240 nm belonged to π → π* electronic transition caused by CC, while in the UV-vis spectrum of GCDs, the peaks at 212 and 237 nm also belonged to π → π*electronic transition caused by CO.22,56 Moreover, the fluorescent properties of CDs were also related to particle size, functional groups and graphitization degree. As mentioned above, the size distribution of BCDs ranged in 1.57–2.83 nm, while that of GCDs ranged in 2.03–3.85 nm. It was speculated that different fluorescent color was related to the size of particles, and a red shift of luminescence color of CDs occurred with the increase of particle size.42 The variation of emission wavelengths of BCDs and GCDs is related to the size variation of both CDs and the content of graphitic nitrogen atoms in the carbon core. The graphitic nitrogen content can increase the domain stiffness and thus reduce the nonradiative relaxation through the molecular vibrations on the surface of CDs. Thus, particle size and graphitic nitrogen content synergistically control the emission wavelength of CDs and play an important role in the color variation of CDs.50,57,58
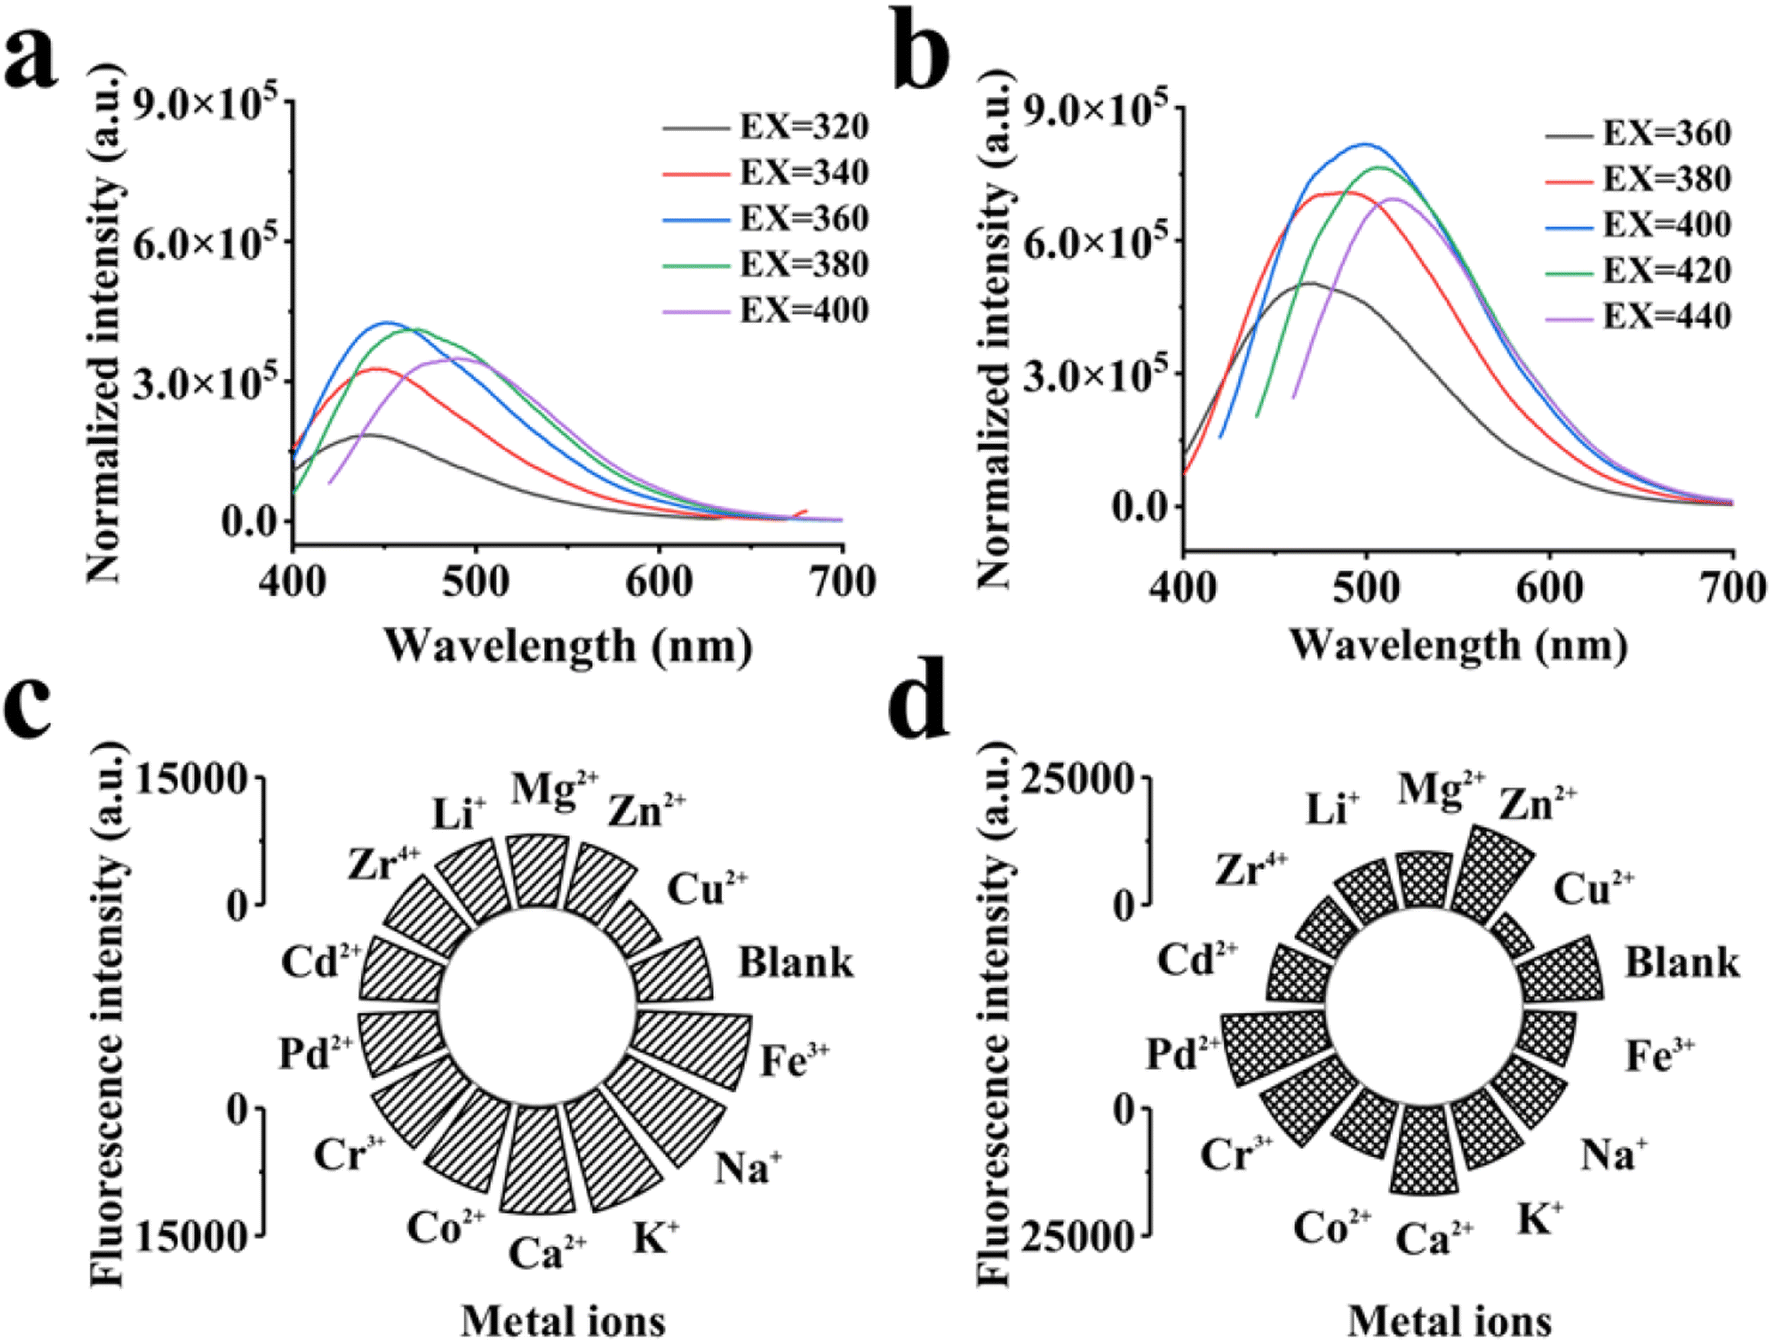
3.2.1 Fluorescent quantum yield of CDs. As presented in Fig. 5a and b, the excitation wavelength of BCDs was 320, 340, 360, 380, 400 nm, its emission wavelength was 440, 445, 450, 465, 490 nm, respectively. The excitation wavelength of GCDs were 360, 380, 400, 420, 440 nm, its emission wavelength were 470, 490, 500, 510, 520 nm, respectively. The fluorescent emission spectra of CDs under different excitation wavelength show that CDs has excitation dependence, which was entirely consistent with the excitation dependence reported by Ganjkhanlou et al.59 Fluorescent quantum yield is an essential parameter for evaluating the fluorescent ability of materials. Therefore, quinine sulfate with a similar excitation wavelength was selected as the standard sample to calculate fluorescent quantum yield of CDs according to eqn (1). The fluorescent quantum yield of BCDs and GCDs were 4.6% and 2.6%, respectively.
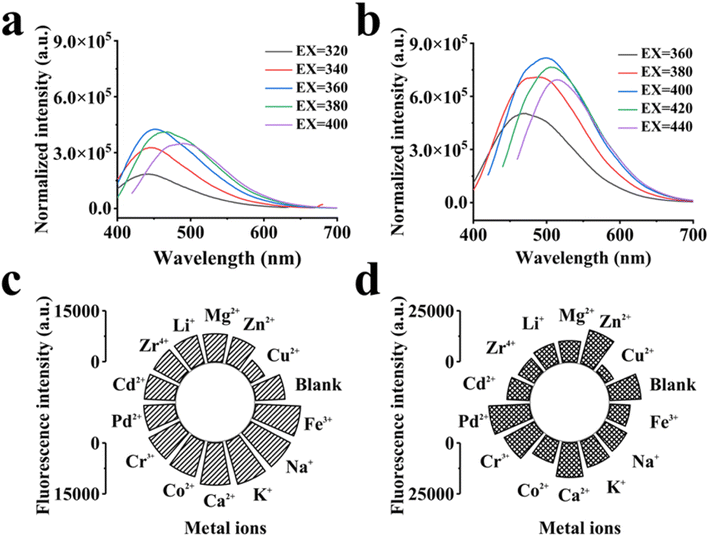 |
| | Fig. 5 Fluorescence emission spectra of (a) BCDs and (b) GCDs, fluorescence intensity of (c) BCDs and (d) GCDs with 13 kinds of metal ions. | |
3.2.2 Fluorescent selective and sensitive detection for metal ions by CDs. The selectivity of BCDs and GCDs for 13 kinds of metal ions was investigated, as shown in Fig. 5c and d. Both BCDs and GCDs generated fluorescence in the blank solution with strong intensity. When BCD was added into aqueous solutions of Fe3+, Na+, K+ and Ca2+, respectively, the fluorescence signals were remarkably enhanced by 53%, 53%,52%, 44%, while adding Co2+, Cr3+, Pd2+ and Cd2+ led to slightly decrease of fluorescent intensity of 24%, 18%, 5.9%, 3.6%. When GCDs was added into aqueous solutions of Ca2+, Cr3+, and Pd2+, respectively, the fluorescence signals were remarkably enhanced by 9.6%, 31%, 11%, while adding Fe3+, Na+, K+, Co2+, Cd2+, Zr4+, Li+, Mg2+ and Zn2+ led to slightly decrease of fluorescent intensity of 32%, 34%, 43%, 28%, 28%, 13%, 22%, 36%.The CDs with π → π*electronic transition were easier to enhance fluorescence, and fluorescence intensity will generally increase as conjugation degree of the system increases. This was mainly because increasing the molar absorption coefficient of fluorescent substances was conducive to generating more excited molecules, which was conducive to the occurrence of fluorescence. Weakening fluorescence response was because CDs and metal ions encounter and collide with less energy loss, or CDs and metal ions react to form a non-luminous coordination compound. The strong response of BCDs (47%) and GCDs (71%) to Cu2+ was mainly attributed to oxygen-containing group and nitrogen-containing groups on the surface CDs.59 The electrons were attributed to Cu2+ as an electron donor. The lone pair electrons of the nitrogen atom shown a good affinity for Cu2+, which could be attributed to the behavior of the characteristic pair of nitrogen atom and Cu2+.60 The quenching constant is an important means to measure fluorescent sensitivity. The quenching constant was an important means of determining fluorescent sensitivity, which were calculated according to Stern–Volmer equation (eqn (2)). The quenching constant of BCDs and GCDs were 0.7 × 10⁷ and 2.3 × 10⁷, respectively, demonstrating perfect fluorescent response of CDs to Cu2+.
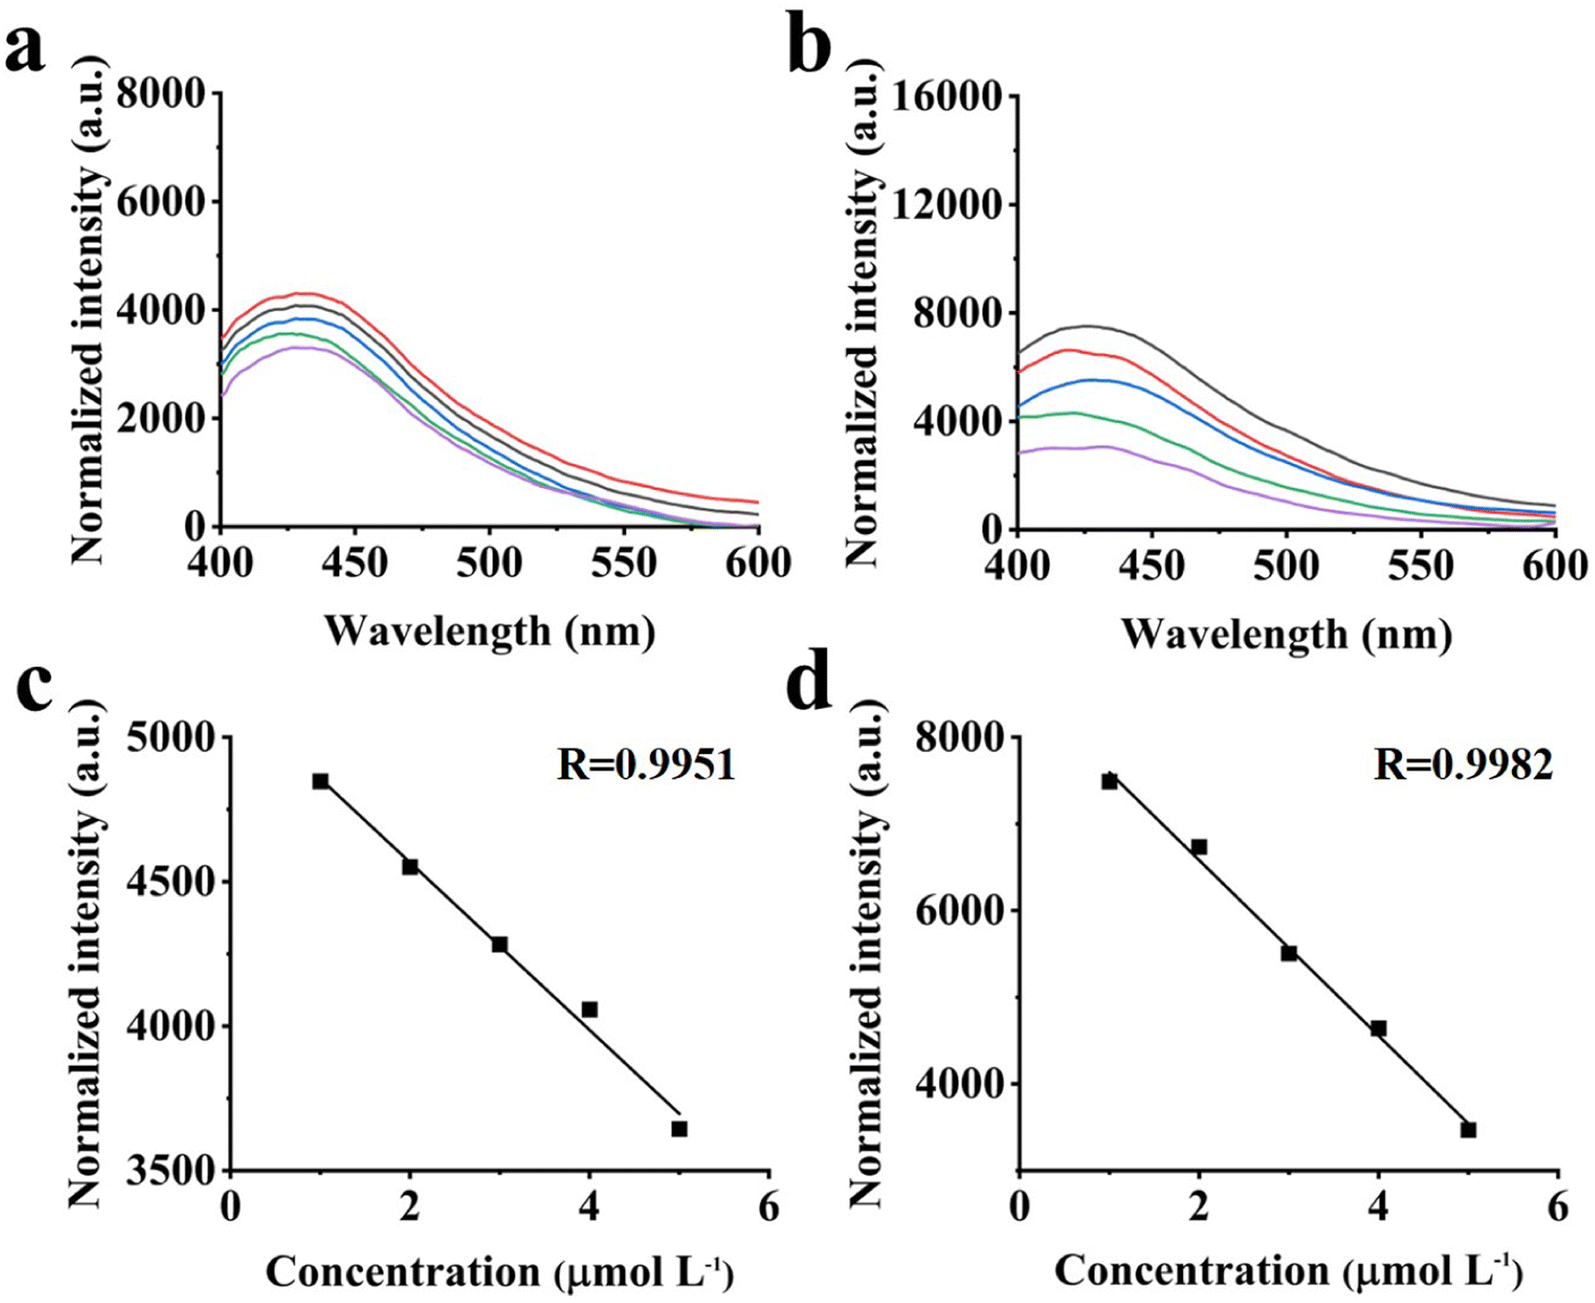
3.2.3 Quantitative measurement and quenching mechanism of CDs. The fluorescent response of BCDs and GCDs to different concentrations of Cu2+ were tested, as shown in Fig. 6a and b. The fluorescent intensity of BCDs and GCDs decreased with an increase of Cu2+ concentration. The linear relationship between fluorescent intensity of BCDs with Cu2+ concentration and that of GCDs are shown in Fig. 6c and d, and the linear correlation coefficients R were 0.9951 and 0.9982, respectively. The limit of detection (LOD) of BCDs and GCDs were 0.74 × 10⁻³ and 1.08 × 10⁻³ μmol L−1, when the concentration of Cu2+ ranged in 1–5 μmoL L−1, which provided a new idea for the preparation of carbon-based dual-functional materials. Table 1 lists several CDs materials with fluorescent properties for selective detection of Cu2+. Yan et al.61 prepared CDs by grafting 7-diethylaminocoumarin-3-carbohydrazide onto the surface of glyoxylic acid-modified. The CDs through amidation reaction, within the range of 0–10 μmol L−1, LOD was 0.21 μmol L−1. Ma et al.62 prepared CDs as a potential probe for metal ion sensing by a simple stirring treatment of AC with sulfuric acid, ranging from 0 to 500 μmol L−1, the LOD was 2.40 μmol L−1. Zeng et al.63 utilized 2,4-difluorobenzoic acid and L-lysine as precursors to synthesize nitrogen fluoride co-doped CDs by hydrothermal method. Within the concentration range of 0–200 μmol L−1, LOD was 0.22 μmol L−1. When concentration of Cu2+ within the range of 1–10 μmol L−1, LOD of BCDs and GCDs were lower than other materials. The fluorescent detection method based on BCDs and GCDs has good sensitivity and could be utilized for quantitative analysis and selective detection of Cu2+.
 |
| | Fig. 6 Fluorescence emission spectra of (a) BCDs and (b) GCDs with different concentrations of Cu2+, linear response curve of (c) BCDs and (d) GCDs for detection of Cu2+. | |
Table 1 Comparison of the reported materials for fluorescent detection of Cu2+
| Material |
Linear range (μmol L−1) |
LOD (μmol L−1) |
Ref. |
| Coumarin-functionalized CDs |
0–10 |
0.21 |
61 |
| Prepared from activated carbon CDs |
0–500 |
2.40 |
62 |
| Prepared from 2,4-difluorobenzoic acid CDs |
0–200 |
0.22 |
55 |
| Tea-CDs |
0–170 |
0.051 |
65 |
| Banana-CDs |
0–12.5 |
0.004 |
66 |
| Lignin-CDs |
0–30 |
0.085 |
67 |
| BCDs |
1–5 |
0.74 × 10⁻³ |
This work |
| GCDs |
1–5 |
1.08 × 10⁻³ |
This work |
Fluorescence quenching effect is related to the yoke structure of Cu2+. CDs are formed by the polymerization of a series of aromatic compounds. When Cu2+ aqueous solution was added, an electron transfer occurred and the light generated by the CDs was absorbed by Cu2+. To further verify this deduction, the fluorescence lifetime was detected (Fig. S2†). The fluorescence lifetime of the material with the addition of Cu2+ was increased. The experimental results show that, the fluorescence quenching of BCDs and GCDs is caused by dynamic quenching. The oxygen-containing groups (OH, CO, COOH) present on the surface of CDs can interact with metal ions (especially Cu2+), resulting in CDs behaving as chelators. Usually, bursts are observed due to electron or energy transfer between the excited CDs and the metal ions. In this case, the burst phenomenon is due to electron transfer rather than through energy transfer. In addition, the decay of the fluorescence lifetime of CDs in the absence and presence of Cu2+ was calculated. The fluorescence lifetimes of BCDs and GCDs were 1.26 and 1.21 ns, while the lifetimes after the addition of Cu2+ were 9.15 and 4.57 ns. The fluorescence lifetime of CDs increased after the addition of Cu2+. This result suggests that the electron transfer from the excited CDs to the metal ion vacancy orbitals leads to a strong nonradiative electron/hole complex, confirming the aggregation-induced emission burst in the CDs.64,68,69
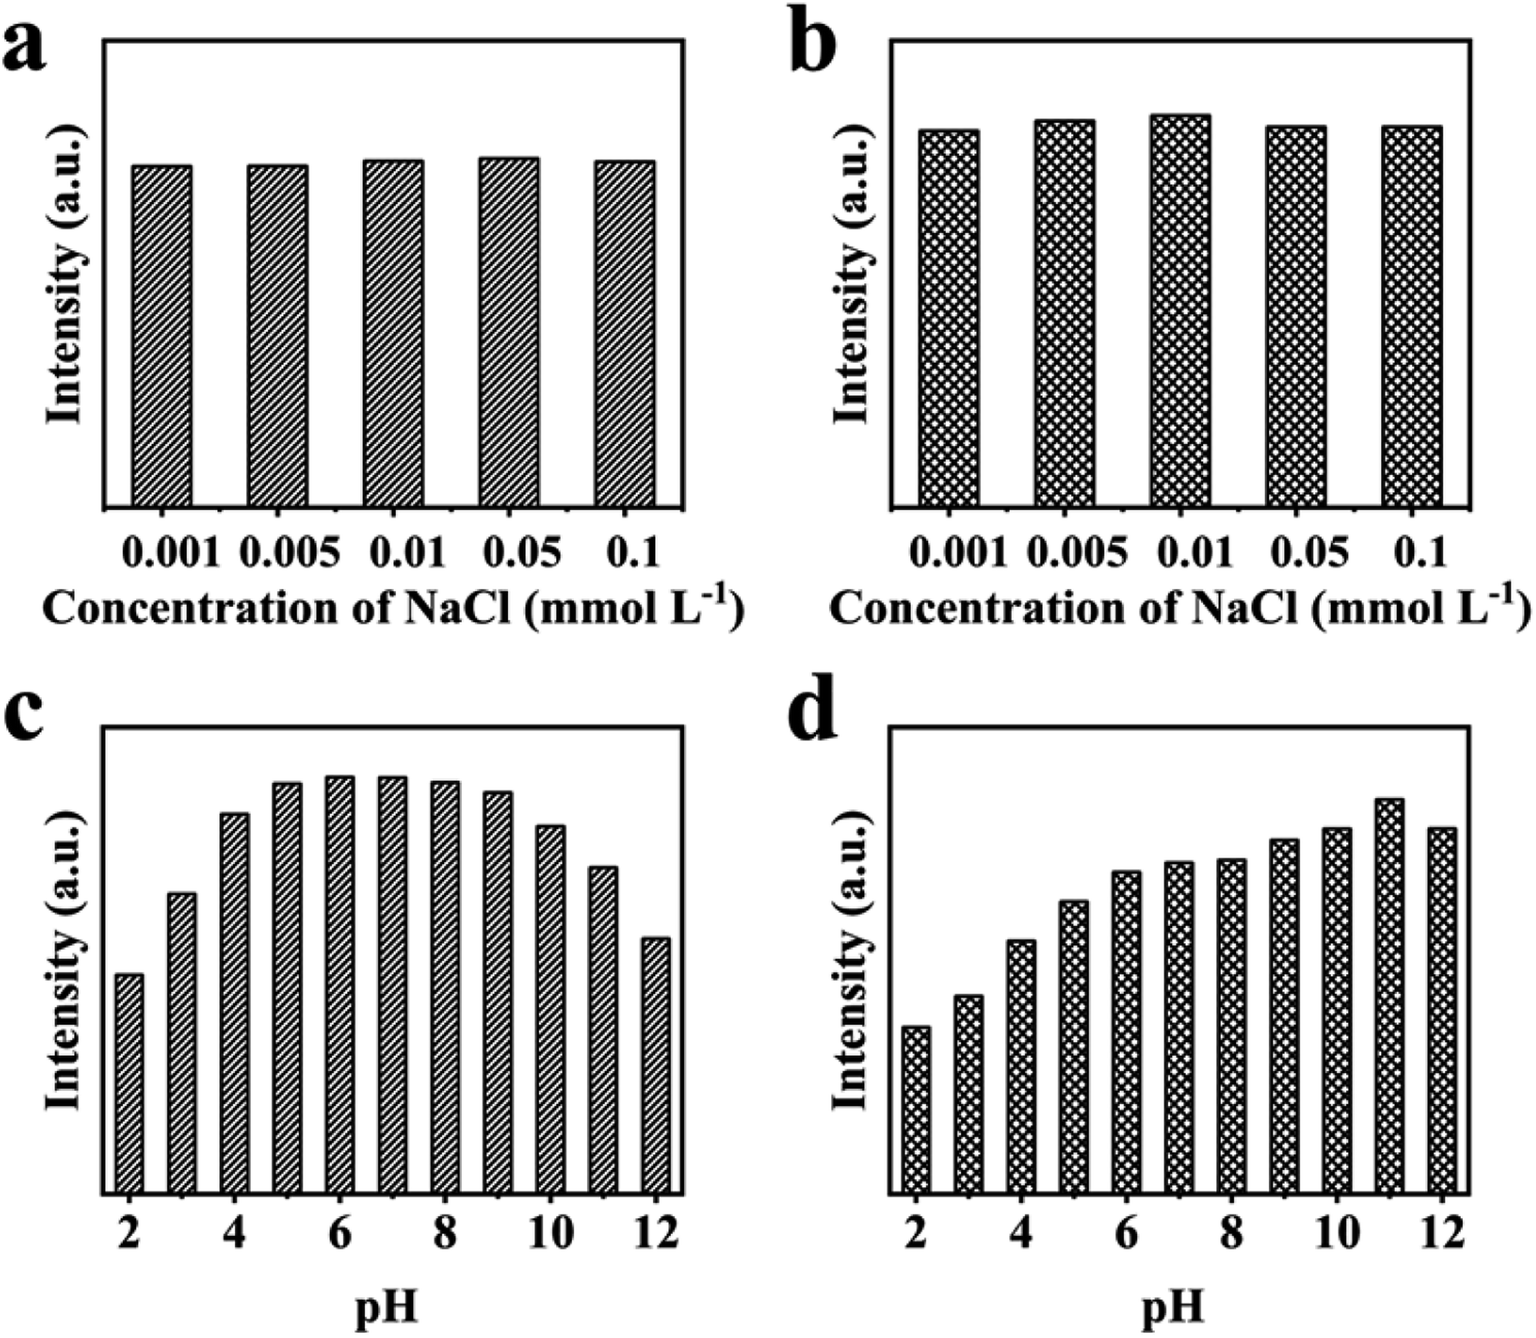
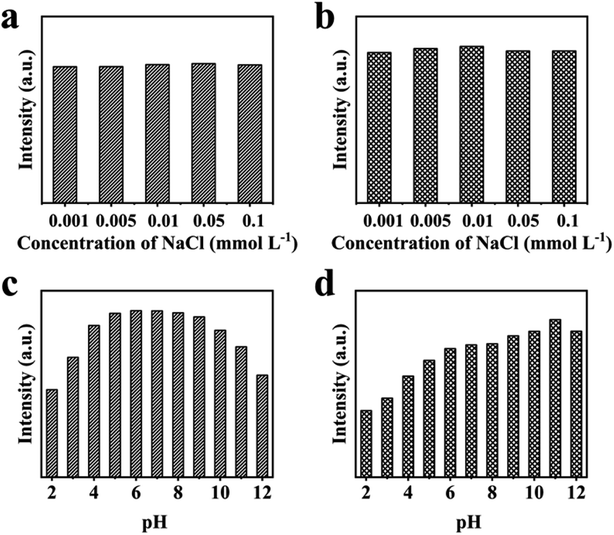
3.2.4 Effect of salt solution on fluorescent response of CDs. The salt resistance of BCDs and GCDs were tested. The NaCl of different concentrations was utilized as the interferent to detect fluorescent intensity of BCDs and GCDs. As shown in Fig. 7a and b, the concentration of NaCl increased from 0.001 to 0.1 mol L−1 in turn. In the range of 0.001–0.1 mmol L−1 of NaCl, the fluorescent intensity of BCDs and GCDs maintains a stable state. In conclusion, BCDs and GCDs show excellent stability, which makes BCDs and GCDs have good application prospects in detection.70
 |
| | Fig. 7 Effects of (a and b) concentration of NaCl and (c and d) pH of solution on fluorescence response of (a and c) BCDs and (b and d) GCDs. | |
3.2.5 Effect of pH on fluorescent response of CDs. In order to further explored stability of CDs in an aqueous solution, the effects of different pH conditions on fluorescent intensity were investigated. As shown in Fig. 7c and d, when the pH value of the solution changes from 2 to 12, fluorescent signal of BCDs was strongest under neutral conditions. The fluorescent response of BCDs was significantly weakened at pH 2–4 and 10–12, which was attributed to the protonation of hydroxyl groups under acidic conditions or the precipitation of hydroxyl groups with other substances under alkaline conditions.71 The fluorescent signal of GCDs significantly weakened with the increase of acidic solution, which was also due to protonation of hydroxyl groups. The fluorescent intensity hardly fluctuates wildly at a pH of 5–9. Under acidic conditions, the fluorescent intensity of GCDs gradually decreased with the increase of acidic concentration. However, the fluorescent intensity of GCDs was slightly enhanced under alkaline conditions, which might be due to the different preparation methods from BCDs.70 The GCDs was prepared by chemical oxidation under alkaline conditions, and GCDs suspension was also alkaline. The fluorescent intensity of BCDs for fluorescent detection of Cu2+ in a neutral solution was enhanced. The stability of BCDs was excellent in the pH range of 5–9, and the fluorescent intensity of GCDs was not affected by pH in the range of 7–12.
4. Conclusion
Two kinds of CDs were obtained from GB by hydrothermal and chemical oxidation. This method of using biomass two-step method to form two color CDs has not been reported before. It is found that the luminescent properties of CDs were related to surface functional groups or graphitization, and shown good luminescence stability. Surface state modification opens up a new research direction for polychromatic luminescence. The blue fluorescence was successfully converted to green fluorescence by adjusting the hydrogen bond on the CDs surface. The CDs of two colors was sensitive to Cu2+, and LOD were 0.74 and 1.08 μmol L−1, respectively, within the concentration range of 1–10 μmol L−1, and correlation coefficient was as high as 0.9951 and 0.9982. In addition, these CDs were still stable in different 0.001–0.1 mmol L−1 salt solutions, BCDs was more stable in the neutral pH range, and GCDs was more stable in neutral to alkaline conditions. This work proposes a feasible method for the high value utilization of waste crops and a new raw material for the preparation of detection materials. In our future research work, we will focus on finding greener preparation methods and more sensitive detection materials.
Conflicts of interest
The authors declare that they have no known competing financial interests or personal relationships that could have appeared to influence the work reported in this paper.
Acknowledgements
Financial support is gratefully acknowledged from the National Natural Sciences Foundation of Ningxia (No. 2021AAC02017), the National Natural Sciences Foundation of China (No. 21974137) and the CAS-Weigao Research & Development Program ([2017]-009) to J. Ou, as well as the Introduction Flexible Team of Ningxia (No. 2019RXTD0004) and the Key materials and Key technology innovation team for industrial biological processes (KJT2019004) to B. Gong.
References
- M. T. Xiang, Y. Li, J. Y. Yang, K. G. Lei, Y. Li, F. Li, D. F. Zheng, X. Q. Fang and Y. Cao, Heavy metal contamination risk assessment and correlation analysis of heavy metal contents in soil and crops, Environ. Pollut., 2021, 278, 116911 CrossRef CAS PubMed.
- Q. H. Wu, H. C. Zhou, N. F. Y. Tam, Y. Tian, Y. Tan, S. Zhou, Q. Li, Y. H. Chen and J. Y. S. Leung, Contamination, toxicity and speciation of heavy metals in an industrialized urban river: Implications for the dispersal of heavy metals, Mar. Pollut. Bull., 2016, 104, 153–161 CrossRef CAS PubMed.
- S. Sawan, R. Maalouf, A. Errachid and N. Jaffrezic-Renault, Metal and metal oxide nanoparticles in the voltammetric detection of heavy metals: A review, TrAC, Trends Anal. Chem., 2020, 131, 116014 CrossRef CAS.
- X. Q. Cui, J. W. Zhang, X. T. Wang, M. H. Pan, Q. Lin, K. Y. Khan, B. B. Yan, T. Q. Li, Z. L. He, X. Yang and G. Y. Chen, A review on the thermal treatment of heavy metal hyperaccumulator: Fates of heavy metals and generation of products, J. Hazard. Mater., 2021, 405, 123832 CrossRef CAS PubMed.
- C. Guo, L. Lv, Y. Liu, M. Ji, E. Zang, Q. Liu, M. Zhang and M. Li, Applied Analytical Methods for Detecting Heavy Metals in Medicinal Plants, Crit. Rev. Anal. Chem., 2021, 30, 1–21 Search PubMed.
- K. B. S. Perelonia, K. C. D. Benitez, R. J. S. Banicod, G. C. Tadifa, F. D. Cambia and U. M. Montojo, Validation of an analytical method for the determination of cadmium, lead and mercury in fish and fishery resources by graphite furnace and Cold Vapor Atomic Absorption Spectrometry, Food Control, 2021, 130, 108363 CrossRef CAS.
- K. J. Li, H. Y. Yang, X. Yuan and M. Zhang, Recent developments of heavy metals detection in traditional Chinese medicine by atomic spectrometry, Microchem. J., 2021, 160, 105726 CrossRef CAS.
- R. Mohamed, B. H. Zainudin and A. S. Yaakob, Method validation and determination of heavy metals in cocoa beans and cocoa products by microwave assisted digestion technique with inductively coupled plasma mass spectrometry, Food Chem., 2020, 303, 125392 CrossRef CAS PubMed.
- B. Xiong, T. Xu, R. P. Li, D. Johnson, D. Ren, H. G. Liu, Y. Xi and Y. P. Huang, Heavy metal accumulation and health risk assessment of crayfish collected from cultivated and uncultivated ponds in the Middle Reach of Yangtze River, Sci. Total Environ., 2020, 739, 139963 CrossRef CAS PubMed.
- M. E. Shaheen, W. Tawfik, A. F. Mankoula, J. E. Gagnon, B. J. Fryer and F. El-Mekawy, Determination of heavy metal content and pollution indices in the agricultural soils using laser ablation inductively coupled plasma mass spectrometry, Environ. Sci. Pollut. Res., 2021, 28, 36039–36052 CrossRef CAS PubMed.
- Z. R. Zou, Y. J. Deng, J. Hu, X. M. Jiang and X. D. Hou, Recent trends in atomic fluorescence spectrometry towards miniaturized instrumentation-A review, Anal. Chim. Acta, 2018, 1019, 25–37 CrossRef CAS PubMed.
- J. O. P. Nayagam and K. Prasanna, Utilization of shell-based agricultural waste adsorbents for removing dyes: A review, Chemosphere, 2022, 291, 132737 CrossRef PubMed.
- Q. Zhang, A. P. Shi, M. Ajmal, L. H. Ye and M. Awais, Comprehensive review on agricultural waste utilization and high-temperature fermentation and composting, Biomass Convers. Biorefin., 2021, 16(28), 2829 Search PubMed.
- A. A. Al-Gheethi, Q. M. Azhar, P. S. Kumar, A. A. Yusuf, A. K. Al-Buriahi, R. Mohamed and M. M. Al-shaibani, Sustainable approaches for removing Rhodamine B dye using agricultural waste adsorbents: A review, Chemosphere, 2022, 287 Search PubMed.
- M. Moon, Y. J. Yeon, H. J. Park, J. Park, G. W. Park, G. H. Kim, J. P. Lee, D. Lee, J. S. Lee and K. Min, Chemoenzymatic valorization of agricultural wastes into 4-hydroxyvaleric acid via levulinic acid, Bioresour. Technol., 2021, 337, 125479 CrossRef CAS PubMed.
- X. J. Wu, F. Li and W. Wu, Effects of rice bran rancidity on the oxidation and structural characteristics of rice bran protein, LWT-Food Sci. Technol., 2020, 120, 108943 CrossRef CAS.
- J. L. Zhang, L. Zhang, Z. Z. Wu, P. Zhang, R. J. Liu, M. Chang and X. G. Wang, The dopaminergic neuroprotective effects of different phytosterols identified in rice bran and rice bran oil, Food Funct., 2021, 12, 10538–10549 RSC.
- W. Wu, F. Li and X. J. Wu, Effects of rice bran rancidity on oxidation, structural characteristics and interfacial properties of rice bran globulin, Food Hydrocolloids, 2021, 110, 106123 CrossRef CAS.
- S. Y. Lin, X. X. Jin, J. Gao, Z. Y. Qiu, J. Ying, Y. Wang, Z. Z. Dong and W. B. A. Zhou, Impact of wheat bran micronization on dough properties and bread quality: Part I-Bran functionality and dough properties, Food Chem., 2021, 353, 129407 CrossRef CAS PubMed.
- H. J. Lee, S. R. Kim, J. Y. Park and E. Y. Park, Phytate-mediated phosphorylation of starch by dry heating with rice bran extract, Carbohydr. Polym., 2022, 282, 119104 CrossRef CAS PubMed.
- B. X. Zhang, T. H. Fu, C. Y. Guan, S. H. Cui, B. B. Fan, Y. Tan, W. H. Luo, Q. Q. Wei, G. X. Li and Y. T. Peng, Environmental Life Cycle Assessments of Chicken Manure Compost Using Tobacco Residue, Mushroom Bran, and Biochar as Additives, Sustainability, 2022, 14, 4976 CrossRef CAS.
- H. Ali, S. Ghosh and N. R. Jana, Fluorescent carbon dots as intracellular imaging probes, Wiley Interdiscip. Rev.: Nanomed. Nanobiotechnol., 2020, 12, 543525 Search PubMed.
- R. T. Guo, L. Li, B. W. Wang, Y. G. Xiang, G. Q. Zou, Y. R. Zhu, H. S. Hou and X. B. Ji, Functionalized carbon dots for advanced batteries, Energy Storage Mater., 2021, 37, 8–39 CrossRef.
- S. Bhattacharya, R. S. Phatake, S. N. Barnea, N. Zerby, J. J. Zhu, R. Shikler, N. G. Lemcoff and R. Jelinek, Fluorescent Self-Healing Carbon Dot/Polymer Gels, Acs Nano, 2019, 13, 1433–1442 CrossRef CAS PubMed.
- S. S. Wu, W. Li, Y. O. Sun, X. J. Zhang, J. L. Zhuang, H. Hu, B. F. Lei, C. F. Hu and Y. L. Liu, Synthesis of dual-emissive carbon dots with a unique solvatochromism phenomenon, J. Colloid Interface Sci., 2019, 555, 607–614 CrossRef CAS PubMed.
- H. Wang, G. R. Qu, J. Q. Yang, S. W. Zhou, B. Li and Y. G. Wei, An effective and cleaner discharge method of spent lithium batteries, J. Energy Storage, 2022, 54, 105383 CrossRef.
- P. Nasiri, D. Doranian and A. H. Sari, Synthesis of Au/Si nanocomposite using laser ablation method, Opt. Laser Technol., 2019, 113, 217–224 CrossRef CAS.
- B. J. Liu, Q. Liu, X. J. Wang, Q. C. Bei, Y. H. Zhang, Z. B. Lin, G. Liu, J. G. Zhu, T. L. Hu, H. Y. Jin, H. Wang, X. L. Sun, X. W. Lin and Z. B. Xie, A fast chemical oxidation method for predicting the long-term mineralization of biochar in soils, Sci. Total Environ., 2020, 718, 217424 Search PubMed.
- M. A. Alkhadra, X. Su, M. E. Suss, H. Tian, E. N. Guyes, A. N. Shocron, K. M. Conforti, J. P. de Souza, N. Kim, M. Tedesco, K. Khoiruddin, I. G. Wenten, J. G. Santiago, T. A. Hatton and M. Z. Bazant, Electrochemical Methods for Water Purification, Ion Separations, and Energy Conversion, Chem. Rev., 2022, 122, 13547–13635 CrossRef CAS PubMed.
- H. S. Niu, H. Y. Zhang, W. J. Yue, S. Gao, H. Kan, C. W. Zhang, C. C. Zhang, J. B. Pang, Z. Lou, L. L. Wang, Y. Li, H. Liu and G. Z. Shen, Micro-Nano Processing of Active Layers in Flexible Tactile Sensors via Template Methods: A Review, Small, 2021, 17, 345353 Search PubMed.
- F. Chen and Y. J. Zhu, Microwave-Assisted Synthesis of Calcium Phosphate Nanostructured Materials in Liquid Phase, Prog. Chem., 2015, 27, 459–471 CAS.
- H. Y. Li, Y. Xu, L. Zhao, J. Ding, M. Y. Chen, G. R. Chen, Y. Li and L. Ding, Synthesis of tiny carbon dots with high quantum yield using multi-walled carbon nanotubes as support for selective “turn-off-on” detection of rutin and Al3+, Carbon, 2019, 143, 391–401 CrossRef CAS.
- Z. X. Du, Q. S. Liu, Y. L. Chen and H. B. Wang, Properties of Sr2.13Ba0.8SiO5:0.07Eu(2+) phosphor synthesized by microwave assisted with SiC method, J. Alloys Compd., 2017, 694, 340–344 CrossRef CAS.
- D. Sgherza, S. Pentassuglia, V. G. Altieri, G. Mascolo, M. De Sanctis and C. Di Iaconi, Integrating biodegradation and ozone-catalysed oxidation for treatment and reuse of biomass gasification wastewater, J. Water Process. Eng., 2021, 43, 102297 CrossRef.
- Q. Q. Lu, L. L. Jia, M. K. Awasthi, G. H. Jing, Y. B. Wang, L. Y. He, N. Zhao, Z. K. Chen, Z. Zhang and X. W. Shi, Variations in lignin monomer contents and stable hydrogen isotope ratios in methoxy groups during the biodegradation of garden biomass, Sci. Rep., 2022, 12, 8734 CrossRef CAS PubMed.
- S. Fatma, A. Saleem and R. Tabassum, Wheat straw hydrolysis by using co-cultures of Trichoderma reesei and Monascus purpureus toward enhanced biodegradation of the lignocellulosic biomass in bioethanol biorefinery, Biomass Convers. Biorefin., 2021, 11, 743–754 CrossRef CAS.
- C. L. Xia, S. J. Zhu, T. L. Feng, M. X. Yang and B. Yang, Evolution and Synthesis of Carbon Dots: From Carbon Dots to Carbonized Polymer Dots, Adv. Sci., 2019, 6, 878546 Search PubMed.
- Y. F. Tao, J. Lin, D. Y. Wang and Y. H. Wang, Na+-functionalized carbon dots with aggregation-induced and enhanced cyan emission, J. Colloid Interface Sci., 2021, 588, 469–475 CrossRef CAS PubMed.
- X. L. Wang, Z. L. Cheng, Y. Zhou, S. K. Tammina and Y. L. Yang, A double carbon dot system composed of N, Cl-doped carbon dots and N, Cu-doped carbon dots as peroxidase mimics and as fluorescent probes for the determination of hydroquinone by fluorescence, Microchim. Acta, 2020, 187, 2557 Search PubMed.
- D. B. Gunjal, Y. M. Gurav, A. H. Gore, V. M. Naik, R. D. Waghmare, C. S. Patil, D. Sohn, P. V. Anbhule, R. V. Shejwal and G. B. Kolekar, Nitrogen doped waste tea residue derived carbon dots for selective quantification of tetracycline in urine and pharmaceutical samples and yeast cell imaging application, Opt. Mater., 2019, 98, 109484 CrossRef CAS.
- D. Li, S. Wang, F. Azad, L. Zhao and S. Su, A simple method for the preparation of multi-color carbon quantum dots by using reversible regulatory color transformation, Mikrochim. Acta, 2019, 186, 612 CrossRef PubMed.
- R. Yu, S. Liang, Y. Ru, L. Li, Z. Wang, J. Chen and L. Chen, A Facile Preparation of Multicolor Carbon Dots, Nanoscale Res. Lett., 2022, 17, 32 CrossRef CAS PubMed.
- P. Das, S. Ganguly, A. Saravanan, S. Margel, A. Gedanken, S. Srinivasan and A. R. Rajabzadeh, Naturally Derived Carbon Dots In Situ Confined Self-Healing and Breathable Hydrogel Monolith for Anomalous Diffusion-Driven Phytomedicine Release, ACS Appl. Bio Mater., 2022, 5, 5617–5633 CrossRef CAS PubMed.
- S. Chattopadhyay, M. Choudhary and H. Singh, Carbon dots and graphene oxide based FRET immunosensor for sensitive detection of Helicobacter pylori, Anal. Biochem., 2022, 654, 114801 CrossRef CAS PubMed.
- P. Feng, J. Li, H. Wang and Z. Q. Xu, Biomass-Based Activated Carbon and Activators: Preparation of Activated Carbon from Corncob by Chemical Activation with Biomass Pyrolysis Liquids, ACS Omega, 2020, 5, 24064–24072 CrossRef CAS PubMed.
- W. W. Wang, S. P. Xu, K. C. Wang, J. Liang and W. Zhang, De-intercalation of the intercalated potassium in the preparation of activated carbons by KOH activation, Fuel Process. Technol., 2019, 189, 74–79 CrossRef CAS.
- S. J. Li, K. H. Han, J. X. Li, M. Li and C. M. Lu, Preparation and characterization of super activated carbon produced from gulfweed by KOH activation, Microporous Mesoporous Mater., 2017, 243, 291–300 CrossRef CAS.
- A. Ahmad, H. M. Al-Swaidan, A. H. Alghamdi, K. M. Alotaibi, A. M. Alswieleh, A. N. Albalwi and E. Bajuayfir, Efficient sequester of hexavalent chromium by chemically active carbon from waste valorization (Phoenix Dactylifera), J. Anal. Appl. Pyrolysis, 2021, 155, 105075 CrossRef CAS.
- M. P. Li, Y. N. Wang, Y. X. Liu, H. Wang and H. Song, Preparation of active carbon through one-step NaOH activation of coconut shell biomass for phenolic wastewater treatment, Res. Chem. Intermed., 2022, 48, 1665–1684 CrossRef CAS.
- H. Ding, J. S. Wei, P. Zhang, Z. Y. Zhou, Q. Y. Gao and H. M. Xiong, Solvent-Controlled Synthesis of Highly Luminescent Carbon Dots with a Wide Color Gamut and Narrowed Emission Peak Widths, Small, 2018, 14, e1800612 CrossRef PubMed.
- Q. L. Liang, Y. C. Liu, M. Y. Chen, L. L. Ma, B. Yang, L. L. Li and Q. Liu, Optimized preparation of activated carbon from coconut shell and civil for municipal sludge, Mater. Chem. Phys., 2020, 241, 122327 CrossRef CAS.
- Y. L. Yang and F. S. Cannon, Preparation of activated carbon from pine sawdust with hydrothermal-pressure preconditioning, J. Environ. Chem. Eng., 2021, 9, 106391 CrossRef CAS.
- M. Sevilla and A. B. Fuertes, The production of carbon materials by hydrothermal carbonization of cellulose, Carbon, 2009, 47, 2281–2289 CrossRef CAS.
- M. Si, J. Zhang, Y. He, Z. Yang, X. Yan, M. Liu, S. Zhuo, S. Wang, X. Min, C. Gao, L. Chai and Y. Shi, Synchronous and rapid preparation of lignin nanoparticles and carbon quantum dots from natural lignocellulose, Green Chem., 2018, 20, 3414–3419 RSC.
- Z. Y. Li, Q. H. Wang, Z. X. Zhou, S. N. Zhao, S. L. Zhong, L. F. Xu, Y. Gao and X. J. Cui, Green synthesis of carbon quantum dots from corn stalk shell by hydrothermal approach in near-critical water and applications in detecting and bioimaging, Microchem. J., 2021, 166, 106250 CrossRef CAS.
- P. Das, S. Ganguly, S. R. Ahmed, M. Sherazee, S. Margel, A. Gedanken, S. Srinivasan and A. R. Rajabzadeh, Carbon Dot Biopolymer-Based Flexible Functional Films for Antioxidant and Food Monitoring Applications, ACS Appl. Polym. Mater., 2022, 4, 9323–9340 CrossRef CAS.
- B. Yao, H. Huang, Y. Liu and Z. Kang, Carbon Dots: A Small Conundrum, Trends Chem., 2019, 1, 235–246 CrossRef CAS.
- C. Xia, S. Zhu, T. Feng, M. Yang and B. Yang, Evolution and Synthesis of Carbon Dots: From Carbon Dots to Carbonized Polymer Dots, Adv.
Sci., 2019, 6, 1901316 CrossRef CAS PubMed.
- Y. Ganjkhanlou, J. J. E. Maris, J. Koek, R. Riemersma, B. M. Weckhuysen and F. Meirer, Dual Fluorescence in Glutathione-Derived Carbon Dots Revisited, J. Phys. Chem. C, 2022, 126, 2720–2727 CrossRef CAS PubMed.
- W. J. Zhou, Z. Hu, J. X. Wei, H. X. Lu, H. Q. Dai, J. C. Zhao, W. L. Zhang and R. Q. Guo, A ratiometric fluorescent probe based on PCN-224 for rapid and ultrasensitive detection of copper ions, Compos. Commun., 2022, 33, 101221 CrossRef.
- F. Y. Yan, Z. J. Bai, Y. Chen, F. L. Zu, X. Li, J. X. Xu and L. Chen, Ratiometric fluorescent detection of copper ions using coumarin-functionalized carbon dots based on FRET, Sens. Actuators, B, 2018, 275, 86–94 CrossRef CAS.
- X. Ma, S. J. Lin, Y. F. Dang, Y. Dai, X. J. Zhang and F. Xia, Carbon dots as an “on-off-on” fluorescent probe for detection of Cu(II) ion, ascorbic acid, and acid phosphatase, Anal. Bioanal. Chem., 2019, 411, 6645–6653 CrossRef CAS PubMed.
- Y. Zeng, Z. Xu, J. Guo, X. Yu, P. Zhao, J. Song, J. Qu, Y. Chen and H. Li, Bifunctional Nitrogen and Fluorine Co-Doped Carbon Dots for Selective Detection of Copper and Sulfide Ions in Real Water Samples, Molecules, 2022, 27(16), 5149 CrossRef CAS PubMed.
- P. M. Gharat, H. Pal and S. D. Choudhury, Photophysics and luminescence quenching of carbon dots derived from lemon juice and glycerol, Spectrochim. Acta, Part A, 2019, 209, 14–21 CrossRef CAS PubMed.
- W. J. Zhang, N. Li, Q. Chang, Z. F. Chen and S. L. Hu, Making a cup of carbon dots for ratiometric and colorimetric fluorescent detection of Cu2+ ions, Colloids Surf., A, 2020, 586, 875836 Search PubMed.
- N. Chaudhary, P. K. Gupta, S. Eremin and P. R. Solanki, One-step green approach to synthesize highly fluorescent carbon quantum dots from banana juice for selective detection of copper ions, J. Environ. Chem. Eng., 2020, 8, 986845 Search PubMed.
- Y. S. Zhao, S. S. Jing, X. W. Peng, Z. H. Chen, Y. J. Hu, H. Zhuo, R. C. Sun and L. X. Zhong, Synthesizing green carbon dots with exceptionally high yield from biomass hydrothermal carbon, Cellulose, 2020, 27, 415–428 CrossRef CAS.
- S. Chattopadhyay, N. Mehrotra, S. Jain and H. Singh, Development of novel blue emissive carbon dots for sensitive detection of dual metal ions and their potential applications in bioimaging and chelation therapy, Microchem. J., 2021, 170, 765674 CrossRef.
- Y. He, Y. Wang, G. Mao, C. Liang and M. Fan, Ratiometric fluorescent nanoprobes based on carbon dots and multicolor CdTe quantum dots for multiplexed determination of heavy metal ions, Anal. Chim. Acta, 2022, 1191, 339251 CrossRef CAS PubMed.
- A. K. Singh, V. K. Singh, M. Singh, P. Singh, S. R. Khadim, U. Singh, B. Koch, S. H. Hasan and R. K. Asthana, One pot hydrothermal synthesis of fluorescent NP-carbon dots derived from Dunaliella salina biomass and its application in on-off sensing of Hg (II), Cr (VI) and live cell imaging, J. Photochem. Photobiol., A, 2019, 376, 63–72 CrossRef CAS.
- J. Zhang, S. S. Zhao, Z. Yang, Z. W. Yang, S. L. Yang and X. R. Liu, Hydrothermal synthesis of blue-green emitting carbon dots based on the liquid products of biodegradation of coal, Int. J. Energy Res., 2021, 45, 9396–9407 CrossRef CAS.
|
| This journal is © The Royal Society of Chemistry 2023 |
Click here to see how this site uses Cookies. View our privacy policy here. 
 Open Access Article
 This Open Access Article is licensed under a Creative Commons Attribution-Non Commercial 3.0 Unported Licence
 ,
Chunmiao Bo
,
Chunmiao Bo