 Open Access Article
Recovery of tetrodotoxin from pufferfish viscera extract by amine-functionalized magnetic nanocomposites †
Dang Thuan Tran *a,
Cam Van T. Dob,
Cuc T. Dinha,
Mai T. Danga,
Khanh Hy Le Hoc,
Truong Giang Lead and
Viet Ha Daocd
aInstitute of Chemistry, Vietnam Academy of Science and Technology (VAST), 18 Hoang Quoc Viet, Cau Giay, Hanoi 100000, Vietnam. E-mail: tdangthuan@ich.vast.vn
bHaUI Institute of Technology, Hanoi University of Industry (HaUI), 298 Cau Dien, Bac Tu Liem, Hanoi, Vietnam
cInstitute of Oceanography, Vietnam Academy of Science and Technology (VAST), 01 Cau Da St., Nha Trang City 650000, Vietnam
dGraduate University of Science and Technology (GUST), Vietnam Academy of Science and Technology (VAST), 18 Hoang Quoc Viet, Cau Giay, Hanoi 100000, Vietnam
First published on 15th June 2023
Abstract
Tetrodotoxin (TTX) has been widely used in pharmacology, food poisoning analysis, therapeutic use, and neurobiology. In the last decades, the isolation and purification of TTX from natural sources (e.g., pufferfish) were mostly based on column chromatography. Recently, functional magnetic nanomaterials have been recognized as promising solid phases for the isolation and purification of bioactive compounds from aqueous matrices due to their effective adsorptive properties. Thus far, no studies have been reported on the utilization of magnetic nanomaterials for the purification of TTX from biological matrices. In this work, an effort has been made to synthesize Fe3O4@SiO2 and Fe3O4@SiO2–NH2 nanocomposites for the adsorption and recovery of TTX derivatives from a crude pufferfish viscera extract. The experimental data showed that Fe3O4@SiO2–NH2 displayed a higher affinity toward TTX derivatives than Fe3O4@SiO2, achieving maximal adsorption yields for 4epi-TTX, TTX, and Anh-TTX of 97.9, 99.6, and 93.8%, respectively, under the optimal conditions of contact time of 50 min, pH of 2, adsorbent dosage of 4 g L−1, initial adsorbate concentration of 1.92 mg L−1 4epi-TTX, 3.36 mg L−1 TTX and 1.44 mg L−1 Anh-TTX and temperature of 40 °C. Interestingly, desorption of 4epi-TTX, TTX, and Anh-TTX from Fe3O4@SiO2–NH2-TTX investigated at 50 °C was recorded to achieve the highest recovery yields of 96.5, 98.2, and 92.7% using 1% AA/ACN for 30 min reaction, respectively. Remarkably, Fe3O4@SiO2–NH2 can be regenerated up to three cycles with adsorptive performance remaining at nearly 90%, demonstrating a promising adsorbent for purifying TTX derivatives from pufferfish viscera extract and a potential replacement for resins used in column chromatography-based techniques.
1 Introduction
Tetrodotoxin (TTX) is a nonprotein neurotoxin, one of the most toxic natural toxins (LD50 = 8–11 μg kg−1) at lethal doses of 1–2 mg by the gastrointestinal tract for humans.1–3 This compound has a strong affinity and specific sodium channel blocker effect,4 leading to neurotransmission paralysis and TTX exhibits a very strong central analgesic effect.2,5 More recently, TTX is being studied as an analgesic treatment for cancers. Clinical trials in several patients have shown that TTX has a significant analgesic effect.6 One of the most recognizable species containing TTX toxin and its analogs is the pufferfish. It has been broadly used in pharmacology,7,8 food poisoning analysis,9–11 therapeutic use (e.g., anesthetic, epinephrine, bupivacaine, potential pain killer)5,12 and neurobiology.13Although TTX has displayed a wide application in relieving pain (e.g., neuropathic pain, cancer-related pain),14 neurophysiological disorders, and therapeutic usage,12,15,16 it owns some limitations due to high cost of raw TTX-producing source, extraction, and purification. Methanol, ethanol, and acetic acid were common organic solvents used for extraction of TTX.17,18 Moreover, solid materials, such as activated carbon, Bio-Rex 70 (H+ form), Bio-Gel P2, and Resin have been conventionally used as solid phases for purification of TTX.17,18 Despite numerous successful isolations, there have been no further advancements in the TTX purification process using column chromatography over the last decades.19
Nanomaterial is a class of material having one or more external dimensions in the range of 1–100 nm.20 Due to their small size, nanostructures exhibit a high specific surface area with multiple properties such as optical, electronic, magnetic, catalytic, and adsorptive activities.21 All these novel properties could potentially revolutionize many application fields.22 Among those properties, the adsorptive characteristic of nanomaterials has been applied for adsorption of different compounds in environmental, biological, and food samples.21 In order to enhance adsorption yield and capacity, nanomaterial is usually functionalized with different functional groups, such as amine, carboxylic, etc., via covalent or non-covalent approach to enhance its affinity toward targeted molecules and compounds.23,24 The functionalized surface of nanomaterial drives various applications.21–23,25–27 Moreover, nanomaterials with magnetic properties have ease of regeneration and recycling, offering a great achievement in the enhancement of the adsorption of compounds from different matrices.28 For instance, grafting of tris [2-(dimethylamino) ethyl] amine (Me6TREN) onto the surface of SiO2-coated Fe3O4 nanoparticles demonstrated a high adsorption efficacy with good selectivity of heavy metals from wastewater, while the magnetic core Fe3O4 allowed for the repeated recycling of the material.29 Notably, Fe3O4@Me6TREN NPs can be regenerated by desorbing heavy metal ions from NPs with EDTA sodium salt, which will be of great significance for cost reduction and further industrial applications.29 Functional magnetic nanocomposites, including Fe3O4–NH2@MIL-101, Fe3O4–COOH@MIL-101, and Fe3O4/C@MIL-101, synthesized by a hydrothermal method have been successfully applied for enrichment of estrogens (e.g., estrone (E1), 17β-estradiol (E2), estriol (E3), and bisphenol-A (BPA)) in environmental water samples.30 Magnetite@silica nanoparticles grafted with amino-terminated supramolecular cucurbit [6] uril pseudorotaxane complexes are shown to be highly efficient sorbent for salvianolic acids.31 Particularly, extraction and isolation of bioactive compounds by adsorption phenomena using nanomaterials is one of the novel reported method due to its simplicity and high effectiveness.32 A modification of Fe3O4@SiO2 with (3-aminopropyl)trimethoxysilane (APTMS) and alginate (AA) forming nanocomposites Fe3O4@SiO2–NH2 and Fe3O4@SiO2–NH2-AA exhibited a higher adsorption capability of alkaloids (e.g., palmatine and berberine) when compared to that of unmodified Fe3O4@SiO2.33 Magnetic nanoparticles grafted with (3-aminopropyl)triethoxysilane (APTES) were also used to load anticancer drug of Nintedanib for controlled release as a drug delivery system.34 Moreover, functional magnetic nanomaterials are also used for extraction and mycotoxins, pesticides, and pharmaceuticals in food commodities28 and adsorption/sensing of active ingredients in medicine.32
To date, there are no studies on the recovery of tetrodotoxin from pufferfish viscera extract using magnetic nanomaterials. Sequential adsorption and desorption of TTX derivatives on functionalized nanomagnetic material is a promising extraction and purification approach. The TTX derivatives have a greater tendency with positive ion groups (e.g., –NH2) by strong electrostatic interactions between amine groups of the TTX molecules. Hence, the fabrication of positive ion groups-functionalized nanoparticles enables the adsorption of TTX analogues effectively.
Therefore, the objectives of this study are to (i) to synthesize amine-functionalized nanocomposite material (Fe3O4@SiO2–NH2) and (ii) to optimize adsorption and desorption conditions of TTX derivatives from a pufferfish viscera extract. In this work, magnetic core (Fe3O4) was synthesized by co-precipitation of ferric precursors followed by deposition of a silica shell on its surface by hydrolysis of tetraethyl orthosilicate (TEOS) to form nanocomposite Fe3O4@SiO2.33 The composite material Fe3O4@SiO2 was then modified with amine-based high molecular weight molecule of (3-aminopropyl) triethoxylsilane (APTES) via covalent bonding to form amine-functionalized Fe3O4@SiO2 (Fe3O4@SiO2–NH2).35 Fe3O4@SiO2 and Fe3O4@SiO2–NH2 were then examined as adsorbents for adsorption of TTX analogues in a TTX-rich extract of pufferfish viscera. The effects of operational parameters such as adsorption time, pH, adsorbent dosage, initial adsorbate concentration, and temperature on the adsorption yield of TTX derivatives were investigated. Moreover, the effects of solvents on TTX derivatives recovery yield from desorption of Fe3O4@SiO2 and Fe3O4@SiO2–NH2 bound to TTX derivatives and regeneration of the adsorbents were also evaluated.
2. Experimental
2.1. Chemicals and reagents
Iron(II) chloride (FeCl2·4H2O) (99%), iron(III) chloride hexahydrate (FeCl3·6H2O) (99%), acetic acid (99.8%), hexane (99.5%), diethyl ether (99.5%), and ethanol (99.9%) were obtained from Samchun Chemical Co., Ltd. (Seoul, Republic of Korea). Ammonia solution (28%), tetraethyl orthosilicate (TEOS) (98%), (3-aminopropyl)triethoxysilane (APTES) (≥98%), and trichloroacetic acid (TCA) (99%) were obtained from Sigma Aldrich (Munich, Germany).2.2. Pufferfish viscera sources and tetrodotoxin extraction
Pufferfish viscera sources were obtained from fishermen in the Can Gio coast, Ho Chi Minh City, Viet Nam, in December 2021. The pufferfish viscera were preserved and transferred to the Department of Technology of Bioactive Compounds, Institute of Chemistry, Vietnam Academy of Science and Technology. The viscera parts were frozen and stored below −20 °C until use. For toxin extraction, TTX derivatives were extracted according to modified procedures that were described by Brillantes et al.36 and Dao et al.37 Briefly, pufferfish viscera of 5 kg was thawed at room temperature, followed by mechanical grinding with 6 L of 1% acetic acid (v/v). The mixture was mechanically stirred overnight, followed by boiling under heat for 20 min for protein precipitation. The aqueous phase was separated from the mixture by pressing with a filter bag (with a pore size of 0.5 μm). The resulting extract was further processed for extraction of lipid and protein precipitation by hexane/diethyl ether (2/1, v/v) and trichloroacetic acid (30%), respectively. The final lipid- and protein-eliminated extract was preserved at 2–4 °C in a refrigerator for further experiments.2.3. Preparation of Fe3O4, Fe3O4@SiO2 and Fe4O4@SiO2–NH2
For Fe3O4, 1.52 g FeCl2·4H2O and 5.4 g FeCl3·6H2O were mechanically mixed in 200 mL deionized water at room temperature for 5 min. Then, the mixture was heated up to 85 °C under mechanical stirring and purged with N2 for 15 min, followed by the addition of 25 mL NH4OH and proceeding reaction for 1 h. The brown mixture turned to a black solution indicating Fe2+ and Fe3+ were converted to Fe3O4. The resultant material was harvested by a magnetic device and washed with deionized water and ethanol to neutral pH. The black precipitate was dried under reduced pressure at 40 °C for 5 h to obtain the dried sample for further experiments. For Fe3O4@SiO2, 1 g Fe3O4 was dispersed in 160 mL absolute ethanol and 40 mL H2O in an ultrasound device for 30 min. The mixture was mechanically mixed at room temperature, followed by the addition of 10 mL NH4OH and stirring was maintained for 5 min. TEOS of 8 mL was dropwise added to the solution for hydrolysis and deposition reaction of SiO2 on the surface of Fe3O4 for 12 h under room temperature conditions. The resulting Fe3O4@SiO2 was magnetically harvested and repeatedly washed with deionized water and ethanol to neutral pH. The wet Fe3O4@SiO2 was dried under reduced pressure at 40 °C for 5 h to obtain dry Fe3O4@SiO2 for further experiments. For Fe3O4@SiO2–NH2 preparation, 2.5 g Fe3O4@SiO2 was suspended in 150 mL toluene by ultrasound for 30 min, followed by dropwise addition of 10 mL APTES and the grafting reaction proceeded under a stirring rate of 150 rpm and temperature of 25 °C for 36 h. The resulting mixture was magnetically harvested and rinsed with ethanol ten times to completely remove unbound APTES. The synthesized Fe3O4@SiO2–NH2 material was dried under reduced pressure at 40 °C for 5 h to obtain the dried sample for further experiment.2.4. Adsorption of TTX derivatives in pufferfish viscera extract by Fe3O4@SiO2 and Fe3O4@SiO2–NH2
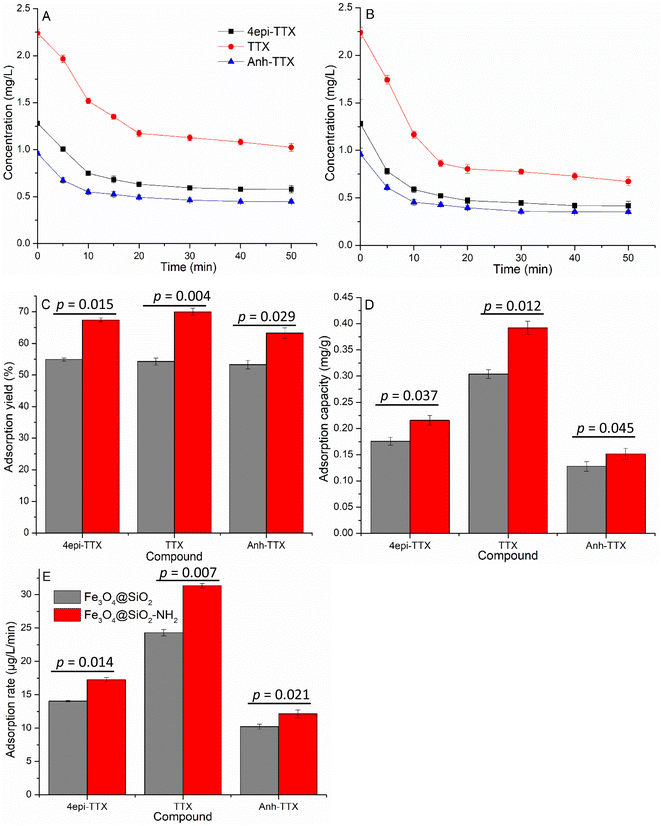
The adsorption of TTX from pufferfish viscera extract was performed by using the synthesized Fe3O4@SiO2 and Fe3O4@SiO2–NH2 as adsorbents. Briefly, 10 mL of the pufferfish viscera extract (obtained from Section 2.2) containing 1.28 mg L−1 4epi-TTX, 2.24 mg L−1 TTX, and 0.96 mg L−1 Anh-TTX was loaded into a 100 mL cylindrical cup at 25 °C under stirring of 150 rpm, followed by the addition of Fe3O4@SiO2 or Fe3O4@SiO2–NH2 at a concentration of 4 g L−1 for adsorption of TTX. Various process parameters, including contact time, pH, dosage of Fe3O4@SiO2 or Fe3O4@SiO2–NH2, initial concentration of TTX derivatives, and temperature, were investigated for maximal adsorption of TTX derivatives. The pH of the pufferfish viscera extract was adjusted from 2 to 10 with 2 M HCl or 2 M NaOH. Nanomaterial dosages used for investigation were in the range of 0–10 g L−1. The equilibrium conditions for the adsorption of TTX derivatives onto Fe3O4@SiO2 or Fe3O4@SiO2–NH2 were studied at different initial concentrations of TTX derivatives of 0.64 mg L−1 4epi-TTX, 1.12 mg L−1 TTX, and 0.48 mg L−1 Anh-TTX; 0.96 mg L−1 4epi-TTX, 1.68 mg L−1 TTX, and 0.72 mg L−1 Anh-TTX; 1.28 mg L−1 4epi-TTX, 2.24 mg L−1 TTX, and 0.96 mg L−1 Anh-TTX; 1.92 mg L−1 4epi-TTX, 3.36 mg L−1 TTX, and 1.44 mg L−1 Anh-TTX; and 2.81 mg L−1 4epi-TTX, 4.72 mg L−1 TTX, and 1.93 mg L−1 Anh-TTX for a contact time of 0–50 min. The temperature effect was investigated in the range of 25–80 °C. Samples were regularly taken at 5, 10, 15, 20, 30, 40, and 50 min for measurement of TTX derivative concentrations remaining in the suspension solution. Fe3O4@SiO2 or Fe3O4@SiO2–NH2 absorbed with TTX derivatives were designated as Fe3O4@SiO2-TTX and Fe3O4@SiO2–NH2-TTX, respectively. These materials were recovered from the experimental solution by an external electromagnet.For desorption of TTX derivatives from Fe3O4@SiO2-TTX and Fe3O4@SiO2–NH2-TTX, 50 mL of each solvent including 1% acetic acid/water (AA, 1% (v/v)), 1% acetic acid/methanol (AA/MeOH (1%, v/v)), 1% acetic acid/ethanol (AA/EtOH (1%, v/v)) or 1% acetic acid/acetonitrile (AA/ACN (1%, v/v)) was mixed with Fe3O4@SiO2-TTX or Fe3O4@SiO2–NH2-TTX at a temperature of 50 °C and stirring rate of 150 rpm for 30 min to desorb TTX derivatives from the materials. TTX derivatives in the suspension solvent were analyzed for determination of TTX derivative recovery. The regenerated Fe3O4@SiO2 and Fe3O4@SiO2–NH2 were repeatedly used for several adsorption and desorption cycles.
2.5. Determination of TTX derivative adsorption performance of Fe3O4@SiO2 and Fe3O4@SiO2–NH2
The TTX derivative adsorption capacity (q), TTX derivative adsorption yield (E), and TTX derivative adsorption rate (R) of Fe3O4@SiO2 and Fe3O4@SiO2–NH2 were calculated according to the following equations:
 | (1) |
 | (2) |
 | (3) |
2.6. Analysis
To determine TTX derivatives in pufferfish viscera extract, the extract obtained from Section 2.2 was priorly treated using an ENVI-carb SPE cartridge 250 mg (Sigma Aldrich Japan, Tokyo, Japan), diluted by four-fold diluted acetonitrile.37 TTX derivatives were quantified by using a protocol and hydrophilic interaction liquid chromatography-mass spectrometer (HILIC/MS-MS) coupled with Shimadzu system triple-quadrupole mass spectrometer (LCMS-8040; Shimadzu Corporation, Kyoto, Japan) that were described by Dao et al.38 The HILIC separation was performed using a Waters Xbrige (HILIC) Amide column (4.6 mm I.D × 150 mm, 3.5 μm) at 60 °C with 5 μl sample volume injected. Mobile phases were water/formic acid/ammonium hydroxide (500![[thin space (1/6-em)]](https://www.rsc.org/images/entities/char_2009.gif) :
:![[thin space (1/6-em)]](https://www.rsc.org/images/entities/char_2009.gif) 0.075
0.075![[thin space (1/6-em)]](https://www.rsc.org/images/entities/char_2009.gif) :
:![[thin space (1/6-em)]](https://www.rsc.org/images/entities/char_2009.gif) 0.3 v/v/v) (A); acetonitrile/water/formic acid (700
0.3 v/v/v) (A); acetonitrile/water/formic acid (700![[thin space (1/6-em)]](https://www.rsc.org/images/entities/char_2009.gif) :
:![[thin space (1/6-em)]](https://www.rsc.org/images/entities/char_2009.gif) 300
300![[thin space (1/6-em)]](https://www.rsc.org/images/entities/char_2009.gif) :
:![[thin space (1/6-em)]](https://www.rsc.org/images/entities/char_2009.gif) 0.1 v/v/v) (B) with a flow rate of 0.6 mL min−1.
0.1 v/v/v) (B) with a flow rate of 0.6 mL min−1.
The chromatographic conditions consisted of initial conditions 100% B, held for 20 min, followed by a linear gradient 50![[thin space (1/6-em)]](https://www.rsc.org/images/entities/char_2009.gif) :
:![[thin space (1/6-em)]](https://www.rsc.org/images/entities/char_2009.gif) 50 A and B within 15 min, held for 9.90 min. Ion source parameters of MS spectrometer were as follows: Entrance Potential (EP): 10 V; Curtain gas (CUR): 30 psi; Ion Spray Voltage (IS): 4500 V; source desolvation temperature (TEM): 250 °C; source ion block temperature: 400 °C; desolvation gas flow: 1000 L h−1, Nebulizer gas flow: 2 L min−1; collision gas flow rate: 0.15 mL min−1. Multiple reaction monitoring (MRM) was performed in positive electrospray ionization (ESI+). A minimum of two transitions were used for each STX analogue. For each target ion, MRM ion channels were selected for specific product ions generated from the selected precursor ion.36 To confirm TTX derivatives in the extract of pufferfish viscera, MS/MS spectra were obtained at −25 eV of collision energy with m/z 320.1 > 302.1 for TTX and 4epi-TTX, m/z 302.0 > 284.1 for Anh- TTX in the 1st transition; and −40 eV with m/z 320.1 > 162.1 for TTX and 4epi-TTX, m/z 302.0 > 162.0 for Anh-TTX in the 2nd transition. TTX derivative contents were calculated from HILIC-MS/MS data using standard curves and expressed in mg L−1.39 Validation of the accuracy of the HILIC-MS/MS methodology for quantification of TTX derivatives in pufferfish viscera extract was described in detail in the electronic ESI (ESI†).
50 A and B within 15 min, held for 9.90 min. Ion source parameters of MS spectrometer were as follows: Entrance Potential (EP): 10 V; Curtain gas (CUR): 30 psi; Ion Spray Voltage (IS): 4500 V; source desolvation temperature (TEM): 250 °C; source ion block temperature: 400 °C; desolvation gas flow: 1000 L h−1, Nebulizer gas flow: 2 L min−1; collision gas flow rate: 0.15 mL min−1. Multiple reaction monitoring (MRM) was performed in positive electrospray ionization (ESI+). A minimum of two transitions were used for each STX analogue. For each target ion, MRM ion channels were selected for specific product ions generated from the selected precursor ion.36 To confirm TTX derivatives in the extract of pufferfish viscera, MS/MS spectra were obtained at −25 eV of collision energy with m/z 320.1 > 302.1 for TTX and 4epi-TTX, m/z 302.0 > 284.1 for Anh- TTX in the 1st transition; and −40 eV with m/z 320.1 > 162.1 for TTX and 4epi-TTX, m/z 302.0 > 162.0 for Anh-TTX in the 2nd transition. TTX derivative contents were calculated from HILIC-MS/MS data using standard curves and expressed in mg L−1.39 Validation of the accuracy of the HILIC-MS/MS methodology for quantification of TTX derivatives in pufferfish viscera extract was described in detail in the electronic ESI (ESI†).
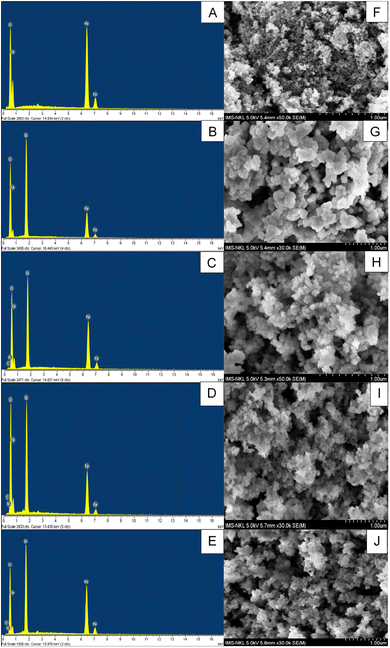
Morphological characteristics of Fe3O4, Fe3O4@SiO2, Fe3O4@SiO2–NH2, Fe3O4@SiO2-TTX, and Fe3O4@SiO2–NH2-TTX were analyzed by scanning electron microscopy (FE-SEM S-4800, Hitachi, Tokyo, Japan). The composition and distribution of surface elements of the nanomaterial samples were measured by energy-dispersive X-ray spectroscopy (EDS, 7593-H, HORIBA, UK) coupled to SEM. Crystal structures of Fe3O4, Fe3O4@SiO2, Fe3O4@SiO2–NH2, Fe3O4@SiO2-TTX, and Fe3O4@SiO2–NH2-TTX were analyzed by X-ray diffraction (XRD, D8- Advance, Bruker, Germany) at theta from 10 to 80°. Thermal properties of Fe3O4, Fe3O4@SiO2, Fe3O4@SiO2–NH2, Fe3O4@SiO2-TTX, and Fe3O4@SiO2–NH2-TTX were assayed by thermo gravimetric analysis (TGA, Labsys TGA1600, SETARAM, France) from room temperature to 900 °C at a heating rate of 10 °C min−1 under nitrogen gas flow condition. Functional groups on Fe3O4, Fe3O4@SiO2, Fe3O4@SiO2–NH2, Fe3O4@SiO2-TTX, and Fe3O4@SiO2–NH2-TTX were characterized with an FT-IR analysis (Spectrum Two FT-IR Spectrometer, PerkinElmer, UK) for the scan range of 4000–400 cm−1 at a resolution of 4 cm−1.
2.7. Statistical analysis
Experiments were conducted in triplicate, and data were reported as mean ± standard deviation (SD). Statistical analysis was done using one-way ANOVA followed by post hoc Tukey's test (Graph pad V7) and a p-value of <0.05 was declared as significant. The statistical analysis was conducted using the software package MiniTab18 (Minitab Pty Ltd., Sydney, Australia).3 Results and discussions
3.1. Characterization of materials
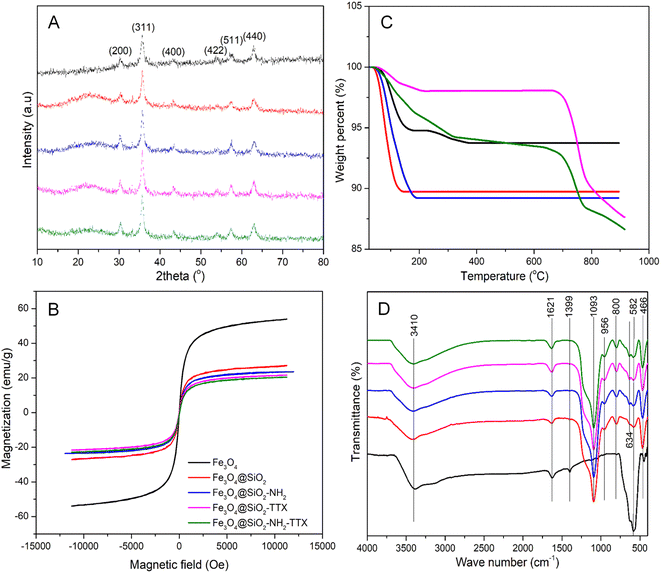 | ||
| Fig. 1 Characteristics of Fe3O4, Fe3O4@SiO2, Fe3O4@SiO2–NH2, Fe3O4@SiO2-TTX, Fe3O4@SiO2–NH2-TTX. XRD (A), VSM (B), TGA (C), and FT-IR (D). | ||
| Element (%) | Fe3O4 | Fe3O4@SiO2 | Fe3O4@SiO2–NH2 | Fe3O4@SiO2-TTX | Fe3O4@SiO2–NH2-TTX |
|---|---|---|---|---|---|
| a ND: not detected. TTX: tetrodotoxin. | |||||
| C | ND | ND | 4.13 ± 0.38 | 4.66 ± 0.71 | 4.22 ± 0.64 |
| N | ND | ND | 6.77 ± 0.54 | 6.88 ± 1.03 | 6.91 ± 1.07 |
| O | 39.46 ± 2.45 | 46.52 ± 5.83 | 43.26 ± 1.01 | 43.88 ± 10.58 | 44.00 ± 5.49 |
| Si | ND | 25.69 ± 1.75 | 16.92 ± 0.33 | 15.66 ± 0.33 | 15.81 ± 0.63 |
| Fe | 60.54 ± 2.45 | 27.79 ± 4.72 | 28.93 ± 1.41 | 28.91 ± 10.43 | 29.05 ± 6.62 |
The silica layer not only helps the magnetic core to be stable, avoiding corrosion, but also keeps the core Fe3O4 from leaching during the entire course of the reaction. Surface modification of –NH2 functional groups and/or adsorption of TTX derivatives onto the surface of nanomaterials did not alter the shape and structure of the nanoparticles, as shown in Fig. 2H–J.
![[thin space (1/6-em)]](https://www.rsc.org/images/entities/char_2009.gif) 000 Oe. This value is lower than the magnetization of bare Fe3O4 (68.78 emu g−1) synthesized by Kumar et al. (2022)40 and super-paramagnetic cubic Fe3O4 materials (92 emu g−1) reported by Liu et al. (2019).43 After coating of SiO2 layer, Fe3O4@SiO2 material achieved a reduced magnetization of 22 emu g−1. Moreover, grafting of –NH2 groups and adsorption of TTX derivatives on Fe3O4@SiO2 forming Fe3O4@SiO2–NH2, Fe3O4@SiO2-TTX, and Fe3O4@SiO2–NH2-TTX materials with magnetization strength further decreased to 19–20 emu g−1 (Fig. 1B). Despite the reduction of magnetization, the Fe3O4@SiO2-TTX and Fe3O4@SiO2–NH2-TTX materials still own a high magnetic strength that is fairly sufficient for recovery and separation by favorable electromagnets for regeneration.
000 Oe. This value is lower than the magnetization of bare Fe3O4 (68.78 emu g−1) synthesized by Kumar et al. (2022)40 and super-paramagnetic cubic Fe3O4 materials (92 emu g−1) reported by Liu et al. (2019).43 After coating of SiO2 layer, Fe3O4@SiO2 material achieved a reduced magnetization of 22 emu g−1. Moreover, grafting of –NH2 groups and adsorption of TTX derivatives on Fe3O4@SiO2 forming Fe3O4@SiO2–NH2, Fe3O4@SiO2-TTX, and Fe3O4@SiO2–NH2-TTX materials with magnetization strength further decreased to 19–20 emu g−1 (Fig. 1B). Despite the reduction of magnetization, the Fe3O4@SiO2-TTX and Fe3O4@SiO2–NH2-TTX materials still own a high magnetic strength that is fairly sufficient for recovery and separation by favorable electromagnets for regeneration.3.2. TTX derivative contents in pufferfish viscera extract
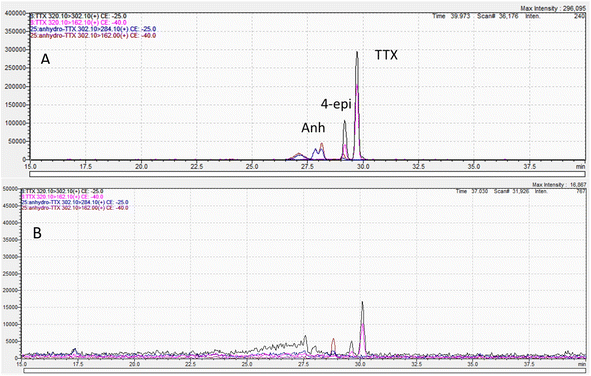
Based on HPLC chromatograms of TTX standards (Fig. 3A) and TTX-rich pufferfish viscera extract (Fig. 3B), it is determined that the pufferfish viscera extract contains three basic derivatives of the TTX group, which are 4epi-TTX, TTX, and Anh-TTX. The content of 4epi-TTX, TTX, and Anh-TTX were determined as 2.81 ± 0.07, 4.72 ± 0.05, and 1.93 ± 0.03 mg L−1 (Table 2), respectively. A high concentration of TTX derivatives indicates that pufferfish viscera extract is a promising source for TTX derivative purification using functional nanomaterials via adsorption–desorption protocol.| a Pufferfish viscera was collected from fishermen in the Can Gio coast, Ho Chi Minh City, Vietnam. | |||
|---|---|---|---|
| Derivative | 4epi-TTX | TTX | Anh-TTX |
| Content (mg L−1) | 2.81 ± 0.07 | 4.72 ± 0.05 | 1.93 ± 0.03 |
3.3. Adsorption characteristics of TTX derivatives on Fe3O4@SiO2 and Fe3O4@SiO2–NH2
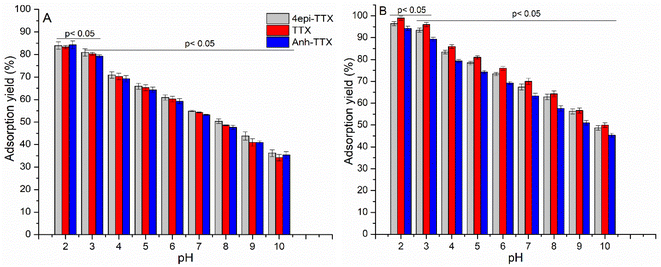
Specifically, the adsorption yield of TTX compounds on Fe3O4@SiO2 and Fe3O4@SiO2–NH2 at pH 2–3 reached 79–84 (Fig. 5A) and 89–99% (Fig. 5B), respectively. When solution pH increased to levels of 4–10, the adsorption yields of Fe3O4@SiO2 and Fe3O4@SiO2–NH2 for TTX derivatives were significantly decreased to 34–71% (p < 0.05, Fig. 5A) and 45–85% (p < 0.05, Fig. 5B), respectively. This data is reasonable because TTX derivatives were successfully purified by most column chromatography packed with cation resins such as Bio-Rex 70 (H+ form), Bio-Gel P217, and carboxylic acid form of HEMA.50 This demonstrates that TTX derivatives exhibit a high affinity to cationic surface materials. From the data obtained, pH 2.0 was chosen for further experiments.
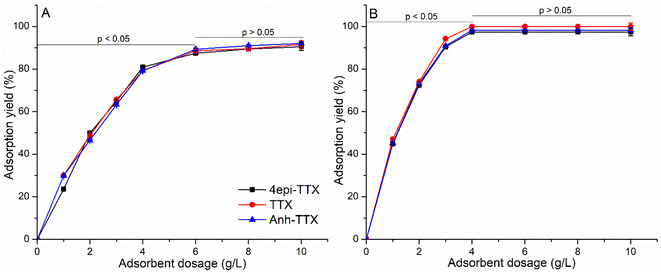
The data shown in Fig. 6 reveals that the adsorption yield for 4epi-TTX, TTX and Anh-TTX increases sharply from 0 to 80–83% as the dosage of Fe3O4@SiO2 increases from 0 to 4 g L−1 (p < 0.05, Fig. 6A). Further increase in Fe3O4@SiO2 dosage to higher than 4 g L−1 resulted in a gradual enhancement of adsorption yield, which reached saturated levels of 90, 91, and 92% for 4epi-TTX, TTX, and Anh-TTX at the adsorbent dosage used, 10 g L−1, respectively (p > 0.05, Fig. 6A). Similarly, a strong upward trend in adsorption yield was observed when Fe3O4@SiO2–NH2 dosage increased from 0 to 4 g L−1 of, achieving 97, 97, and 98% for 4epi-TTX, TTX and Anh-TTX, respectively (p < 0.05, Fig. 6B). When Fe3O4@SiO2–NH2 dosage increased to 10 g L−1, the adsorption yield for 4epi-TTX, TTX and Anh-TTX reached saturation levels of 97.4, 98, and 98.5%, respectively (p > 0.05, Fig. 6B). The adsorption data measured for Fe3O4@SiO2–NH2 demonstrated that grafting the –NH2 functional group on Fe3O4@SiO2 surface significantly improved the adsorption yield for TTX derivatives by 7% compared to that of Fe3O4@SiO2 at the same adsorbent dosage used, which is 4 g L−1 (Fig. 6B). The achieved results recommended the adsorbent dosage of 4 g L−1 for further experiments.
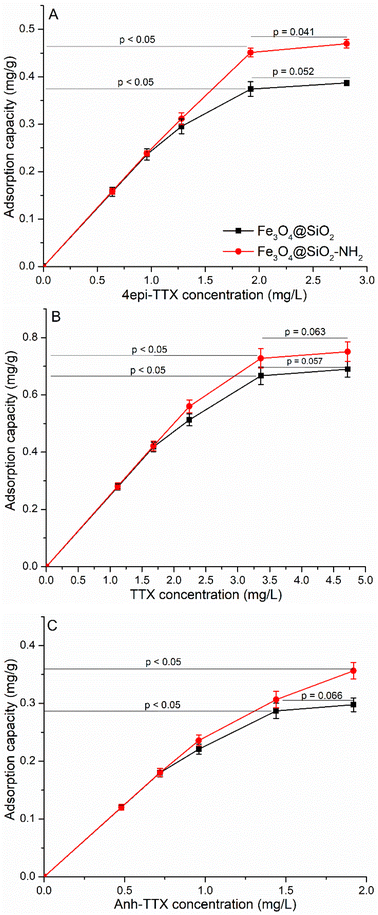
Data shown in Fig. 7 reveals that when the concentration of 4epi-TTX increases from 0 to 1.28 mg L−1, the adsorption capacity of Fe3O4@SiO2 and Fe3O4@SiO2–NH2 increases linearly from 0 to levels of 0.296 and 0.312 mg g−1, respectively. Increasing 4epi-TTX concentration to 1.92 mg L−1 enhanced the 4epi-TTX adsorption capacity of Fe3O4@SiO2 and Fe3O4@SiO2–NH2 by 0.374 and 0.451 mg g−1, which gradually increased to 0.388 and 0.470 mg g−1, respectively, as 4epi-TTX further increased to 2.81 mg L−1 (Fig. 7A). For TTX and Anh-TTX, the studied concentrations were 0–4.72 and 0–1.93 mg L−1, respectively. However, the linear trend of adsorption capacity of Fe3O4@SiO2 and Fe3O4@SiO2–NH2 for TTX was observed at TTX concentration of 0–2.24 mg L−1, followed by the second-order polynomial trend when initial TTX concentration further increased from 2.24 to 4.72 mg L−1. The adsorption capacities of Fe3O4@SiO2 and Fe3O4@SiO2–NH2 for TTX derivatives were measured as 0–0.670 and 0–0.751 mg g−1 (Fig. 7B), respectively. The linear trend of adsorption capacity of Fe3O4@SiO2 and Fe3O4@SiO2–NH2 for Anh-TTX was observed at Anh-TTX concentration of 0–0.96 mg L−1, followed by the second-order polynomial trend when initial Anh-TTX concentration further increased from 0.96 to 1.93 mg L−1. The adsorption capacities of Fe3O4@SiO2 and Fe3O4@SiO2–NH2 for Anh-TTX were 0–0.298 and 0–0.331 mg g−1 (Fig. 7C), respectively. The obtained data recommend the initial adsorbate concentrations of 1.92 mg L−1 4epi-TTX, 3.36 mg L−1 TTX, and 1.44 mg L−1 Anh-TTX for further experiments.
3.4. Regeneration of Fe3O4@SiO2 and Fe3O4@SiO2–NH2 and recovery of TTX derivatives
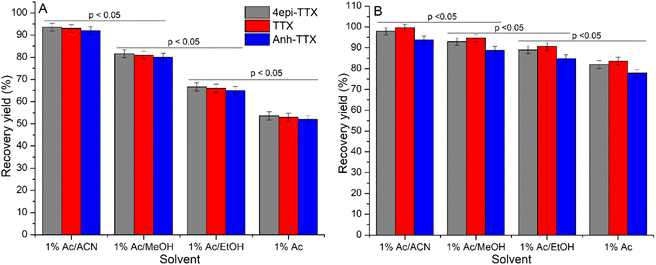
Desorption of 4epi-TTX, TTX, and Anh-TTX from Fe3O4@SiO2-TTX and Fe3O4@SiO2–NH2-TTX materials is necessary to recover TTX derivatives being utilized for various purposes as well as to regenerate Fe3O4@SiO2 and Fe3O4@SiO2–NH2 for recycling. The desorption performance of 4epi-TTX, TTX, and Anh-TTX depends on the extraction solvents. As TTX derivatives are polar molecules, weakly polar desorption solvents, including acetonitrile (ACN), ethanol (EtOH), methanol (MeOH), and acetic acid (AA) were evaluated. The data shown in Fig. 9A illustrates that 1% AA/ACN solvent gives TTX derivative recovery yield of 91.7–93.6%, whereas 1% AA/MeOH, 1% AA/EtOH, and 1% AA only achieve 80–81.6, 65–66.6, and 52–53.6% from Fe3O4@SiO2-TTX, respectively. The recovery yields of 4epi-TTX, TTX, and Anh-TTX from Fe3O4@SiO2–NH2-TTX by 1% AA/ACN, 1% AA/MeOH, 1% AA/EtOH, and 1% AA were determined as 92.7–98.2%, 88.8–94.6, 84.8–88.9, and 77.8–81.9%, respectively (Fig. 9B). Remarkably, TTX derivatives recovered from Fe3O4@SiO2-TTX and Fe3O4@SiO2–NH2-TTX using 1% AA/ACN solvent displayed high purity (Fig. 10A and B) when compared to that of the original crude extract (Fig. 3B), demonstrating that the synthesized nanocomposites, particularly Fe3O4@SiO2–NH2, were highly efficient adsorbents for recovery of TTX derivatives from pufferfish viscera extract without further chromatography-based purification.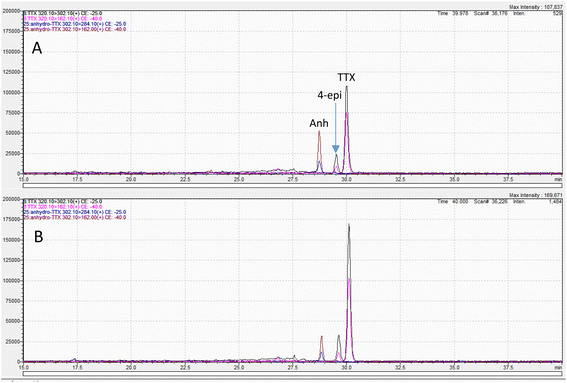 | ||
| Fig. 10 HPLC spectra of 4epi-TTX, TTX, and Anh-TTX recovered from Fe3O4@SiO2-TTX (A) and Fe3O4@SiO2–NH2-TTX (B) using 1% AA/ACN solvent. | ||
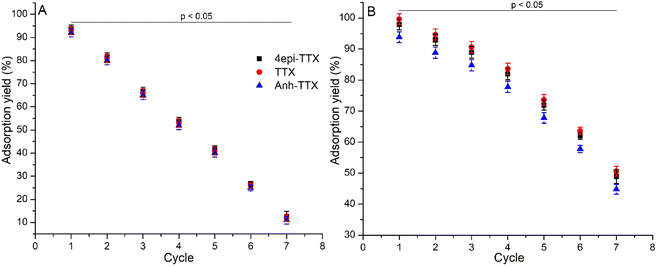
The reuse of adsorbents is extremely important for economic optimization. The process of using adsorbent materials to isolate active ingredients many times causes deactivation of the superficial activity of the materials and leads to a decrease in the adsorption yield. The data presented in Fig. 11A shows that the adsorption yields of Fe3O4@SiO2 for 4epi-TTX, TTX, and Anh-TTX decrease sharply with the number of cycles, reducing from 80 to 10% when repeated cycles increase from 2nd to 7th, respectively. Notably, the Fe3O4@SiO2–NH2 material exhibited a dominant strength as it achieved an adsorption yield of nearly 90% after three cycles and considerably decreased to about 45% after 7 cycles (Fig. 11B).
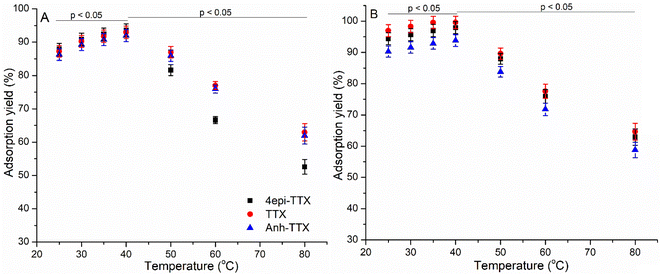
Overall, optimal conditions for adsorption of TTX derivatives by Fe3O4@SiO2 and Fe3O4@SiO2–NH2 from the pufferfish viscera extract were contact time of 50 min, pH 2, adsorbent dosage of 4 g L−1, initial adsorbate concentration of 1.92 mg L−1 4epi-TTX, 3.36 mg L−1 TTX and 1.44 mg L−1 Anh-TTX, and temperature of 40 °C. For desorption of 4epi-TTX, TTX and Anh-TTX, the best solvent was 1% AA/ACN with the maximal recovery yield obtained under 50 °C for a 30 min reaction. The material Fe3O4@SiO2–NH2 was demonstrated to be a better adsorbent in the recovery of TTX derivatives from the crude pufferfish viscera extract when compared to Fe3O4@SiO2.
4 Conclusions
We have successfully synthesized Fe3O4@SiO2 and Fe3O4@SiO2–NH2 and utilized them as adsorbents for the adsorption of TTX derivatives from crude pufferfish viscera extract. Among the materials, Fe3O4@SiO2–NH2 exhibited a higher affinity toward TTX derivatives during adsorption. The optimal conditions for adsorption of TTX derivatives onto Fe3O4@SiO2–NH2 were contact time of 50 min, pH 2, adsorbent dosage of 4 g L−1, initial adsorbate concentrations of 1.92 mg L−1 4epi-TTX, 3.36 mg L−1 TTX, and 1.44 mg L−1 Anh-TTX, and temperature of 40 °C. Under the optimal conditions, Fe3O4@SiO2–NH2 achieved adsorption yields for 4epi-TTX, TTX, and Anh-TTX were 93.8–99.6%. The highest recovery of 92.7–98.2% of 4epi-TTX, TTX, and Anh-TTX from Fe3O4@SiO2–NH2-TTX was recorded with 1% AA/ACN as the extracting solvent under 50 °C for a 30 min reaction. Remarkably, Fe3O4@SiO2–NH2 can be regenerated and reused to up to three cycles without significant loss of its original activity. The synthesized Fe3O4@SiO2–NH2 was demonstrated as a promising adsorbent for the isolation and purification of TTX derivatives from the pufferfish viscera extract without the use of column chromatography. Our future works are aimed at the synthesis of large amounts of Fe3O4@SiO2–NH2 for up-scale purification of TTX derivatives from the pufferfish viscera extract.Author contributions
Dang Thuan Tran: conceptualization, investigation, writing-original draft, project administration, funding acquisition; Cam Van T. Do: instruments sources, investigation, data curation, visualization; Cuc T. Dinh: investigation, data curation; Mai T. Dang: instruments sources, investigation; Khanh Hy Le Ho: investigation, data curation; Truong Giang Le: conceptualization, supervision, revision; Viet Ha Dao: conceptualization, supervision, revision.Conflicts of interest
There are no conflicts to declare.Acknowledgements
This research was financially funded by the Vietnam Academy of Science and Technology under the grant code of TĐĐTB0.06/21-23.References
- Y. K. T Goto, S. Takahashi and Y. Hirata, Tetrahedron, 1965, 21, 2059–2088 CrossRef PubMed.
- S. I. K Tsuda, M. Kawamura, R. Tachikawa and K. Sakai, Chem. Pharm. Bull., 1964, 12, 1357–1374 CrossRef PubMed.
- T. Noguchi and O. Arakawa, Mar. Drugs, 2008, 6, 220–242 CrossRef CAS PubMed.
- C. H. Lee and P. C. Ruben, Channels, 2008, 2, 407–412 CrossRef PubMed.
- F. R. Nieto, E. J. Cobos, M. A. Tejada, C. Sanchez-Fernandez, R. Gonzalez-Cano and C. M. Cendan, Mar. Drugs, 2012, 10, 281–305 CrossRef CAS PubMed.
- N. A. Hagen, B. Lapointe, M. Ong-Lam, B. Dubuc, D. Walde, B. Gagnon, R. Love, R. Goel, P. Hawley, A. H. Ngoc and P. Du Souich, Curr. Oncol., 2011, 18, e109–e116 CrossRef CAS PubMed.
- A. Leffler, R. I. Herzog, S. D. Dib-Hajj, S. G. Waxman and T. R. Cummins, Pflugers Arch., 2005, 451, 454–463 CrossRef CAS PubMed.
- T. Narahashi, J. Toxicol. Toxin Rev., 2001, 20, 67–84 CrossRef CAS.
- T. Noguchi, K. Onuki and O. Arakawa, ISRN Toxicol., 2011, 2011, 276939 Search PubMed.
- K. Tsujimura, H. Yoshimura, T. Taguri and H. Motomura, Shokuhin Eiseigaku Zasshi, 2017, 58, 253–259 CrossRef CAS PubMed.
- T. Noguchi and O. Arakawa, Mar. Drugs, 2008, 6, 220–242 CrossRef CAS PubMed.
- J. Lago, L. P. Rodríguez, L. Blanco, J. M. Vieites and A. G. Cabado, Mar. Drugs, 2015, 13, 6384–6406 CrossRef CAS PubMed.
- M. H. Evans, Int. Rev. Neurobiol., 1972, 15, 83–166 CrossRef CAS PubMed.
- S. Islam, Z. Wang, Z. Zhou and W. Liu, E3S Web of Conferences, 2021, vol. 292, p. 03065 Search PubMed.
- P. Katikou, C. Gokbulut, A. R. Kosker, M. Campàs and F. Ozogul, Mar. Drugs, 2022, 20, 47 CrossRef CAS PubMed.
- G. M. Bucciarelli, M. Lechner, A. Fontes, L. B. Kats, H. L. Eisthen and H. B. Shaffer, Toxins, 2021, 13, 517 CrossRef CAS PubMed.
- A. Manabu, S. Yasuo, M. Keisuke and N. Tamao, in Chromatography, ed. C. Leonardo de Azevedo, IntechOpen, Rijeka, 2012, ch. 10, DOI:10.5772/48668.
- X. W. Chen, H. X. Liu, Y. B. Jin, S. F. Li, X. Bi, S. Chung, S. S. Zhang and Y. Y. Jiang, Toxicon, 2011, 57, 938–943 CrossRef CAS PubMed.
- W. E. Houssen and M. Jaspars, in Natural Products Isolation, eds. S. D. Sarker and L. Nahar, Humana Press, Totowa, NJ, 2012, pp. 367–392, DOI:10.1007/978-1-61779-624-1_14.
- M. Fabbiani, F. Cesano, F. Pellegrino and C. Negri, Molecules, 2021, 26, 7097 CrossRef CAS PubMed.
- R. Kecili and C. M. Hussain, in Nanomaterials in Chromatography, ed. C. M. Hussain, Elsevier, 2018, pp. 89–115, DOI:10.1016/B978-0-12-812792-6.00004-2.
- I. Khan, K. Saeed and I. Khan, Arabian J. Chem., 2019, 12, 908–931 CrossRef CAS.
- R. Bushra, in Nanomaterials in Chromatography, ed. C. M. Hussain, Elsevier, 2018, pp. 403–414, DOI:10.1016/B978-0-12-812792-6.00015-7.
- J. Comer, R. Chen, H. Poblete, A. Vergara-Jaque and J. E. Riviere, ACS Nano, 2015, 9, 11761–11774 CrossRef CAS PubMed.
- M. B. Bhavya, S. Swain, P. Bhol, S. Yadav, A. Altaee, M. Saxena, P. K. Misra and A. K. Samal, in Functionalized Nanomaterials for Catalytic Application, 2021, pp. 109–134, DOI:10.1002/9781119809036.ch4.
- S. Palit and C. M. Hussain, in Handbook of Functionalized Nanomaterials for Industrial Applications, ed. C. Mustansar Hussain, Elsevier, 2020, pp. 3–14, DOI:10.1016/B978-0-12-816787-8.00001-6.
- S. Kanchi and K. Bisetty, in Nanomaterials in Chromatography, ed. C. M. Hussain, Elsevier, 2018, pp. 37–54, DOI:10.1016/B978-0-12-812792-6.00002-9.
- S. Targuma, P. B. Njobeh and P. G. Ndungu, Molecules, 2021, 26, 4284 CrossRef CAS PubMed.
- J. Jing and C. Shi, Molecules, 2020, 25, 3204 CrossRef CAS PubMed.
- Y.-F. Huang, M. Liu, Y.-Q. Wang, Y. Li, J.-M. Zhang and S.-H. Huo, RSC Advances, 2016, 6, 15362–15369 RSC.
- Q. Zhang, D. D. Zhou, J. W. Zhang, D. Gao, F. Q. Yang, H. Chen and Z. N. Xia, Talanta, 2019, 195, 354–365 CrossRef CAS PubMed.
- J. Qian and G. Kai, J. Pharm. Biomed. Anal., 2020, 190, 113548 CrossRef CAS PubMed.
- L. Yang, J. Tian, J. Meng, R. Zhao, C. Li, J. Ma and T. Jin, Molecules, 2018, 23, 562 CrossRef PubMed.
- V. C. Karade, A. Sharma, R. P. Dhavale, R. P. Dhavale, S. R. Shingte, P. S. Patil, J. H. Kim, D. R. T. Zahn, A. D. Chougale, G. Salvan and P. B. Patil, Sci. Rep., 2021, 11, 5674 CrossRef CAS PubMed.
- Y. Li, H. Chen, J. Wu, Q. He, Y. Li, W. Yang and Y. Zhou, Appl. Surf. Sci., 2018, 447, 393–400 CrossRef CAS.
- S. Brillantes, W. Samosorn, S. Faknoi and Y. Oshima, Fish. Sci., 2003, 69, 1224–1230 CrossRef CAS.
- H. Dao Viet, L. H. K. Hy, T. S. H. Trinh, N. N. Tung and P. X. Ky, Russ. J. Mar. Biol., 2023, 49, 62–67 CrossRef.
- V. H. Dao, H. K. H. Le and X. K. Pham, AMA, 2021, 51, 1501–1507 Search PubMed.
- M. Nakamura and T. Yasumoto, Toxicon, 1985, 23, 271–276 CrossRef CAS PubMed.
- A. P. Kumar, D. Bilehal, T. Desalegn, S. Kumar, F. Ahmed, H. C. A. Murthy, D. Kumar, G. Gupta, D. K. Chellappan, S. K. Singh, K. Dua and Y.-I. Lee, Adsorp. Sci. Technol., 2022, 2022, 3970287 Search PubMed.
- Y. Cheng, R. Tan, W. Wang, Y. Guo, P. Cui and W. Song, J. Mater. Sci., 2010, 45, 5347–5352 CrossRef CAS.
- A. Bali Ogholbeyg, A. Kianvash, A. Hajalilou, E. Abouzari-Lotf and A. Zarebkohan, J. Mater. Sci.: Mater. Electron., 2018, 29, 12135–12143 CrossRef CAS.
- X. Liu, S. Jiang, M. Niu, S. Li, W. Li and S. Yu, J. Nanosci. Nanotechnol., 2019, 19, 833–838 CrossRef CAS PubMed.
- K. Tsuda and M. Kawamura, Pharm. Bull., 1953, 1, 112–113 CrossRef CAS PubMed.
- T. K. H. Ta, M.-T. Trinh, N. V. Long, T. T. M. Nguyen, T. L. T. Nguyen, T. L. Thuoc, B. T. Phan, D. Mott, S. Maenosono, H. Tran-Van and V. H. Le, Colloids Surf. A Physicochem. Eng. Asp., 2016, 504, 376–383 CrossRef CAS.
- K. V. Arivizhivendhan, M. Mahesh, R. Boopathy, K. Patchaimurugan, P. Maharaja, S. Swarnalatha, R. Regina Mary and G. Sekaran, J. Phys. Chem. B, 2016, 120, 9685–9696 CrossRef CAS PubMed.
- S. S. Nadar, P. D. Patil and N. M. Rohra, Trends Food Sci. Technol., 2020, 103, 225–238 CrossRef CAS.
- J. M. Goddard and J. H. Hotchkiss, Prog. Polym. Sci., 2007, 32, 698–725 CrossRef CAS.
- K. S. Yoha, S. R. Priyadarshini, J. A. Moses and C. Anandharamakrishnan, in Green Nanomaterials: Processing, Properties, and Applications, ed. S. Ahmed and W. Ali, Springer Singapore, Singapore, 2020, pp. 261–282, DOI:10.1007/978-981-15-3560-4_11.
- Y. Shimizu, in Natural Products Isolation, ed. R. J. P. Cannell, Humana Press, Totowa, NJ, 1998, pp. 329–341, DOI:10.1007/978-1-59259-256-2_11.
- M. H. Jnr and A. I. Spiff, Electron. J. Biotechnol., 2005, 8, 162–169 CrossRef CAS.
- Y. S. Al-Degs, M. I. El-Barghouthi, A. H. El-Sheikh and G. M. Walker, Dyes Pigm., 2008, 77, 16–23 CrossRef CAS.
Footnote |
| † Electronic supplementary information (ESI) available. See DOI: https://doi.org/10.1039/d3ra02166a |
| This journal is © The Royal Society of Chemistry 2023 |

