 Open Access Article
A pyridine dicarboxylate based hydrazone Schiff base for reversible colorimetric recognition of Ni2+ and PPi†
Rashim Bawaa,
Swati Negia,
Bholey Singh b,
Balaram Pani
 c and
Rakesh Kumar
 *a
*a
aBioorganic Laboratory, Department of Chemistry, University of Delhi, Delhi, 110007, India. E-mail: rakeshkp@email.com
bDepartment of Chemistry, Swami Shraddhanand College, University of Delhi, Delhi 110036, India
cDepartment of Chemistry, Bhaskaracharya College of Applied Sciences, University of Delhi, Delhi 110075, India
First published on 22nd May 2023
Abstract
A pyridine dicarboxylate Schiff-base DAS was synthesized for cascade colorimetric recognition of Ni2+ and PPi. The selectivity and sensitivity of chemosensor DAS was investigated through colorimetric and UV-vis studies in MeOH-PBS (5![[thin space (1/6-em)]](https://www.rsc.org/images/entities/char_2009.gif) :
:![[thin space (1/6-em)]](https://www.rsc.org/images/entities/char_2009.gif) 1, v/v, pH = 7.4). The chemosensor formed a 2
1, v/v, pH = 7.4). The chemosensor formed a 2![[thin space (1/6-em)]](https://www.rsc.org/images/entities/char_2009.gif) :
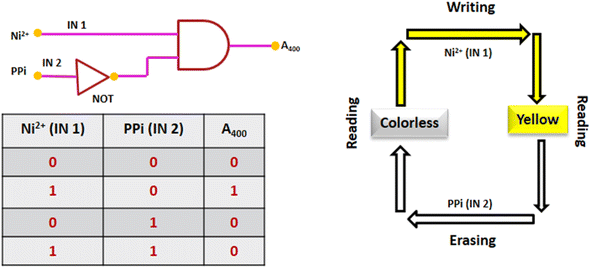
:![[thin space (1/6-em)]](https://www.rsc.org/images/entities/char_2009.gif) 1 complex with Ni2+ metal ions with a binding constant of Ka = 3.07 × 10³ M−2. Besides, a plausible sensing mechanism is confirmed by single crystal X-ray diffraction (SC-XRD), Job's plot and Benesi–Hildebrand plot (B–H plot) experiments. Furthermore, the DAS-Ni2+ ensemble formed ‘in situ’ was used to selectively recognise PPi. The limit of detection (LOD) of DAS for Ni2+ was found to be 0.14 μM and that of the DAS-Ni2+ ensemble for PPi was found to be 0.33 μM. Also, the potential of the chemosensor has been applied for solid state detection of Ni2+ as well as to mimic the ‘INHIBIT’ logic gate on the addition of Ni2+ ions and PPi.
1 complex with Ni2+ metal ions with a binding constant of Ka = 3.07 × 10³ M−2. Besides, a plausible sensing mechanism is confirmed by single crystal X-ray diffraction (SC-XRD), Job's plot and Benesi–Hildebrand plot (B–H plot) experiments. Furthermore, the DAS-Ni2+ ensemble formed ‘in situ’ was used to selectively recognise PPi. The limit of detection (LOD) of DAS for Ni2+ was found to be 0.14 μM and that of the DAS-Ni2+ ensemble for PPi was found to be 0.33 μM. Also, the potential of the chemosensor has been applied for solid state detection of Ni2+ as well as to mimic the ‘INHIBIT’ logic gate on the addition of Ni2+ ions and PPi.
1. Introduction
Among the various transition metals, Ni2+ is a vitally important trace metal which is involved in various industrial processes such as electroplating, the production of rechargeable batteries, catalysts in chemical reactions and electronic equipment. The nickel composites especially stainless steel, are used in different tools and appliances. Due to its toxic nature, Ni2+ compounds have been classified as carcinogenic to humans in group I by the International Agency for Research on Cancer.1 The vast usage of Ni2+ in industries impacts human health and also leads to environmental pollution. Apart from this, Ni2+ also plays a vital role as an essential micronutrient in plants and animals. However, its overexposure may cause serious ailments such as asthma, central nervous system disorders, kidney diseases, lung fibrosis and cancer.2 Therefore, selective monitoring of Ni2+ through effective methods has become an obligatory task for clinical as well as environmental analysis.3Different strategies have been reported for the recognition and quantification of Ni2+ in environment as well as biology. The majority of chemosensors are centered on potentiometric techniques,4 atomic absorption spectroscopy5 and liquid chromatography.6 However these methods show more time consumption, tedious sample preparation and high maintenance.7 Even though these methods show accuracy, they show inconvenience for field analysis. Alternatively, fluorescence and colorimetric chemosensors provide easy sample preparation, high sensitivity and selectivity and are also cost effective.8,9 As compared to fluorescent chemosensors which require UV-vis as well as fluorescence spectrophotometer,10–12 colorimetric chemosensors require only UV-vis spectrophotometric. Additionally, colorimetric chemosensors are most convenient as they provide naked-eye detection of the analyte via colour changes. Although, many researchers have focused on the evolution of fluorescent and colorimetric chemosensors for Ni2+; however most of them show interference with other metal ions.13,14 There are very few reports for the selective recognition of Ni2+ that have been published in literature.15–18 A number of Schiff bases as colorimetric sensors have been reported for the recognition of different analytes of biological and environmental importance.19,20 The importance of anionic species in biology, environment and medicine has increased the interest of researchers in developing organic chemo sensors for their recognition.21–23 Among different anions, pyrophosphate (PPi or P2O74−) plays an elemental role in biological processes as it is a product of ATP hydrolysis under cellular conditions.24 PPi is involved in certain processes such as protein synthesis, gene transcription and cellular signal transduction.25 The concentration of PPi provides critical information on processes such as DNA replication and DNA sequencing.26 The alterations in the content of PPi may lead to different diseases.27 In recent years, the recognition of PPi has become crucial in cancer research.28 One of the most successful strategies for the designing chemosensors for PPi is the incorporation of metal-complexes in the system. This is because of the fact that there is a strong binding between the metal ion and PPi allowing the recognition of PPi.29 In these “metal-containing chemosensing ensembles” different transition metal ions such as copper,30 zinc,31,32 aluminium33 and ferric34,35 have been used in literature for the recognition of PPi. However, so far, to our knowledge, such systems with nickel to detect PPi, have not been reported in literature. Nowadays, chemosensors have been interestingly used in the fields of molecular logic gates, information storage devices and molecular keypad locks. They play an important role in molecular computers by translating chemically ciphered information (input) to optical signals (output). The cascade recognition ability of DAS has facilitated its use in molecular logic gates based on its colorimetric response.
Herein, we have synthesized a novel pyridine-dicarboxylate based hydrazone Schiff base DAS using simple convenient routes, which acted as a potential colorimetric chemosensor for selective recognition of Ni2+ and PPi via “naked-eye” colour changes.
2. Experimental
2.1. Materials and methods
Ethyl acetoacetate, 2-hydroxybenzohydrazide and selenium dioxide were obtained from Spectrochem Pvt. Ltd and were used without any further purifications. For the purpose of synthesis and photophysical studies some reagents, metal salts and phosphates were acquired from Sigma-Aldrich and Sisco Research Laboratories. The solvents used for absorption studies were of HPLC grade. The stock solutions of metal salts and phosphates were prepared in double distilled water. The melting point of compounds were recorded on Buchi M-560 melting point apparatus. 1H NMR and 13C NMR spectra were obtained on a JNM-EXCP 400 (JEOL, USA) spectrometer operating at 400 and 100 MHz, respectively. The FT-IR spectra were obtained on PerkinElmer 2000 Fourier Transform Infrared spectrometer. A 1 cm quartz cuvette was used on Carey Series UV-vis spectrophotometer to record the absorption data.![[thin space (1/6-em)]](https://www.rsc.org/images/entities/char_2009.gif) :
:![[thin space (1/6-em)]](https://www.rsc.org/images/entities/char_2009.gif) 3, v/v) in 59% and 41% yield. The structure of compound 2 was further confirmed by 1H, 13C NMR, IR and HRMS analysis.
3, v/v) in 59% and 41% yield. The structure of compound 2 was further confirmed by 1H, 13C NMR, IR and HRMS analysis.
1H NMR (400 MHz, DMSO-d6): δ ppm 9.95 (s, 1H), 8.30 (d, J = 8.8 Hz, 2H), 7.47 (d, J = 8.8 Hz, 2H), 4.01 (m, J = 7.1, 2.2 Hz, 4H), 2.63 (s, 3H), 0.92 (t, J = 7.1 Hz, 3H), 0.85 (t, J = 7.1 Hz, 3H). 13C NMR (100 MHz, DMSO-d6): δ ppm 192.7, 166.0, 165.4, 157.2, 147.6, 144.7, 140.7, 130.4, 123.5, 62.5, 62.2, 22.5, 13.5. IR (KBr, cm−1): 2895, 2860 and 1720. Melting point: 130–132 °C. HRMS (m/z): Calculated for C19H18N2O7 387.1148, obtained 387.1187.
1H NMR (400 MHz, DMSO-d6): δ ppm 12.03 (s, 1H), 11.41 (s, 1H), 8.45 (s, 1H), 8.30 (d, J = 8.5 Hz, 2H), 7.77 (s, 1H), 7.49 (s, 2H), 7.43–7.37 (s, 1H), 6.96–6.92 (m, 2H), 4.11 (q, J = 7.0 Hz, 2H), 3.98 (q, J = 7.1 Hz, 2H), 2.57 (s, 3H), 0.91 (t, J = 7.0 Hz, 3H), 0.84 (t, J = 7.1 Hz, 3H).
13C NMR (100 MHz, DMSO-d6): δ ppm 166.4, 156.0, 149.6, 148.1, 144.5, 141.9, 130.3, 129.5, 128.2, 123.7, 119.5, 117.6, 62.1, 23.0, 13.8. IR (KBr, cm−1): 3320, 2976, 1726, 1601 and 1210. Melting point: 147–149 °C. HRMS (m/z): Calculated for C26H24N4O8 521.1628, obtained 521.1621.
![[thin space (1/6-em)]](https://www.rsc.org/images/entities/char_2009.gif) :
:![[thin space (1/6-em)]](https://www.rsc.org/images/entities/char_2009.gif) 1, v/v, pH = 7.4). The metal and phosphate binding studies were carried out by adding 6 μL of stock solutions of metal ions or phosphates to 20 μM solution in 2.94 mL solution DAS or DAS-Ni2+ ensemble, respectively, in MeOH-PBS (5
1, v/v, pH = 7.4). The metal and phosphate binding studies were carried out by adding 6 μL of stock solutions of metal ions or phosphates to 20 μM solution in 2.94 mL solution DAS or DAS-Ni2+ ensemble, respectively, in MeOH-PBS (5![[thin space (1/6-em)]](https://www.rsc.org/images/entities/char_2009.gif) :
:![[thin space (1/6-em)]](https://www.rsc.org/images/entities/char_2009.gif) 1, v/v, pH = 7.4). The competitive binding studies were performed by adding 3 μL of Ni2+ or PPi to 2.94 mL of DAS or DAS-Ni2+ ensemble, respectively, in cuvette, followed by the addition of 3 μL of other metal ion or phosphate solutions.
1, v/v, pH = 7.4). The competitive binding studies were performed by adding 3 μL of Ni2+ or PPi to 2.94 mL of DAS or DAS-Ni2+ ensemble, respectively, in cuvette, followed by the addition of 3 μL of other metal ion or phosphate solutions.
 | (1) |
In order to obtain the binding stoichiometry, stock solutions of DAS and Ni2+ with concentration 20 μM were prepared in MeOH-PBS (5![[thin space (1/6-em)]](https://www.rsc.org/images/entities/char_2009.gif) :
:![[thin space (1/6-em)]](https://www.rsc.org/images/entities/char_2009.gif) 1 v/v, 10 mM, pH = 7.4) and deionized water, respectively. Further, titrations were carried out by adding 0.3–3 mL of DAS and 3–0.3 mL of Ni2+ ion in the quartz cuvette to make the final volume to 3 mL and recorded the absorption spectra of the solution. A graph was plotted between mole fraction of Ni2+(XNi2+) and (A0 − A) × XNi2+ to obtain job's plot.37
1 v/v, 10 mM, pH = 7.4) and deionized water, respectively. Further, titrations were carried out by adding 0.3–3 mL of DAS and 3–0.3 mL of Ni2+ ion in the quartz cuvette to make the final volume to 3 mL and recorded the absorption spectra of the solution. A graph was plotted between mole fraction of Ni2+(XNi2+) and (A0 − A) × XNi2+ to obtain job's plot.37
The limit of detection (LOD) of DAS for Ni2+ was evaluated by using following eqn (2).38
 | (2) |
The standard deviation (σ) was calculated by taking ten replicate absorption measurements while binding constant Ka was calculated from the slope of B–H plot.
3. Results and discussion
3.1. Synthesis
The chemosensor DAS was synthesized by mixing ethanolic solutions of diethyl 2-formyl-6-methyl-4-(4-nitrophenyl)pyridine-3,5-dicarboxylate (2) and 2-hydroxybenzohydrazide (4) and then added a 1 mL of acetic acid to the reaction mixture. After the addition, reaction mixture was refluxed for 6 hours to obtain final product DAS in 89% yield. The synthesis of compound 2, precursor of the final compound, that was obtained by the oxidation of diethyl 2,6-dimethyl-4-(4-nitrophenyl)-1,4-dihydropyridine-3,5-dicarboxylate (1) using the oxidizing agent SeO2 in 1,4-dioxane. The oxidation lead to the formation of two products i.e. diethyl 2-formyl-6-methyl-4-(4-nitrophenyl) pyridine-3,5-dicarboxylate (2, major) and diethyl 2,6-dimethyl-4-(4-nitrophenyl) pyridine-3,5-dicarboxylate (3, minor) (Scheme 1) which were separated by column chromatography. All the synthesized compounds were confirmed by 1H, 13C NMR, IR and HRMS Data.3.2. Colorimetric detection of Ni2+
The colorimetric sensing of the ligand DAS was carried out by addition of various metal ions to solution of DAS in MeOH-PBS (5![[thin space (1/6-em)]](https://www.rsc.org/images/entities/char_2009.gif) :
:![[thin space (1/6-em)]](https://www.rsc.org/images/entities/char_2009.gif) 1 v/v, 10 mM, pH = 7.4). Only on the addition of Ni2+, an instant eye-catching change from colorless to yellow was observed and on addition of other metal ions there is no visible color changes were observed (Fig. 1).
1 v/v, 10 mM, pH = 7.4). Only on the addition of Ni2+, an instant eye-catching change from colorless to yellow was observed and on addition of other metal ions there is no visible color changes were observed (Fig. 1).
 | ||
| Fig. 1 The visible changes in color of DAS (20 μM) after addition of 1 equiv. of various metal salts. | ||
3.3. UV-vis studies
The UV-vis titration studies was performed to get insight about the sensing ability of chemosensor DAS towards various metal ions. The UV-vis absorption spectrum of DAS (20 μM) were recorded in MeOH-PBS (5![[thin space (1/6-em)]](https://www.rsc.org/images/entities/char_2009.gif) :
:![[thin space (1/6-em)]](https://www.rsc.org/images/entities/char_2009.gif) 1 v/v, 10 mM, pH = 7.4) which unveiled a broad band at 320 nm (Fig. 2a). which might be attributed to the π–π* or n–π* charge transfer within the ligand. The cation sensing of chemosensor DAS was carried out by addition of 1 equiv. salts of metal ions into stock solution of DAS, no notable changes were perceived in its absorption spectra. However, on addition of Ni2+ to the solution of DAS, a new prominent band was observed in the following spectra as shown in (Fig. 2b). It could be seen in (Fig. 2c) that in the presence of Ni2+, the intensity of the CT band of DAS that was centered at 320 nm disappeared and new bands at 270 and 400 nm appeared. The isobestic points at 290 and 345 nm suggested the formation of a stable complex between Ni2+ and DAS.
1 v/v, 10 mM, pH = 7.4) which unveiled a broad band at 320 nm (Fig. 2a). which might be attributed to the π–π* or n–π* charge transfer within the ligand. The cation sensing of chemosensor DAS was carried out by addition of 1 equiv. salts of metal ions into stock solution of DAS, no notable changes were perceived in its absorption spectra. However, on addition of Ni2+ to the solution of DAS, a new prominent band was observed in the following spectra as shown in (Fig. 2b). It could be seen in (Fig. 2c) that in the presence of Ni2+, the intensity of the CT band of DAS that was centered at 320 nm disappeared and new bands at 270 and 400 nm appeared. The isobestic points at 290 and 345 nm suggested the formation of a stable complex between Ni2+ and DAS.
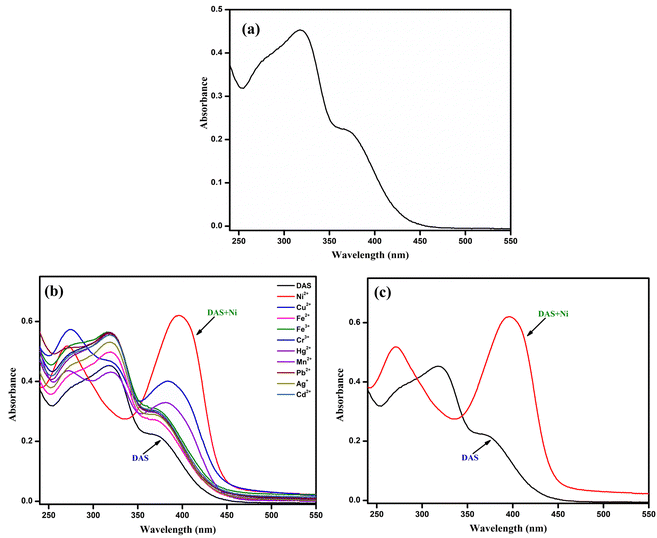 | ||
| Fig. 2 (a) The absorption spectrum of DAS (20 μM). (b) UV-vis Spectral changes of DAS on addition of 1 equiv. of various metal ions. (c) Absorption spectra of DAS and DAS-Ni2+. | ||
3.4. Selectivity study
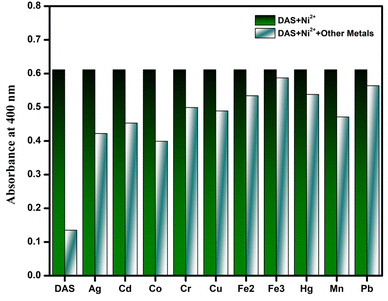
It is imperative to examine the selectivity of chemosensor because having high selectivity is one of the essential requirement of good chemosensor. Therefore, to evaluate the selectivity of DAS, interference experiment was carried out by adding different metal ions into the solution of Ni2+ ion (Fig. 3). A similar patterns was observed in the absorption studies of DAS having Ni2+ in the presence of other metal ions which indicated that recognition of Ni2+ ion is not affected by other coexisting metal ions. On the basis of response towards the intervening samples, the chemosensor, DAS showed high selectivity for Ni2+ even in the presence of other metals under same conditions.3.5. Binding stoichiometry analysis of DAS towards Ni2+
To understand more about the interaction between DAS and Ni2+, titration studies were performed in MeOH-PBS (5![[thin space (1/6-em)]](https://www.rsc.org/images/entities/char_2009.gif) :
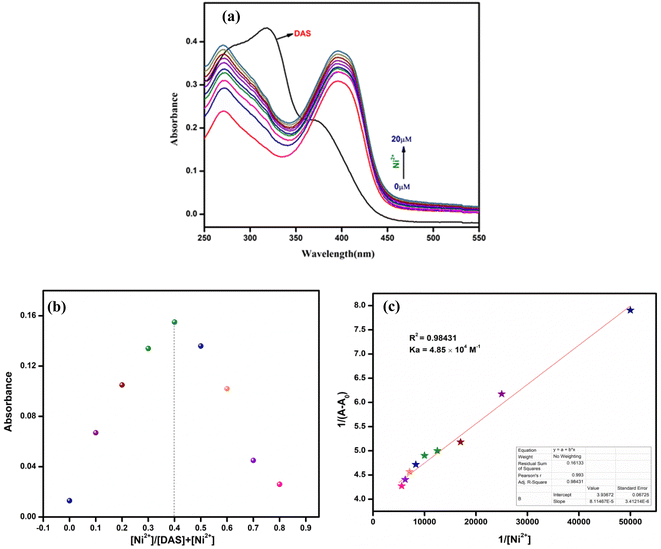
:![[thin space (1/6-em)]](https://www.rsc.org/images/entities/char_2009.gif) 1 v/v, 10 mM, pH = 7.4). It could be observed that on sequential addition of Ni2+ to the solution of DAS the absorption peak at 320 nm disappeared while the intensity of new peaks at 270 nm and 400 nm gradually increased (Fig. 4a). Furthermore, the binding constant (Ka) and binding stoichiometry for complex formation were determined by applying B–H and Job's plot, respectively. The Job's plot (Fig. 4b); revealed that the maximum was achieved when the molar ratio of the DAS and Ni2+ were at 0.4. This indicated 2
1 v/v, 10 mM, pH = 7.4). It could be observed that on sequential addition of Ni2+ to the solution of DAS the absorption peak at 320 nm disappeared while the intensity of new peaks at 270 nm and 400 nm gradually increased (Fig. 4a). Furthermore, the binding constant (Ka) and binding stoichiometry for complex formation were determined by applying B–H and Job's plot, respectively. The Job's plot (Fig. 4b); revealed that the maximum was achieved when the molar ratio of the DAS and Ni2+ were at 0.4. This indicated 2![[thin space (1/6-em)]](https://www.rsc.org/images/entities/char_2009.gif) :
:![[thin space (1/6-em)]](https://www.rsc.org/images/entities/char_2009.gif) 1 binding stoichiometry between DAS and Ni2+.
1 binding stoichiometry between DAS and Ni2+.
The B–H plot of 1/[Ni2+] vs. 1/[A − A0] showed linearity with R2 = 0.98448, which also confirmed 2![[thin space (1/6-em)]](https://www.rsc.org/images/entities/char_2009.gif) :
:![[thin space (1/6-em)]](https://www.rsc.org/images/entities/char_2009.gif) 1 binding stoichiometry of the complex (Fig. 4c). The binding/association constant of DAS for Ni2+ was found out to be 3.07 × 10³ M−2.
1 binding stoichiometry of the complex (Fig. 4c). The binding/association constant of DAS for Ni2+ was found out to be 3.07 × 10³ M−2.
3.6. Limit of detection & time response
The limit of detection of chemosensor DAS was calculated to be 0.14 μM, implicating that the chemosensor could be used for colorimetric recognition of Ni2+ even at lower concentrations. When 1 equiv. of Ni2+ was added into the solution of DAS, the absorbance of DAS at 400 nm changed and remained constant afterwards (Fig. 5). The swift sensing of DAS made it appropriate for real time detection of Ni2+.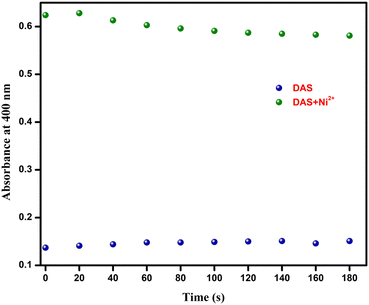 | ||
Fig. 5 Absorption response of DAS (20 μM, MeOH-PBS, pH = 7.4, 5![[thin space (1/6-em)]](https://www.rsc.org/images/entities/char_2009.gif) : :![[thin space (1/6-em)]](https://www.rsc.org/images/entities/char_2009.gif) 1, v/v) at the wavelength 400 nm in the presence of Ni2+ (1 equiv.) with respect to time. 1, v/v) at the wavelength 400 nm in the presence of Ni2+ (1 equiv.) with respect to time. | ||
3.7. Effect of pH
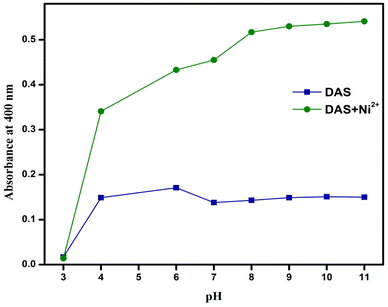
The colorimetric response of DAS in the absence and presence of Ni2+ was studied as a function of pH. The pH was adjusted by the addition of 1 M hydrochloric acid (HCl) and sodium hydroxide (NaOH) solutions. As seen in the figure, no detection of Ni2+ observed at pH = 3, probably due to protonation of DAS. As the pH increased, the sensing ability of DAS for Ni2+ increased and then became almost constant after pH = 8. Therefore, it could be inferred that the chemosensor was suitable for detection of Ni2+ under conditions of physiological pH (Fig. 6).3.8. SC-XRD analysis of DAS and DAS-Ni2+
Single crystal structures of compound DAS and metal complex DAS-Ni2+ were determined by SC-XRD studies which disclosed that crystal structure of metal complex include Ni2+ atom coordinated with two nitrogen and one oxygen atom supported by aromatic ring in the ratio 2![[thin space (1/6-em)]](https://www.rsc.org/images/entities/char_2009.gif) :
:![[thin space (1/6-em)]](https://www.rsc.org/images/entities/char_2009.gif) 1 and also confirmed through the Job's plot method while in the compound these atoms are free which is clearly shown in (Fig. 7). In the metal complex, pyridine ring and another N∩O chelating moiety binds to the metal in a square planar geometry which is confirmed by the bond angles analysis (∠N17–Ni2–O33, O42 are 77.8(4), 89.2(4) & N20–Ni2–N21, O33, O42 are 77.2(4), 89.4(3) and 154.7(4) and N21–Ni2–O33, O42 are 95.0(4), 77.6(4) and O33–Ni2–O42 is 90.5(3) respectively (Fig. 8). The Ni atom is bridged via N and O atoms offering (N∩O) bis-chelating units and display conventional structural parameters. The Ni2–N20, N15 bond distances lie in 2.17–2.20 Å and Ni2–N17, N21 in 1.97–1.98 Å range whereas Ni2–O33 bond length lie close to that of Ni2–O42 (2.067–2.077 Å). These findings support that nickel ion coordinated with [N\O] bis-chelating units (Table 1).
1 and also confirmed through the Job's plot method while in the compound these atoms are free which is clearly shown in (Fig. 7). In the metal complex, pyridine ring and another N∩O chelating moiety binds to the metal in a square planar geometry which is confirmed by the bond angles analysis (∠N17–Ni2–O33, O42 are 77.8(4), 89.2(4) & N20–Ni2–N21, O33, O42 are 77.2(4), 89.4(3) and 154.7(4) and N21–Ni2–O33, O42 are 95.0(4), 77.6(4) and O33–Ni2–O42 is 90.5(3) respectively (Fig. 8). The Ni atom is bridged via N and O atoms offering (N∩O) bis-chelating units and display conventional structural parameters. The Ni2–N20, N15 bond distances lie in 2.17–2.20 Å and Ni2–N17, N21 in 1.97–1.98 Å range whereas Ni2–O33 bond length lie close to that of Ni2–O42 (2.067–2.077 Å). These findings support that nickel ion coordinated with [N\O] bis-chelating units (Table 1).
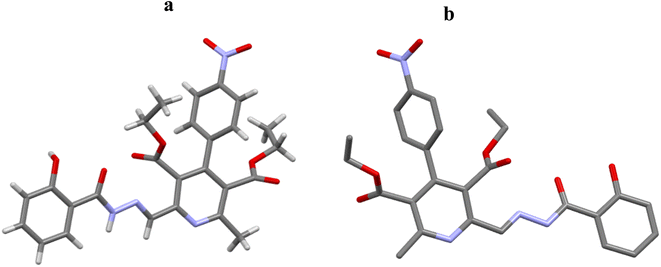 | ||
| Fig. 7 Molecular structures (a) and (b) of DAS. For clarity hydrogen atoms are omitted in structure b. gray = C, blue = N, red = O. | ||
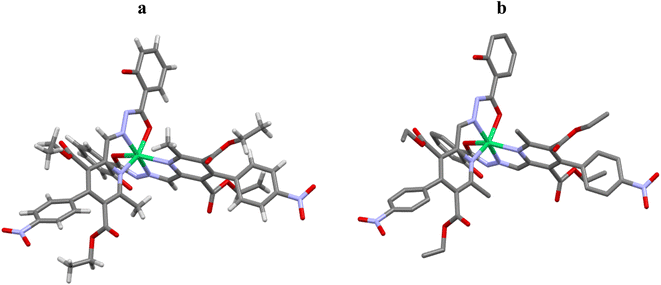 | ||
| Fig. 8 Molecular structures (a) and (b) of DAS-Ni2+. For clarity hydrogen atoms are omitted in structure b. green = Ni, gray = C, blue = N, red = O. | ||
| Atom(s) | Bond angle (°) | Atom(s) | Bond length (Å) |
|---|---|---|---|
| ∠N17–Ni2–O33 | 77.8(4) | Ni2–N20 | 2.17 |
| ∠N17–Ni2–O42 | 89.2(4) | Ni2–N15 | 2.20 |
| ∠N20–Ni2–N21 | 77.2(4) | Ni2–N17 | 1.97 |
| ∠N20–Ni2–O33 | 89.4(3) | Ni2–N21 | 1.98 |
| ∠N20–Ni2–O42 | 154.7(4) | Ni2–O33 | 2.067 |
| ∠N21–Ni2–O33 | 95.0(4) | Ni2–O42 | 2.077 |
| ∠N21–Ni2–O42 | 77.6(4) | ||
| ∠O33–Ni2–O42 | 90.5(3) |
3.9. Phosphate sensing by DAS-Ni2+ ensemble
Sodium salts of different phosphate such as AMP, ADP, ATP, HPO4, H2PO4 and PPi were added to solution of DAS-Ni2+ in MeOH-PBS (5![[thin space (1/6-em)]](https://www.rsc.org/images/entities/char_2009.gif) :
:![[thin space (1/6-em)]](https://www.rsc.org/images/entities/char_2009.gif) 1, v/v, 10 mM, pH = 7.4). Addition of PPi salt lead to immediate bleaching of the solution as the color of DAS (Fig. 9) and a notable change in the absorption spectra of DAS-Ni2+ (Fig. 10). However, no such variations were noticed after the addition of other phosphates.
1, v/v, 10 mM, pH = 7.4). Addition of PPi salt lead to immediate bleaching of the solution as the color of DAS (Fig. 9) and a notable change in the absorption spectra of DAS-Ni2+ (Fig. 10). However, no such variations were noticed after the addition of other phosphates.
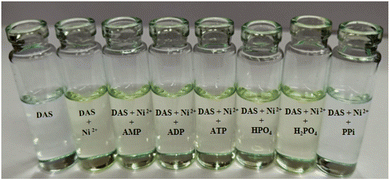 | ||
| Fig. 9 Colorimetric changes observed in DAS-Ni2+ (20 μM) upon addition of 1 equiv. of different phosphates. | ||
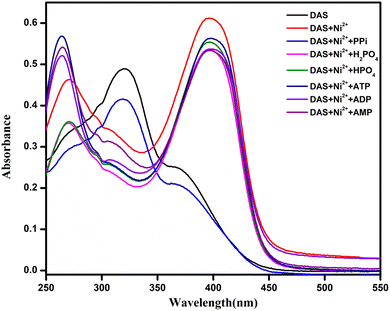 | ||
| Fig. 10 UV-vis absorbance spectral changes in DAS-Ni2+ with addition of 1 equiv. of different phosphates. | ||
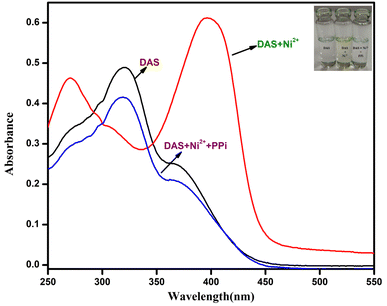
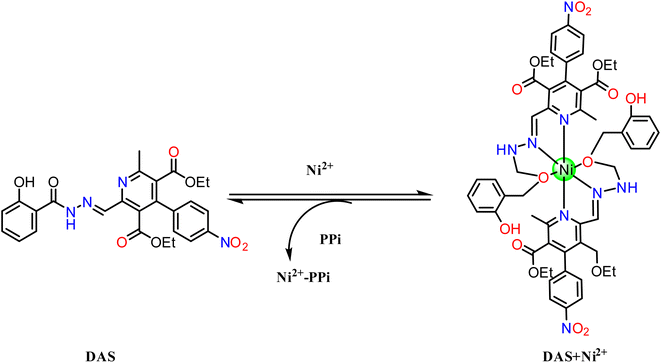
It could be perceived in (Fig. 11) that in the existence of PPi, the intensity of the CT band of DAS-Ni2+ that was centered at 270 and 400 nm prominently disappeared and a new band at 320 nm appeared. This absorption spectrum obtained was the same as that of DAS in the absence of Ni2+. The results also suggested the reversibility and reproducibility of the chemosensor using PPi by the following mechanism (Scheme 3).
To evaluate the selectivity of DAS-Ni2+ towards PPi over other phosphates, competitive binding studies were performed in the same solvent system. It was observed that no considerable changes in the absorbance intensity at 400 nm were observed on the addition of other phosphates, as shown in (Fig. 12).
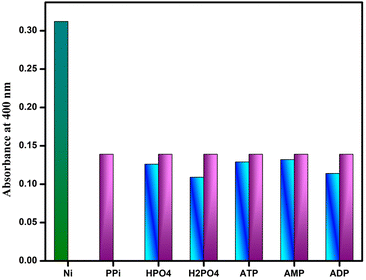 | ||
| Fig. 12 Absorbance intensity of DAS-Ni2+ ensemble and PPi in the presence of other competitive phosphates. | ||
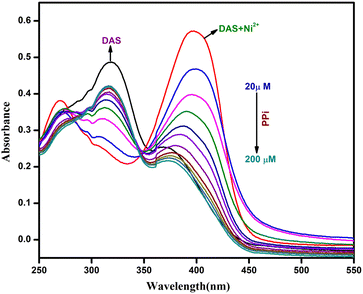
Further, we also calculated the binding constant (Ka) and the limit of detection of DAS-Ni2+ ensemble with PPi. It could be seen in (Fig. 13) that the successive addition of PPi to DAS-Ni2+ ensemble leads to a subsequent decrease and eventually the disappearance of bands at 270 and 400 nm. In addition to this, the absorption intensity at 320 nm started to increase.
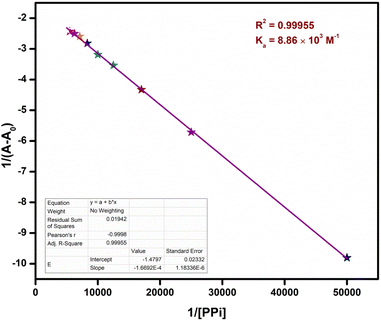
The B–H plot obtained by plotting graph between 1/[PPi] vs. 1/(A − A0) procured the value to binding constant to be 8.86 × 10³ M−1 (Fig. 14).
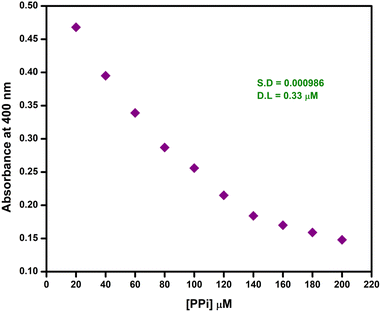
The detection limit (Fig. 15) suggested that the ensemble had the ability to sense PPi even in concentrations as much as 0.33 μM. This detection limit was even better than that of other chemosensors reported for PPi.39
3.10. Practical application of DAS
4. Conclusions
In conclusion, a novel pyridine-dicarboxylate based hydrazone Schiff base (DAS) has been successfully synthesized which acted as a colorimetric chemosensor for recognition of Ni2+ ion and characterized via spectroscopic techniques. DAS exhibit fast and selective detection of Ni2+ even in the presence of other coexisting metal ions. Ni2+ formed 2![[thin space (1/6-em)]](https://www.rsc.org/images/entities/char_2009.gif) :
:![[thin space (1/6-em)]](https://www.rsc.org/images/entities/char_2009.gif) 1 complex with DAS with binding constant Ka = 3.07 × 10³ M−2, as apparent from Job's plot and Benesi–Hildebrand plot (B–H plot). Besides, single crystal X-ray diffraction (SC-XRD) also validated the formation of a 2
1 complex with DAS with binding constant Ka = 3.07 × 10³ M−2, as apparent from Job's plot and Benesi–Hildebrand plot (B–H plot). Besides, single crystal X-ray diffraction (SC-XRD) also validated the formation of a 2![[thin space (1/6-em)]](https://www.rsc.org/images/entities/char_2009.gif) :
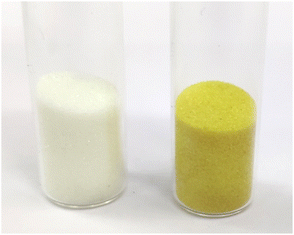
:![[thin space (1/6-em)]](https://www.rsc.org/images/entities/char_2009.gif) 1 complex between DAS and Ni2+. The detection limit of DAS for Ni2+ has been found out to be 0.14 μM. DAS-Ni2+ ensemble formed “in situ” was found to show selective detection towards PPi with binding constant Ka = 8.86 × 10³ M−1 and detection limit of 0.33 μM. Moreover, DAS was demonstrated to mimic ‘INHIBIT’ logic gate on addition of Ni2+ and PPi. The chemosensor also showed a potential to detect Ni2+ in solid state. Since, colorimetric sensors for cascade sensing of Ni2+ and PPi have not been reported so far, DAS could be proved as a significant addition to the chemosensors earlier reported for Ni2+ or PPi.
1 complex between DAS and Ni2+. The detection limit of DAS for Ni2+ has been found out to be 0.14 μM. DAS-Ni2+ ensemble formed “in situ” was found to show selective detection towards PPi with binding constant Ka = 8.86 × 10³ M−1 and detection limit of 0.33 μM. Moreover, DAS was demonstrated to mimic ‘INHIBIT’ logic gate on addition of Ni2+ and PPi. The chemosensor also showed a potential to detect Ni2+ in solid state. Since, colorimetric sensors for cascade sensing of Ni2+ and PPi have not been reported so far, DAS could be proved as a significant addition to the chemosensors earlier reported for Ni2+ or PPi.
Conflicts of interest
The authors have no conflict of interest to declare.Acknowledgements
The authors R. B, S. N and R. K thanks to Council of Scientific & Industrial Research (CSIR), University Grants Commission (UGC) and Institute of Eminence (IoE), University of Delhi for financial support and University Science Instrumentation Centre (USIC), University of Delhi for providing scientific support and characterisation facilities for carrying out this research work.References
- E. Denkhaus and K. Salnikow, Crit. Rev. Oncol. Hematol., 2002, 42, 35–56 CrossRef CAS PubMed.
- K. S. Kasprzak, W. Bal and A. A. Karaczyn, J. Environ. Monit., 2003, 5, 183–187 RSC.
- L. Feng, Y. Zhang, L. Wen, L. Chen, Z. Shen and Y. Guan, Analyst, 2011, 136, 4197–4203 RSC.
- V. K. Gupta, R. N. Goyal, S. Agarwal, P. Kumar and N. Bachheti, Talanta, 2007, 71, 795–800 CrossRef CAS PubMed.
- Z. Sun, P. Liang, Q. Ding and J. Cao, J. Hazard. Mater., 2006, 137, 943–946 CrossRef CAS PubMed.
- A. M. Bond and G. G. Wallace, Anal. Chem., 1983, 55, 718–723 CrossRef CAS.
- M. K. Amini, T. Momeni-Isfahani, J. H. Khorasani and M. Pourhossein, Talanta, 2004, 63, 713–720 CrossRef CAS PubMed.
- F. Wang, J. H. Moon, R. Nandhakumar, B. Kang, D. Kim, K. M. Kim, J. Y. Lee and J. Yoon, Chem. Commun., 2013, 49, 7228–7230 RSC.
- K. Velmurugan, A. Raman, D. Don, L. Tang, S. Easwaramoorthi and R. Nandhakumar, RSC Adv., 2015, 5, 44463–44469 RSC.
- W.-D. Li, Y. Huang, S.-Z. Li and W.-K. Dong, J. Mol. Struct., 2023, 1284, 135360 CrossRef CAS.
- L.-L. Man, L. Tong, L.-L. Gan, R.-Y. Li, H.-R. Mu and W.-K. Dong, Phosphorus, Sulfur Silicon Relat. Elem., 2022, 197, 1263–1272 CrossRef CAS.
- L.-L. Man, S.-Z. Li, J. Zhang, Y. Zhang and W.-K. Dong, J. Photochem. Photobiol., A, 2023, 437, 114433 CrossRef CAS.
- I. Grabchev, J.-M. Chovelon and X. Qian, New J. Chem., 2003, 27, 337–340 RSC.
- V. K. Gupta, A. K. Singh, L. K. Kumawat and N. Mergu, Sens. Actuators, B, 2016, 222, 468–482 CrossRef CAS.
- D. Peralta-Domínguez, M. Rodríguez, G. Ramos-Ortíz, J. L. Maldonado, M. A. Meneses-Nava, O. Barbosa-García, R. Santillan and N. Farfán, Sens. Actuators, B, 2015, 207, 511–517 CrossRef.
- S. Goswami, S. Chakraborty, S. Paul, S. Halder and A. C. Maity, Tetrahedron Lett., 2013, 54, 5075–5077 CrossRef CAS.
- J. Jiang, C. Gou, J. Luo, C. Yi and X. Liu, Inorg. Chem. Commun., 2012, 15, 12–15 CrossRef CAS.
- H. Li, S.-J. Zhang, C.-L. Gong, Y.-F. Li, Y. Liang, Z.-G. Qi and S. Chen, Analyst, 2013, 138, 7090–7093 RSC.
- D. Udhayakumari and V. Inbaraj, J. Fluoresc., 2020, 30, 1203–1223 CrossRef CAS PubMed.
- A. Kumar, S. Mondal, K. S. Kayshap, S. K. Hira, P. P. Manna, W. Dehaen and S. Dey, New J. Chem., 2018, 42, 10983–10988 RSC.
- R. Kumar, H. Jain, P. Gahlyan, A. Joshi and C. N. Ramachandran, New J. Chem., 2018, 42, 8567–8576 RSC.
- Y. Zhou, J. F. Zhang and J. Yoon, Chem. Rev., 2014, 114, 5511–5571 CrossRef CAS PubMed.
- A. Gupta, S. Garg and H. Singh, Anal. Methods, 2020, 12, 5022–5045 RSC.
- Y. Li, X. Dong, C. Zhong, Z. Liu and J. Qin, Sens. Actuators, B, 2013, 183, 124–128 CrossRef CAS.
- H. J. Kim, J. H. Lee and J.-I. Hong, Tetrahedron Lett., 2011, 52, 4944–4946 CrossRef CAS.
- S. K. Kim, D. H. Lee, J.-I. Hong and J. Yoon, Acc. Chem. Res., 2009, 42, 23–31 CrossRef CAS PubMed.
- A. Gogoi, S. Mukherjee, A. Ramesh and G. Das, RSC Adv., 2015, 5, 63634–63640 RSC.
- S. Xu, M. He, H. Yu, X. Cai, X. Tan, B. Lu and B. Shu, Anal. Biochem., 2001, 299, 188–193 CrossRef CAS PubMed.
- H. N. Lee, K. M. K. Swamy, S. K. Kim, J.-Y. Kwon, Y. Kim, S.-J. Kim, Y. J. Yoon and J. Yoon, Org. Lett., 2007, 9, 243–246 CrossRef CAS PubMed.
- X. Meng, D. Cao, Z. Hu, X. Han, Z. Li, D. Liang and W. Ma, Tetrahedron Lett., 2018, 59, 4299–4304 CrossRef CAS.
- J. Zhang, M. She, J. Li, C. Wang, S. Wang, P. Liu, S. Zhang and J. Li, Sens. Actuators, B, 2018, 270, 362–370 CrossRef CAS.
- Z. M. Dong, W. Wang, L. Y. Qin, J. Feng, J. N. Wang and Y. Wang, J. Photochem. Photobiol., A, 2017, 335, 1–9 CrossRef CAS.
- S. Goswami, A. Manna, S. Paul, K. Aich, A. K. Das and S. Chakraborty, Dalton Trans., 2013, 42, 8078–8085 RSC.
- W. Wang, J. Wei, H. Liu, Q. Liu and Y. Gao, Tetrahedron Lett., 2017, 58, 1025–1029 CrossRef CAS.
- W. Wang, M. Wu, H. Liu, Q. Liu, Y. Gao and B. Zhao, Tetrahedron Lett., 2019, 60, 1631–1635 CrossRef CAS.
- R. Bawa, N. Deswal, S. Negi, M. Dalela, A. Kumar and R. Kumar, RSC Adv., 2022, 12, 11942–11952 RSC.
- R. Kumar, R. Bawa, P. Gahlyan, M. Dalela, K. Jindal, P. K. Jha, M. Tomar and V. Gupta, Dyes Pigm., 2019, 161, 162–171 CrossRef CAS.
- A. Kumar, B. Mohan, K. Modi, M. A. U. Din and S. Kumar, J. Mol. Struct., 2022, 1268, 133609 CrossRef CAS.
- Y. Xing, Z. Liu, Y. Xu, H. Wang, L. Li, B. Li, X. Yang, M. Pei and G. Zhang, New J. Chem., 2020, 44, 13875–13881 RSC.
- H. Jain, N. Deswal, A. Joshi, C. N. Ramachandran and R. Kumar, Anal. Methods, 2019, 11, 3230–3243 RSC.
Footnote |
| † Electronic supplementary information (ESI) available. CCDC 2206485 and 2206486. For ESI and crystallographic data in CIF or other electronic format see DOI: https://doi.org/10.1039/d3ra02021e |
| This journal is © The Royal Society of Chemistry 2023 |


