DOI:
10.1039/D3RA01424J
(Paper)
RSC Adv., 2023,
13, 12175-12183
Effects of various parameters on solution-mediated phase transformation of calcium D-gluconate: an approach to obtain pure metastable monohydrate†
Received
3rd March 2023
, Accepted 11th April 2023
First published on 19th April 2023
Abstract
The high risk of solution-mediated phase transformation (SMPT) from the metastable monohydrate to stable Form I makes it difficult to produce pure metastable monohydrate of calcium D-gluconate. In this work, we explored the effect of various operating parameters on the SMPT of calcium D-gluconate in water and proposed an effective approach to obtain the desired monohydrate. First, the two forms of calcium D-gluconate were characterized and compared using powder X-ray diffraction (PXRD), thermal analysis, and Raman spectroscopy. The lower solubility of Form I in water illustrates its higher thermodynamic stability than monohydrate when the temperature is higher than 292 K. Afterward, the SMPT of calcium D-gluconate from monohydrate to Form I was investigated in water using in situ Raman spectroscopy combined with scanning electron microscopy and PXRD. Results showed that the nucleation and growth of Form I was the rate-limiting step in the SMPT from monohydrate to Form I. The phase transformation from monohydrate to Form I was delayed to produce pure monohydrate by decreasing temperature and agitation rate, reducing the amount of solid loading, and increasing the particle size of solid loading. Furthermore, the transformation kinetics were studied by the JMA model to explore how temperature influences the SMPT process. This study enriches the study of the calcium D-gluconate SMPT mechanism, and also provides guidance for obtaining high-quality injection-grade calcium gluconate monohydrate.
Introduction
Polymorphism and hydrates of active pharmaceutical ingredients (APIs) are common solid forms in the pharmaceutical industry.1,2 Different solid forms of APIs have many differences in physicochemical properties, such as stability, solubility, bioavailability, and efficacy.3–8 Therefore, it is of great significance to obtain the desired solid form with good performance. Generally, only one form is stable in a given situation, and when different forms of API are present simultaneously in a suitable solvent, the other metastable forms can transform into the stable one via solution-mediated phase transformation (SMPT) within a certain temperature range.9 However, the metastable form of APIs may present better performance, like high solubility, high dissolution rate, and adequate bioavailability.10 Studies on SMPT are important to determine the phase transformation relationships of different solid forms, especially for obtaining pure metastable form. SMPT is easy to occur because the participation of solvent allows the metastable forms to interact continuously with the bulk solvent phase. Thus, how to prepare pure metastable forms remain a challenge in the pharmaceutical industry.
SMPT usually consists of the dissolution of the metastable form, the nucleation of the stable form, and the growth of the stable form.11,12 In different cases, the rate-limiting steps of the SMPT process are different, and the operating parameters will affect the phase transformation rate.13 O 'Mahony et al.14 studied the SMPT process of carbamazepine from Form II to Form III, which is controlled by the growth of Form III or by the dissolution of Form II, depending on the solvent. Piracetam15 is controlled by the growth of the stable form with a longer nucleation induction time. Pan et al.16 investigated the effects of different solvent compositions, solid loading, and seed sizes on the SMPT process of 2,4,6,8,10,12-hexanitro-2,4,6,8,10,12-hexaazaisowurtzitane. It was found that the stable form may nucleate on the surface of the metastable form and that the transformation rate was positively correlated with the solid loading. Thus, it is of importance to control the rate-limiting step and achieve long-term maintenance of metastable form by changing various parameters.
Calcium D-gluconate (Fig. 1) is widely used to reduce the permeability of capillaries, maintain the normal excitability of nerves and muscles, and contribute to bone formation.17–19 Meanwhile, as a common food additive, calcium D-gluconate is commonly applied as buffering agent, curing agent, chelating agent, and nutrient supplement.20 Calcium D-gluconate has one hydrate (monohydrate) and two anhydrous forms (Form I and Form II),21 where metastable monohydrate is widely used in production because of its high solubility and dissolution rate.22 However, injection-grade monohydrate in high purity is difficult to obtain through traditional crystallization processes due to the high risk of SMPT from monohydrate to Form I. In industry, the fermentation liquid of calcium D-gluconate after fermentation and reaction steps is further separated by cooling crystallization to produce highly pure injection-grade monohydrate. However, high concentration and high solids loading of fermentation liquid make it highly viscous, not easy to flow, and slow to dissolve,23 resulting in the dissolution rate being lower than the SMPT rate. Since the raw material with partial phase transformation is supersaturated for Form I, cooling crystallization of the raw material without complete dissolution will result in mixed crystal form products, which will seriously affect the product performance. Currently, fewer reports have focused on the solid-state characteristics and crystallization behavior of various forms of calcium D-gluconate. The SMPT process needs to be further studied to determine the phase transformation mechanism and find an approach to produce metastable monohydrate.
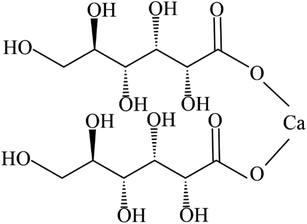 |
| | Fig. 1 The molecular structure of calcium D-gluconate. | |
In this work, Form I and the monohydrate of calcium D-gluconate were characterized by a series of methods to distinguish these two forms. The thermodynamic stability was determined by comparing the solubility of these two forms in water, and the solid dehydration of monohydrate was observed under a hot-stage microscope (HSM). Finally, an approach to producing metastable monohydrate was proposed by studying the effect of different parameters including temperature, solid loading, agitation rate, and particle size of solid loading on the SMPT process.
Experimental section
Materials and methods
Materials. Calcium gluconate monohydrate (USP grade) was purchased from Jiangtian Chemical Co., Ltd (Tianjin, China). Deionized water was produced by Yuanli Chemical Co., Ltd (Tianjin, China). All raw materials were directly used without secondary treatment.
Preparation of calcium gluconate Form I. Suspension of calcium gluconate monohydrate in water was stirred at 353.15 K at 600 rpm for at least 24 hours to obtain pure Form I. The final product was filtered and dried at 353.15 K for 24 hours.
Characterization of different forms of calcium D-gluconate. The powder X-ray diffraction (PXRD) patterns were obtained on a Rigaku D/max-2500 (Rigaku, Japan) using Cu-Kα radiation (λ = 1.5405 Å), with a step size of 0.02° and scanning rate of 8° per min over diffraction angle (2θ) range of 5°–40°. The test temperature was 298 K, the measured voltage was 40 kV, and the current was 15 mA. Crystal shapes were observed by field-emission scanning electron microscopy (SEM, Hitachi X-650). Differential scanning calorimetry (DSC) was performed from 303 to 570 K on a Mettler-Toledo 1/500 calorimeter. Thermogravimetric analysis (TGA) was carried out from 303 to 600 K on a Mettler-Toledo 1/SF analyzer at a constant heating rate of 10 K min−1 under a nitrogen gas flow rate of 50 mL min−1.
Solubility measurements and phase transition temperature determination. The solubility of the two forms in water was measured by the static method from 278.15 to 353.15 K. At first, excess monohydrate and Form I solid were added to 30 mL water in a 50 mL crystallizer equipped with a magnetic stirrer at 200 rpm and a thermostat (CF41, Julabo, accuracy ±0.1 K), respectively. And the suspension was stirred for at least 12 hours and kept still for 12 hours. Then the supernatant of 2 mL was withdrawn with a preheated/cooled syringe and filtered through a 0.45 μm filter and then dried in an oven until the solvent evaporated completely at 353.15 K. The undissolved crystals were analyzed by PXRD to determine that no SMPT occurred during the measurement. The mole fraction solubility x can be calculated as follows| |
 | (1) |
where m1 and M1 refer to the mass and molecular weight of calcium D-gluconate, respectively. And m2, M2 refer to the mass and molecular weight of water, respectively. To determine the phase transition temperature, the temperature-dependent solubility was correlated by the modified Apelblate equation as followed| |
 | (2) |
where A, B, and C are empirical parameters, and T is the absolute temperature.The phase transition temperature is determined by the intersection of the fitting curves of the two crystal forms.
Solid-state dehydration of monohydrate. The solid-state dehydration behavior of calcium gluconate monohydrate was observed under a hot-stage microscope (HSM, Olympus UMAD3). The sample was heated from 303.15 to 473.15 K with a heating rate of 10 K min−1.
Phase transformation experiments. First, 5.6 g of monohydrate was added to 100 g saturated aqueous solution at 348.15 K. The slurry was agitated using mechanical stirring at 200 rpm. The SMPT from calcium gluconate monohydrate to Form I was monitored by the Raman spectrometer,24 and the solution concentration was measured by the static method. The solid composition was monitored by a Raman RXN2 system at an exposure time of 15 s per minute, and averaged three times per scan to give the final results (Fig. 2). The Raman probe was vertically inserted into the suspension. The IC system software completed the acquisition and analyzed the process of SMPT. The Raman spectra are between 3200–100 cm−1. The luminescence wavelength of the laser was 785 nm. The mechanism of phase transformation was explored by changing the experimental operating parameters. The effects of temperature, solid loading, agitation rate, and particle size of solid loading on the SMPT process were investigated. The experimental parameters are listed in Table S1.† During the SMPT, solid loading was periodically extracted and analyzed by SEM and PXRD. The different particle sizes of monohydrate solids (Dv(50) = 3.36, 2.21, and 1.77 μm) were prepared by hand grinding for different times (0 min, 10 min, and 30 min), and the ground samples were characterized by PXRD to ensure that the mechanical forces did not change the crystal form and the crystals remained the same metastable monohydrate. The size was determined by Malvern Mastersizer S 3000 (Malvern Instruments Ltd, UK).
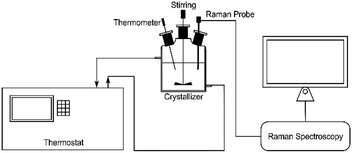 |
| | Fig. 2 Schematic diagram of the experimental setup. | |
In this study, induction time16 was defined as the time from the addition of calcium gluconate monohydrate to the formation of Form I, whereas transformation time was defined as the time from monohydrate addition to the Form I content was stable in a certain range.
Calibration of the Raman spectra for crystal form content. The calibration method of Raman spectra was adopted from published literature.25,26 To establish the standard curve of the correlation between the crystal form content and the Raman intensity, monohydrate and Form I with known ratio were fully mixed and ground to eliminate the influence of particle size on the Raman characteristic peak intensity. The molar fraction of Form I was chosen as the horizontal axis, and the relative peak height (HI/(HI + Hhydrate)) was used as the vertical axis (Fig. S1†).| |
 | (3) |
| |
 | (4) |
where x1and x2 refer to the molar fraction of Form I and monohydrate, respectively. And HI, Hhydrate refer to the characteristic peak heights of Form I and monohydrate, respectively.
Results and discussion
Characterization of different forms of calcium D-gluconate
According to PXRD patterns in Fig. 3, the characteristic peaks of monohydrate are located at 8.0°, 9.0°, and 22.5°. In comparison with the single crystal data obtained from CCDC, it can be seen that the experimental sample has the same crystal structure as that reported by V. Bugris.27 While Form I exhibits three characteristic peaks at 10.1°, 12.3°, and 35.5°, which are completely different from the monohydrate. Therefore, the PXRD can effectively identify the two forms.
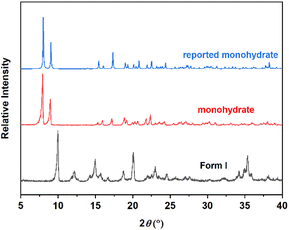 |
| | Fig. 3 PXRD patterns of calcium gluconate monohydrate and Form I. | |
The TGA and DSC thermograms of calcium gluconate monohydrate (Fig. 4a) show a weight loss of 3.99% from 400 to 439 K, which coincides with the theoretical value of one water molecule in the single crystal structure (4.01%).27,28 Meanwhile, the DSC curve shows an endothermic peak in the same temperature range due to dehydration. In addition, this temperature is significantly higher than the boiling point of water, implying a strong interaction between water and calcium D-gluconate molecules. Next, a heat absorption peak occurs at 442–460 K without mass loss, which is ascribed to the melting of calcium D-gluconate. And decomposition occurs at temperatures above 471 K. For Form I (Fig. 4b), there is only one endothermic peak at 516 K caused by decomposition.
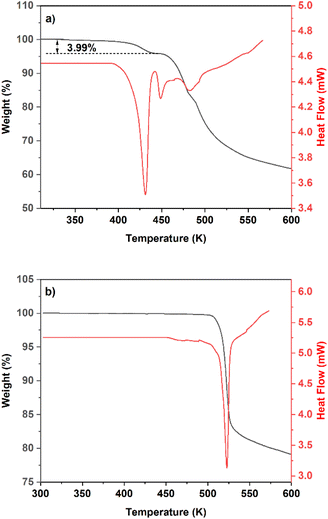 |
| | Fig. 4 TGA and DSC thermograms of (a) calcium gluconate monohydrate, (b) Form I. | |
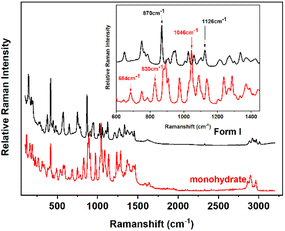
Raman spectroscopy (Fig. 5) shows characteristic peaks of Form I lie in 870 cm−1, and 1126 cm−1, while those of monohydrate are located in 684 cm−1, 830 cm−1, and 1046 cm−1. In particular, peaks at 1046 cm−1 for monohydrate and at 870 cm−1 for Form I in the SPMT process were online monitored as characteristic peaks to determine the content changes of different forms.
 |
| | Fig. 5 Raman spectra of calcium gluconate monohydrate and Form I. | |
Determination of phase transition temperature
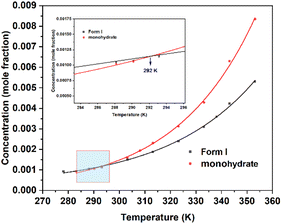
The thermodynamic stability of the different crystal forms can be determined by solubility at different temperatures, where the crystal form with high stability has low solubility.29 The solubility of two forms in water was measured, and the fitted curves30 (Table S2†) of the two forms intersect at 292 K (Fig. 6). Form I has higher solubility below 292 K and lower solubility above 292 K, indicating that calcium gluconate monohydrate is more stable than Form I below 292 K, while Form I is the more stable one above 292 K.31 The calculated transition temperature (292 K) is less than the melting point (442 K), indicating that it is an enantiotropy system.32,33
 |
| | Fig. 6 Calcium gluconate monohydrate and Form I solubility curve. | |
Solid dehydration of monohydrate mechanism
Solid dehydration of monohydrate was observed using the HSM. During the heating process, the optical properties of the crystal changed. When the crystal was heated to 431.15 K (Fig. 7b), the optical properties of the crystals disappeared instantly and crystals turned completely black, indicating that the dehydration process of water molecules has been completed and the monohydrate lattice has collapsed. Next, calcium D-gluconate decomposes due to heat when the temperature reaches 473.15 K (Fig. 7c), and the solid foaming expansion, which is consistent with DSC/TGA.
 |
| | Fig. 7 Hot-stage microscopy images of the solid-state dehydration of calcium gluconate monohydrate during the heating process. | |
The variable temperature XRD (VT-XRD) patterns of monohydrate at different temperatures (Fig. S2†) show that the monohydrate transforms into amorphous after dehydration, and the amorphous state persists until the end of the sample foaming expansion. On the other hand, the DSC thermogram of the monohydrate (Fig. S3†) reveals that there is no peak at the decomposition temperature of Form I (516 K) and no crystal transformation peak appears, suggesting that the monohydrate can not convert to Form I by heating.
Solution-mediated phase transformation
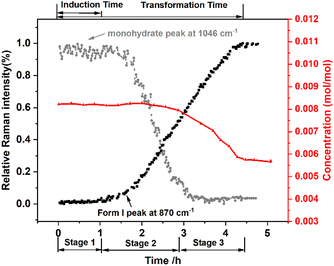
According to the solubility curve and Raman curve, the SMPT is divided into three stages (Fig. 8), during the first hour of the experiment, only calcium gluconate monohydrate can be detected by Raman spectroscopy. And the concentration remains constant, which is the solubility of calcium gluconate monohydrate. This period is defined as the nucleation induction time controlled by the nucleation of Form I. Then the peak intensity of Form I begins to increase, but it is the opposite for monohydrate, which means Form I begins to nucleate and grow. Meanwhile, the solution concentration remains constant, indicating that the nucleation and growth of Form I are supported by the dissolution of monohydrate. On the other hand, the total rate of growth is compensated by the much faster total rate of dissolution. After 2.86 h (stage 3), the monohydrate almost disappears, and the solution concentration begins to decrease significantly until the solubility of Form I is reached, where the suspended solids are all Form I. The Raman spectra no longer changes meaning the SMPT is finished. In other words, at the beginning of SMPT, both the solution concentration and the Raman curve remain constant for a long time, and their intensities represent the solubility of metastable form and 100% of solid loading in metastable form, respectively. When the content of the metastable form starts to decrease until it is about to disappear completely, the solution concentration starts to decrease to the solubility of the stable form. Finally, the Raman curve shows that all the solid loading is stable form. Consequently, according to the four scenarios described by O’ Mahony et al., the nucleation and growth of Form I are the rate-limiting steps of calcium D-gluconate SMPT.
 |
| | Fig. 8 Variation of the relative Raman intensity and solution concentration ( ) during the SMPT process from calcium gluconate monohydrate ( ) during the SMPT process from calcium gluconate monohydrate ( ) to Form I (■) in water at 353.15 K. ) to Form I (■) in water at 353.15 K. | |
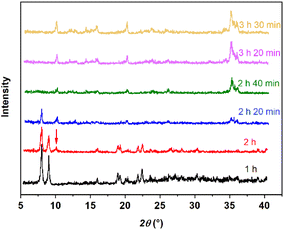
PXRD patterns (Fig. 9) and SEM images (Fig. 10) also show the phase transformation from calcium gluconate monohydrate to Form I. PXRD patterns only show characteristic peaks of monohydrate at 1 h and crystals maintain their original long needle-like morphology (Fig. 10a). While PXRD shows a small peak of Form I at 10.1° at 2 h and short rod-like crystals appear (Fig. 10b), indicating that Form I begins to nucleate and grow. As the transformation continues, the intensity of characteristic peaks of monohydrate decreased until disappeared at 2 h 40 min. Correspondingly, the amount of Form I increases until the field of view is entirely occupied by short rod-like crystals at 2 h 40 min (Fig. 10d).
 |
| | Fig. 9 PXRD patterns of suspended solids at different times during the SMPT process from calcium gluconate monohydrate to Form I in water at 353.15 K. | |
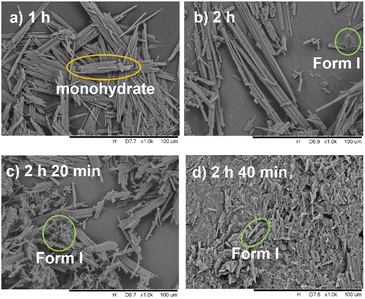 |
| | Fig. 10 SEM photos taken at different times during the SMPT process from calcium gluconate monohydrate to Form I in water at 353.15 K. | |
Effects of operating parameters on the SMPT process
Effects of temperature. To explore the influence of temperature on the SMPT process, we set the experimental temperatures as 338.15 K, 348.15 K, and 353.15 K. As can be seen from Fig. 11, both induction time and transformation time decrease with increasing temperature. The induction time declines from 12.79 h at 338.15 K to 1.00 h at 353.15 K, while the transformation time decreases from 30.22 h to 10.08 h. First, from the kinetic perspective, the large differences in induction time at different temperatures can be explained by the heterogeneous nucleation rate equation, where solubility plays an important role.
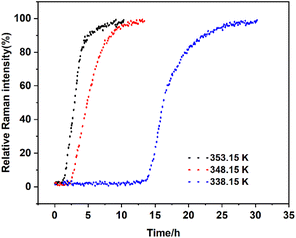 |
| | Fig. 11 Profiles of the SMPT process from calcium gluconate monohydrate to Form I with different temperatures, in terms of the relative Raman intensity of Form I peak at 870 cm−1. | |
The nucleation rate can be written as
| |
 | (5) |
where
J is the number of nuclei formed per unit time per unit volume,
N0 is the number of solute molecules per unit volume,
V is the frequency of molecular transport at the nucleation liquid interface,
φ is the heterogeneous nucleation factor, and
k is the Boltzmann constant (1.3806 × 10
−23 J K
−1). The critical free energy barrier for nucleation (Δ
G*) is given by
| |
 | (6) |
where
v is the molecular volume of the solute;
S is the supersaturation ratio.
The interfacial energy, γ can be written as34
| |
γ = 0.414kT(csNA)2/3(ln![[thin space (1/6-em)]](https://www.rsc.org/images/entities/char_2009.gif) cs − ln cs − ln![[thin space (1/6-em)]](https://www.rsc.org/images/entities/char_2009.gif) ceq) ceq)
| (7) |
where
cs is equal to the ratio of the density of the solute to the molar mass of the solute,
NA is Avogadro's number (6.022 × 10
23), and
ceq is the equilibrium solubility. As the temperature goes up, the solubility and
N0 increase.
V related to the agitation rate, which is constant during the experiment. Rising temperature causes (ln
![[thin space (1/6-em)]](https://www.rsc.org/images/entities/char_2009.gif) S
S)
2 to increase,
γ to decrease, and finally Δ
G* to decrease. Collectively, those ultimately result in the acceleration of the heterogeneous nucleation rate in
eqn (5).
On the other hand, from the thermodynamic point of view, when the temperature is higher than 292 K, the solubility difference between the two crystal forms increases with the rising temperature, leading to an increase in the thermodynamic driving force, which accelerates the transformation process. The driving force of the phase transformation is the Gibbs free energy difference (ΔGA→C) between the two forms, which can be expressed as
| |
 | (8) |
where
R is the ideal gas constant, 8.314 J mol
−1 K
−1;
f is fugacity;
α is thermodynamic activity;
x is mole fraction solubility. As shown in
Fig. 12, Δ
GA→C are negative, which indicates that the phase transformation is spontaneous. Therefore, under the influence of both thermodynamics and kinetics, the increasing temperature promotes the SMPT process, resulting in a shortening of the induction time and transformation time.
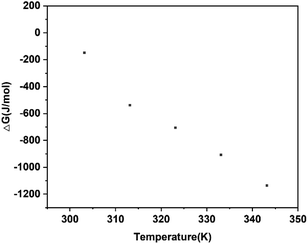 |
| | Fig. 12 The thermodynamic driving forces (ΔGA→C) of the phase transformation at different temperatures in water. | |
To investigate the kinetics of the solution-mediated phase transformation at different temperatures, the JMA model was selected to correlate with the Raman spectroscopic data obtained from the experiment. And this model can be written as35,36
| | |
x(t)I = 1 − exp{−K(t − tind)n}
| (9) |
| | |
x(t)hydrate = exp{−K(t − tind)n}
| (10) |
where
x(
t)
I and
x(
t)
hydrate refer to the fraction of Form I and monohydrate in solid loading at time
t, respectively.
tind is the induction time of stable form.
K is the rate-dependent constant of stable form.
n is the order of the transformation.
According to eqn (9), the kinetic parameters of the phase transformation at different temperatures are listed in Table 1. As the temperature increases, the induction time is shortened, K values increase, and the order of transformation becomes larger. All values of R2 are above 0.99, which indicates that the model fits the SMPT well.
Table 1 Results of Kinetic parameters for calcium D-gluconate transformation
| Condition |
tind/h |
K/h−3 |
n |
R2 |
| 353.15 K |
1.00 |
0.244 |
1.61 |
0.9933 |
| 348.15 K |
1.92 |
0.128 |
1.55 |
0.9989 |
| 338.15 K |
12.79 |
0.109 |
1.39 |
0.9955 |
Effects of solid loading. The effect of solid loading on SMPT was also investigated, 4.3 g, 5.6 g, and 6.6 g (30.47%, 39.8%, 46.77% of solute mass) of calcium gluconate monohydrate to the saturated aqueous solution. According to Fig. 13, reducing the amount of solid loading can effectively prolong the induction time, compared to 6.6 g solid loading, 4.3 g solid loading extends the induction time from 0.37 to 8.48 h. Considering that the crystal growth rate is constant because the supersaturation is constant in the same solvent at the same temperature in SMPT.37 It can be speculated that the nucleation of Form I tends to occur on the surface of monohydrate.38,39 Positive correlation between solid loading and phase transform rate may be due to the high local supersaturation at the interface of metastable form promoting nucleation. In conclusion, the SMPT process of calcium gluconate monohydrate is controlled by the nucleation and growth of stable form, whereas the nucleation of Form I is controlled by the surface of monohydrate, so the less solid loading provides fewer nucleation sites compared to a large solid loading, the longer the transformation time will be.
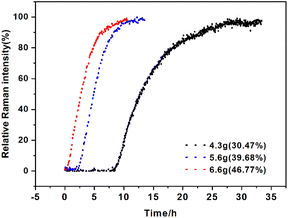 |
| | Fig. 13 Profiles of the SMPT process from calcium gluconate monohydrate to Form I with different solid loadings, in terms of the relative Raman intensity of Form I peak at 870 cm−1. | |
Effects of the particle size of solid loading. To investigate the effect of particle size of solid loading on the SMPT, 5.6 g calcium gluconate monohydrate with different particle sizes (Dv(50) = 1.77, 2.21, and 3.36 μm) was added to the saturated solution. The PXRD patterns of calcium gluconate monohydrate with different particle sizes after grinding are shown in Fig. S4,† indicating no form changes, and the particle size distribution is shown in Fig. S5.† Fig. 14 indicates that a solid loading of 3.36 μm extends the induction time from 20 min with a solid loading of 1.77 μm to 115 min. This is because reducing the particle size increases the number of particles when the solid loading is a certain amount. Moreover, smaller-sized crystals possess a larger specific surface area, providing more nucleation sites. Therefore, solid particles with smaller particle sizes can shorten the induction time.
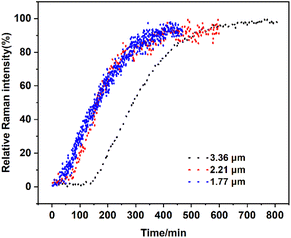 |
| | Fig. 14 Profiles of the SMPT process from calcium gluconate monohydrate to Form I with various particle sizes of solid loadings, in terms of the relative Raman intensity of Form I peak at 870 cm−1. | |
Effects of agitation rate. Different agitation rates (200 rpm, 400 rpm, and 600 rpm) were used to explore the effect of agitation rate on the SMPT process with 4.4 g solid loading. According to the results in Fig. 15, the agitation rate is negatively correlated with the induction time. With increasing agitation rates, the induction time was shortened from 8.53 h at 200 rpm to 1.10 h at 600 rpm and the transformation time from 30 h to 8 h. Because it is an effective method of removing the stable form grown on the surface of the metastable form.13 With the agitation rate increasing, Form I is removed from the surface so that the surfaces of the metastable form can be reused, which accelerates the SMTP process. On the other hand, the agitation rate plays a positive role in the mass transfer and promotes the whole process of SMPT including dissolution, nucleation and growth. Hence, increasing the agitation rate can shorten the induction time and transformation time.
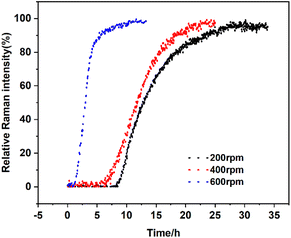 |
| | Fig. 15 Profiles of the SMPT process from calcium gluconate monohydrate to Form I with different agitation rates, in terms of the relative Raman intensity of Form I peak at 870 cm−1. | |
Considering the production efficiency and the properties of water-solvent, the system temperature is required to obtain pure injection-grade calcium gluconate monohydrate with higher yield without exceeding 353.15 K. When the final cooling temperature is determined to be 303.15 K, the higher the solid loading, the higher the concentration of the solution after complete dissolution, and the higher the product yield.40 When the solid loading was set to 313%, i.e., undissolved calcium D-gluconate accounted for 313% of the mass of solute in the aqueous 303.15 K saturated calcium D-gluconate solution, the agitation rates of 400 rpm (Fig. 16a) and 200 rpm (Fig. 16b) were selected, and it was found that although the high agitation rate accelerated the dissolution rate, it was still smaller than the phase transformation rate, resulting in the generation of Form I. When the dissolution temperatures were set to 353.15 K (Fig. 16b) and 348.15 K (Fig. 16c), the results showed that the increase of the dissolution rate at high temperature was significantly larger than that of the phase transformation rate, making the dissolution rate higher than the phase transformation rate, and pure injection-grade monohydrate could be obtained. Finally, in order to achieve a greater yield, experiments were conducted using solid loading of 318% (Fig. 16d), and the experimental results revealed that the high solid loading promoted the phase transformation rate obviously, resulting in a lower purity of the product. In summary, the fermentation liquid of calcium D-gluconate with a solid loading of 313% is used as the raw material according to the efficiency requirements of the production process, yield requirements, and water-solvent properties, the injection-grade metastable calcium gluconate monohydrate can be effectively produced by dissolution at 353.15 K with 200 rpm, followed by cooling crystallization until 303.15 K. The PXRD patterns of the product before and after optimization are shown in Fig. 16.
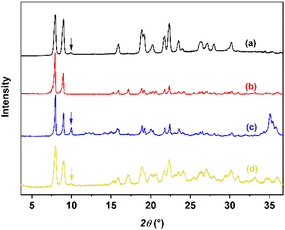 |
| | Fig. 16 PXRD patterns of injection-grade monohydrate with various parameters. | |
Conclusions
In this study, calcium gluconate monohydrate and Form I were first distinguished by a series of characterizations. According to the solubility of two forms in water, calcium D-gluconate is an enantiotropy system with a phase transition temperature of 292 K. Form I is the more stable form than monohydrate above 292 K, and calcium gluconate monohydrate is the more stable one at low temperature. The solvent-mediated phase transformation (SMPT) process from monohydrate to Form I in water was investigated by a combination of Raman spectroscopy, SEM, and PXRD. The results indicated that the SMPT process was controlled by the nucleation and growth of Form I. When the temperature decreases, the transformation is delayed due to the reduction of the thermodynamic driving force and nucleation rate. Moreover, the JMA model can effectively elucidate that the transformation kinetics, as well as the rate-dependent constants of Form I and the order of transformation also increase with increasing temperature. The solid-loading experiments showed that the induction time was negatively correlated with the solid-loading, while the particle size experiments showed that increasing the particle size of the solid loading can effectively prolong the induction time. And by reducing the agitation rate, the SMPT rate can also be effectively slowed down and the induction time extended. In summary, to maintain a longer induction time and keep calcium gluconate monohydrate from phase transformation, low temperatures, low agitation rates, reduced solid loading, and increased loading particle size can result in high-quality injection-grade calcium gluconate monohydrate.
Author contributions
Hang Zhang: conceptualization, investigation, validation, data curation, visualization, writing – original draft. Lihong Jia: writing – review & editing. Pingping Cui: writing – review & editing. Ling Zhou: supervision, validation. Qiuxiang Yin: supervision, resources.
Conflicts of interest
There are no conflicts to declare.
Acknowledgements
This work was supported by the Natural Science Foundation of Tianjin municipality (No. 21JCYBJC00600).
Notes and references
- J. Chakraborty, M. Subash and B. N. Thorat, Drying Technol., 2022, 40, 2817–2835 CrossRef.
- S. P. Delaney, T. M. Smith and T. M. Korter, RSC Adv., 2014, 4, 855–864 RSC.
- T. A. Zeidan, J. T. Trotta, R. A. Chiarella, M. A. Oliveira, M. B. Hickey, O. R. Almarsson and J. F. Remenar, Cryst. Growth Des., 2013, 13, 2036–2046 CrossRef CAS.
- L. Yu, Acc. Chem. Res., 2010, 43, 1257–1266 CrossRef CAS PubMed.
- K. Wang and C. C. Sun, Cryst. Growth Des., 2019, 19, 3592–3600 CrossRef CAS.
- S. Polat and P. Sayan, Ultrason. Sonochem., 2020, 66, 105093 CrossRef CAS PubMed.
- T. J. Noonan, K. Chibale, P. M. Cheuka, M. Kumar, S. A. Bourne and M. R. Caira, Cryst. Growth Des., 2019, 19, 4683–4697 CrossRef CAS.
- X. Xiong, Q. Du, X. Zeng, J. He, H. Yang and H. Li, RSC Adv., 2017, 7, 23279–23286 RSC.
- Z. Shi, Z. Wang, T. Zhang, L. Dang and H. Wei, RSC Adv., 2015, 5, 98050–98056 RSC.
- R. Hilfiker, S. M. De Paul and M. Szelagiewicz, Polymorphism: In the pharmaceutical industry, 2006, pp. 287–308 Search PubMed.
- C.-H. Gu, V. Young Jr and D. J. Grant, J. Pharm. Sci., 2001, 90, 1878–1890 CrossRef CAS PubMed.
- L. Jia, L. Zhou, W. Du, L. Zhou, M. Zhang, B. Hou, Y. Bao, Z. Wang and Q. Yin, Org. Process Res. Dev., 2018, 22, 836–845 CrossRef CAS.
- W. Du, Q. Yin, H. Hao, Y. Bao, X. Zhang, J. Huang, X. Li, C. Xie and J. Gong, Ind. Eng. Chem. Res., 2014, 53, 5652–5659 CrossRef CAS.
- M. A. O'Mahony, A. Maher, D. M. Croker, Å. C. Rasmuson and B. K. Hodnett, Cryst. Growth Des., 2012, 12, 1925–1932 CrossRef.
- M. Kuhnert-Brandstätter, A. Burger and R. Völlenklee, Sci. Pharm., 1994, 62, 307 Search PubMed.
- B. Pan, H. Wei, J. Jiang, S. Zong, P. Lv and L. Dang, J. Mol. Liq., 2018, 265, 216–225 CrossRef.
- F. Ryszka, R. Klimas, B. Dolinska and K. Lopata, Protein Pept. Lett., 2012, 19, 804–807 CrossRef CAS PubMed.
- P. Ireland and J. S. Fordtran, J. Clin. Invest., 1973, 52, 2672–2681 CrossRef CAS PubMed.
- B. Dolińska, K. Łopata, A. Mikulska, L. Leszczyńska and F. Ryszka, Biol. Trace Elem. Res., 2012, 147, 374–377 CrossRef PubMed.
- K. C. Sohn, S. J. Kang, J. W. Kim, K. Y. Kim, S. K. Ku and Y. J. Lee, Biomol. Ther., 2013, 21, 290 CrossRef CAS PubMed.
- Y.-Y. Di, G.-C. Zhang, Y.-P. Liu, Y.-X. Kong and C.-S. Zhou, J. Mol. Struct., 2021, 1225, 128818 CrossRef CAS.
- A. Burger, Pharm. Int., 1982, 3, 158–163 CAS.
- G. T. Lenz and B. A. Mikrut, Am. J. Hosp. Pharm., 1988, 45, 2367–2371 CAS.
- L. Jia, Q. Yin, L. Zhou, X. Zhang, C. Wang, W. Du and L. Zhou, RSC Adv., 2018, 8, 9697–9706 RSC.
- Y. Tong, P. Zhang, L. Dang and H. Wei, Chem. Eng. Res. Des., 2016, 109, 249–257 CrossRef CAS.
- Y. Tong, Z. Wang, E. Yang, B. Pan, L. Dang and H. Wei, Cryst. Growth Des., 2016, 16, 5118–5126 CrossRef CAS.
- V. Bugris, C. Dudás, B. Kutus, V. Harmat, K. Csankó, S. Brockhauser, I. Pálinkó, P. Turner and P. Sipos, Acta Crystallogr., Sect. B: Struct. Sci., Cryst. Eng. Mater., 2018, 74, 598–609 CrossRef CAS.
- F. J. W. J. Labuschagne and W. W. Focke, J. Mater. Sci., 2003, 38, 1249–1254 CrossRef CAS.
- D. Tempfli, E. Borbás, H. Pataki, D. Csicsák, G. Völgyi, B. Sinkó and K. Takács-Novák, Eur. J. Pharm. Sci., 2020, 149, 105328 CrossRef CAS PubMed.
- A. Apelblat and E. Manzurola, J. Chem. Thermodyn., 1999, 31, 85–91 CrossRef CAS.
- K. Urakami, Y. Shono, A. Higashi, K. Umemoto and M. Godo, Chem. Pharm. Bull., 2002, 50, 263–267 CrossRef CAS PubMed.
- A. Burger and R. Ramberger, Microchim. Acta, 1979, 72, 259–271 CrossRef.
- C. H. Gu and D. J. Grant, J. Pharm. Sci., 2001, 90, 1277–1287 CrossRef CAS PubMed.
- A. Mersmann, J. Cryst. Growth, 1990, 102, 841–847 CrossRef CAS.
- G. Wang, Y. Ma, Y. Wang, H. Hao and Y. Jiang, Org. Process Res. Dev., 2015, 19, 1820–1825 CrossRef CAS.
- M. Avrami, J. Chem. Phys., 1939, 7, 1103–1112 CrossRef CAS.
- C. Wang, L. Zhou, X. Zhang, Y. Yang, Q. Yin and K. J. Roberts, Ind. Eng. Chem. Res., 2018, 57, 16925–16933 CrossRef CAS.
- D. Croker and B. Hodnett, Cryst. Growth Des., 2010, 10, 2806–2816 CrossRef CAS.
- J. Dai, W. Yang, S. Zhang, L. Jia, Y. Niu, P. Cui, Q. Li, L. Zhou and Q. Yin, J. Mol. Liq., 2021, 334, 116507 CrossRef CAS.
- N. Shi, Q. Liu, Q. Zhang, T. Wang and L. Ma, Green Chem., 2013, 15, 1967–1974 RSC.
|
| This journal is © The Royal Society of Chemistry 2023 |
Click here to see how this site uses Cookies. View our privacy policy here.  Open Access Article
 a,
Lihong Jia
 a,
Pingping Cuia,
Ling Zhou*a and
Qiuxiang Yin*abc


 ) during the SMPT process from calcium gluconate monohydrate (
 ) to Form I (■) in water at 353.15 K.


![[thin space (1/6-em)]](https://www.rsc.org/images/entities/char_2009.gif) cs − ln
cs − ln![[thin space (1/6-em)]](https://www.rsc.org/images/entities/char_2009.gif) ceq)
ceq)
![[thin space (1/6-em)]](https://www.rsc.org/images/entities/char_2009.gif) S)2 to increase, γ to decrease, and finally ΔG* to decrease. Collectively, those ultimately result in the acceleration of the heterogeneous nucleation rate in eqn (5).
S)2 to increase, γ to decrease, and finally ΔG* to decrease. Collectively, those ultimately result in the acceleration of the heterogeneous nucleation rate in eqn (5).


