
 Open Access Article
 This Open Access Article is licensed under a Creative Commons Attribution-Non Commercial 3.0 Unported Licence
Impact of safety valves on thermal runaway characteristics of 21![[thin space (1/6-em)]](https://www.rsc.org/images/entities/h2_char_2009.gif) 700-size lithium-ion cells†
700-size lithium-ion cells†
Linqun Ouyanga,
Jian Huangc and
Dongxu Ouyang *b
*b
aCollege of Mechanical and Electrical Engineering, Wuyi University, Nanping, 354300, China
bCollege of Safety Science and Engineering, Nanjing Tech University, Nanjing, 211816, China. E-mail: ouyang11@mail.ustc.edu.cn
cCollege of Mechanical Engineering, Nanjing Tech University, Nanjing, 211816, China
First published on 17th March 2023
Abstract
To demonstrate the impact of safety valves on the thermal runaway characteristics of 21![[thin space (1/6-em)]](https://www.rsc.org/images/entities/char_2009.gif) 700-size lithium-ion cells, this work carries out a series of abusive tests including over-heating tests, accelerating rate calorimetry (ARC) tests and overcharge tests; in the meantime, the impact of safety valves on cells with various states of charge (SOC) and states of health (SOH) is unveiled accordingly. Safety valves have a great impact on the thermal runaway behavior of 21700-size cells, which effectively restrains the thermal runaway risks and hazards of cells under the over-heating conditions. The presence of a safety valve could even prevent a cell from the thermal runaway induced by overcharge. A cell with a larger SOC and/or a lower SOH is prone to the thermal runaway occurring, with an earlier thermal runaway, a lower temperature to thermal runaway and a lower mass loss demonstrated. Besides that, it is found that the advancement ratio of the time to thermal runaway between cells with and without a safety valve was maintained at around 15%; that is, the existence of a safety valve is helpful to delay the encounter of thermal runaway by ∼15%.
700-size lithium-ion cells, this work carries out a series of abusive tests including over-heating tests, accelerating rate calorimetry (ARC) tests and overcharge tests; in the meantime, the impact of safety valves on cells with various states of charge (SOC) and states of health (SOH) is unveiled accordingly. Safety valves have a great impact on the thermal runaway behavior of 21700-size cells, which effectively restrains the thermal runaway risks and hazards of cells under the over-heating conditions. The presence of a safety valve could even prevent a cell from the thermal runaway induced by overcharge. A cell with a larger SOC and/or a lower SOH is prone to the thermal runaway occurring, with an earlier thermal runaway, a lower temperature to thermal runaway and a lower mass loss demonstrated. Besides that, it is found that the advancement ratio of the time to thermal runaway between cells with and without a safety valve was maintained at around 15%; that is, the existence of a safety valve is helpful to delay the encounter of thermal runaway by ∼15%.
1. Introduction
The global market for lithium-ion cells is expected to grow rapidly in the coming years, with projections reaching 92 billion USD by 2026 and a compound annual growth rate of 14.6% according to Beijing R&J Biji Information Consulting Co.1 Despite the popularity of lithium-ion cells as an advanced energy storage device, they have inherent safety flaws like high-temperature sensitive electrode materials, combustible electrolytes, and flammable separators.2–5 These issues can lead to thermal runaway events, causing significant loss of life and property.To address this issue, there has been a growing focus on improving the thermal safety of lithium-ion cells through internal protective precautions, such as safety devices.6,7 One of the most general safety measures is the safety valve. Gases are regularly generated inside cells during use, particularly under extreme situations.8 The safety valve, which permits surplus gases to escape and thus prevent an incident worsening, was proposed as a result of the steadily increasing pressure within a cell. Furthermore, the opening of the safety valve is generally used to warn of the impending thermal hazard of lithium-ion cells.9
To date, there have been few studies examining the impact of safety valves on cell safety.10–14 According to Mier et al.,10 the venting process produced by the opening of a safety valve not only released gases, electrolytes, and solids, but also generated a shock wave. Ouyang et al.11 investigated the role of safety valves in the safety of 18650-sized cells and found that without a safety valve, the cells showed a significant deterioration in thermal runaway features, with ignition and thermal runaway occurring much earlier. Zhu et al.12 conducted a study combining experimental and numerical techniques on lithium-ion cells to investigate the sequence of deformation and the root cause of failure. The results showed that the safety valve played a protective role when an axial compression was applied to the cell, thereby improving its safety. The authors also recommended that manufacturers optimize both the safety valve and the gap between the jelly roll and the safety valve to further enhance cell safety.
Given the significance of safety valves, it is clear that the studies into the impact of a safety valve on the safety behaviors of lithium-ion cells remain many deficiencies. Especially with the development of lithium-ion cells, more and more new-format cells such as 21700, 46800 cells were developed to meet the requirement of humans on energy density. How does safety valves impact the thermal runaway characteristics of these new-format cells is waiting to be revealed. To address this gap in knowledge, a series of experiments were conducted to investigate the effect of safety valves on the thermal runaway behaviors of 21700-sized lithium-ion cells. The study included commonly used abusive tests, such as accelerating rate calorimetry (ARC) tests, overcharge tests, and over-heating tests; in addition, cells with various states of charge (SOC) and states of health (SOH) were also considered. To gain a fundamental understanding of the safety concern with lithium-ion cells, data on the cell surface temperature, experimental phenomenon, audio intensity, and mass were measured and evaluated. It is hoped that this investigation will contribute to our understanding of how safety valves impact the 21700-size cells and encourage greater research into internal protective devices for cells.
2. Experiments
2.1 Cell samples
The cell samples used in this study were fresh commercial 21700-size lithium-ion cells purchased from Tianjin Lishen Battery Co., with a diameter of 21 mm and a height of 70 mm. The nominal capacity of these cells was approximately 3700 mA h, with cathode active materials of lithium nickel manganese cobalt oxide (NMC532) and anode active materials of graphite. The cells' upper/lower cut-off voltages were 4.2 and 2.75 V, respectively. Cells without safety valves were suitably customized. The presence of a safety valve is the only difference between the normal cells and the cells without safety valves. A safety valve acts once the difference between the internal pressure and outer pressure of a cell achieves 10 kPa for the cells herein. Prior to the experiments, cells were activated using a constant current–constant voltage (CC–CV) protocol of 0.5C twice between 2.75 and 4.2 V.
2.2 Experimental design and apparatuses
To demonstrate the impact of the safety valve on the thermal runaway behavior of 21700-size cells under abusive conditions, five groups of tests, as indicated in Table 1, were carried out. To guarantee the accuracy of the experimental data, each analysis was conducted twice.
| Group no. | Test no. | SOC (%) | SOH (%) | Testing | |
|---|---|---|---|---|---|
| 1 | 1 | 25 | 100 | Over-heating | Cell samples with/without safety valves |
| 2 | |||||
| 2 | 3 | 100 | ARC | ||
| 4 | |||||
| 3 | 5 | Overcharge | |||
| 6 | |||||
| 4 | 7 | 25 | Over-heating | ||
| 8 | 50 | ||||
| 9 | 75 | ||||
| 5 | 10 | 25 | 100 | ||
| 11 | 90 | ||||
| 12 | 80 |
Group 1: two tests were performed on cell samples with and without safety valves to demonstrate the impact of the safety valve on the thermal runaway behavior of cells when subjected to over-heating. The cell SOC was kept the same, at 25%.
Group 2: two tests were performed on cell samples with and without safety valves to demonstrate the impact of the safety valve on the thermal runaway behavior of cells during the ARC testing. The cell SOC was kept the same, at 100%.
Group 3: two tests were performed on cell samples with and without safety valves to demonstrate the impact of the safety valve on the thermal runaway behavior of cells during the overcharge testing. The cells were firstly charged to 100% SOC and then overcharged with a rate of 1C.
Group 4: three tests of cell samples with different SOCs (25%, 50%, and 75%) were carried out to demonstrate the impact of safety valves on the thermal runaway behavior of cells with different energy stored.
Group 5: three tests of cell samples with various SOHs (100%, 90%, and 80%) were conducted to demonstrate the impact of safety valves on the thermal runaway behavior of cells with various aging degrees. The aged cells were obtained when fresh cells degraded to the fixed SOHs after long-term cycling at a rate of 2C by the CC–CV protocol.
A cell testing system (NEWARE CT-6000) with a parameter of 20 V/200 A was used herein to obtain cells with various SOCs and SOHs. The over-heating tests were performed at the experimental platform depicted in Fig. 1(a). Cells were fixed by a fixture to keep cells standing upright during tests. To induce cell thermal runaway, a 2 kW electric heater was placed 2 cm below the cell. A 1 mm diameter K-type thermocouple was placed in the middle of each cell to measure the surface temperature, and the temperatures were recorded by a computer utilizing data gathering apparatus (NI cDAQ-9174). The mass loss information was measured using an electronic balance (Mettler Toledo XP10002S) with a maximum range of 9 kg and a resolution of 0.01 g. The experimental phenomena were recorded using a video camera with a resolution ratio of 25 frames per second (SONY XPS160). An infrared camera (Telop FAST M200) with a temperature range of 183–1076 °C was used to capture the infrared pictures of the fire. The ARC tests were conducted by an accelerating rate calorimetry (THT ES), see Fig. 1(b). The temperature was raised from 50 °C until exceeding 300 °C. In the adiabatic state, once the self-heating rate of the sample exceeded 0.02 °C min−1, tracking was carried out. The overcharge tests (see Fig. 1(c)) were carried out at a 1C current until the appearance of thermal runaway via the NEWARE testing system above.
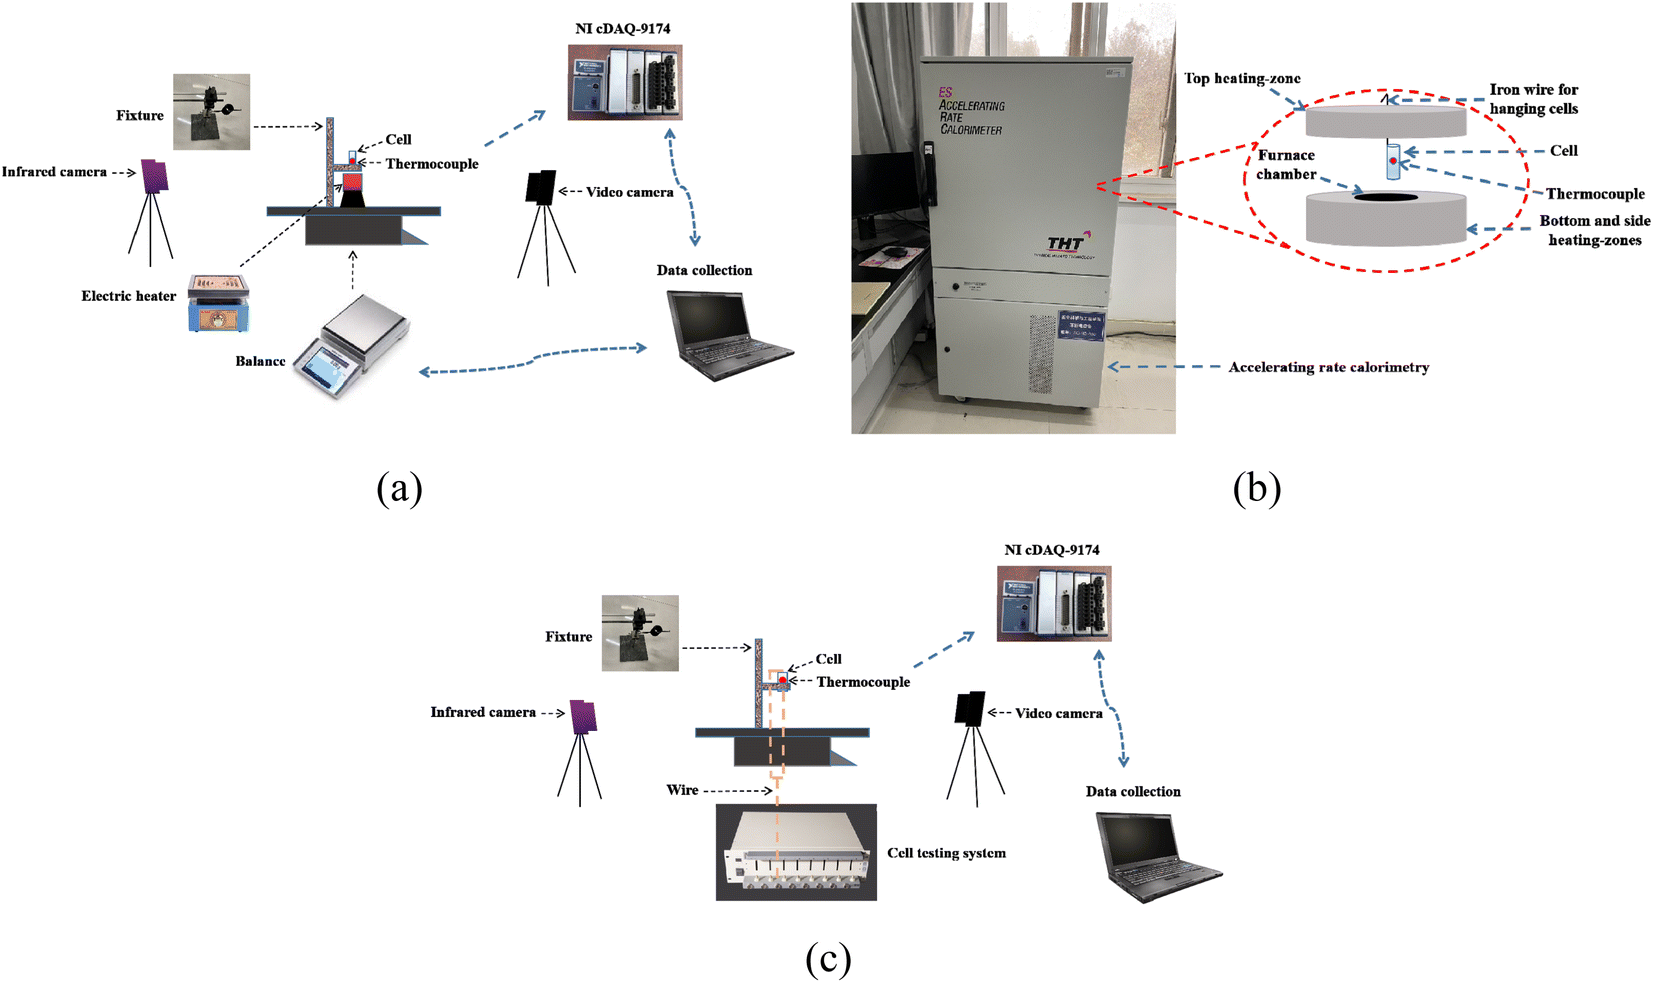 | ||
| Fig. 1 Schematic of the experimental setup for: (a) over-heating tests; (b) ARC tests; (c) overcharge tests. | ||
3. Results and discussion
3.1 Impact of safety valves on the thermal runaway behaviors of cells during the over-heating test
Fig. 2 compares the results of 21700-size cells with/without safety valves in the process of over-heating, the result of repeated experiments is shown in Fig. S1 of the ESI† materials. Clearly, the safety valve brought about significant impacts on the thermal runaway behavior of 21700 cells. For the cell with a safety valve, it occurred the safety valve opening at 684 s, with a surface temperature decline due to the heat loss caused by gas releasing. Thereafter, it encountered the thermal runaway at around 803 s. In terms of the cell without a safety valve, it appeared the thermal runaway earlier by ∼88 s, and the according temperature to thermal runaway was also somewhat lower (191 vs. 202 °C). That is, the cell without a safety valve had a worse thermal runaway risk that might experience the thermal runaway at a lower temperature. Besides that, it can be found that the peak temperature and the maximum temperature rising rate obtained by the cell without a safety valve were larger than those of the cell with a safety valve as well (588 vs. 502 °C; 2554 vs. 2092 °C min−1). Obviously, the cell without a safety valve also owned a more severe thermal runaway hazard at elevated temperatures. Moreover, owing to the absence of the safety valve, the cell without a safety valve did not experience the safety valve opening in the whole process, with the surface temperature rising steady until the encounter of thermal runaway. Some critical parameters of the two cells in the thermal runaway process are further displayed in Table 2.
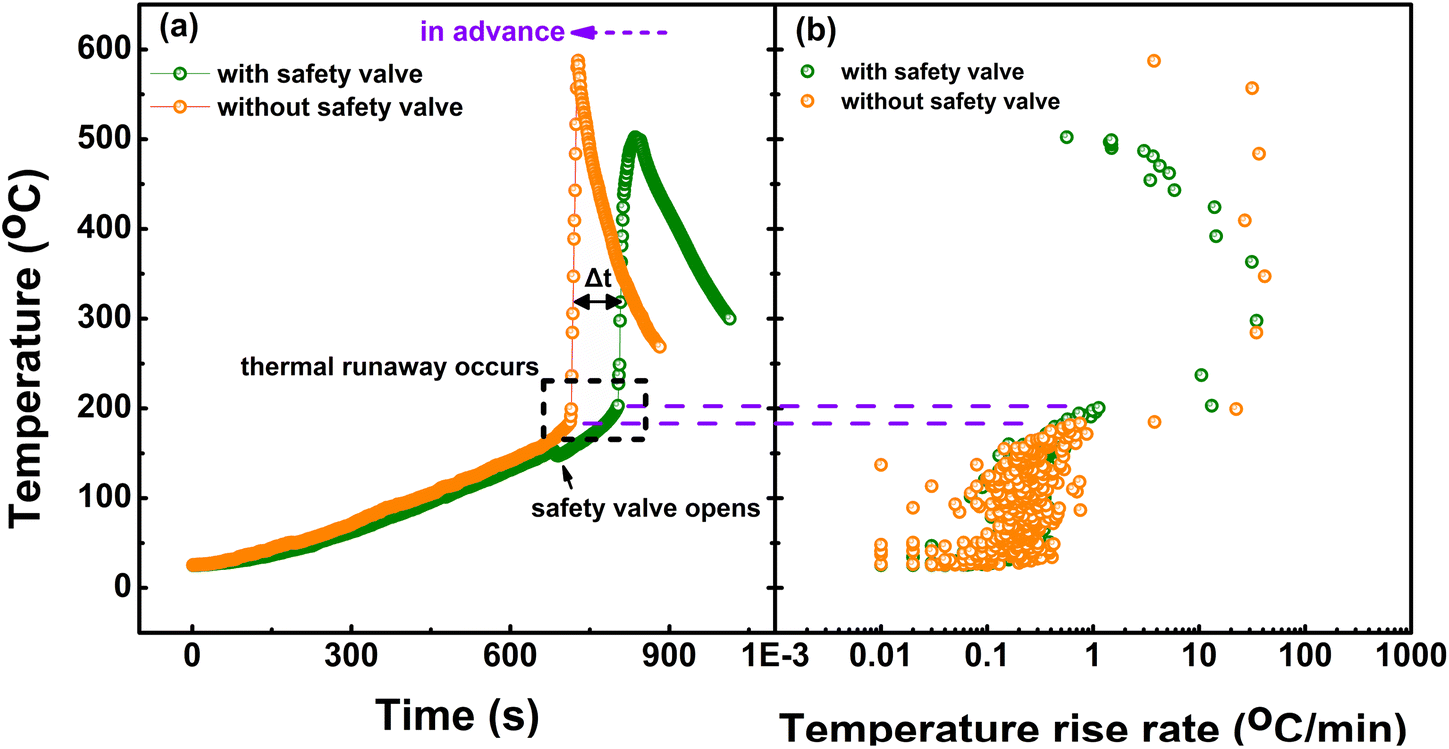 | ||
| Fig. 2 Over-heating testing results of cells with/without safety valves: (a) temperature versus time curves; (b) temperature versus temperature rise rate curves. | ||
| Parameter | The cell with a safety valve | The cell without a safety valve |
|---|---|---|
| Time to safety valve opening (s) | 684 | — |
| Time to thermal runaway (s) | 803 | 715 |
| Time difference between 1st gas releasing and 2nd gas releasing | 112 | — |
| Temperature to thermal runaway (°C) | 202 | 191 |
| Time to peak temperature (s) | 835 | 727 |
| Peak temperature (°C) | 502 | 588 |
| The maximum temperature rising rate (°C min−1) | 2092 | 2554 |
Fig. 3 reveals the typical phenomenon of these two cells during the over-heating tests. For the cell with a safety valve, it experienced two times of gas releasing (the one after the safety valve opening and the other one before thermal runaway). In general, the released gases were a compound of generated gases, ejected electrolytes and shattered electrodes.10,15 Thereafter, it appeared a violent ejection followed by a combustion. As for the cell without a safety valve, it released gases continuously, therefore it only underwent a massive gas releasing when the thermal runaway was near to occur. After that, the ejection and combustion was followed. By comparison to the results of 18650-size cells captured by the authors before,16 it is found that the ejection behavior of the 21700-size cell was much more violent, which may be attributed to its more energy stored. This would further cause a serious mass loss for cells during the thermal runaway, see Fig. 7 and 9. Finally, it seems that the safety valve had no obvious impact on the flame of cells' thermal runaway, the cells with and without a safety valve showed similar flame evolution.
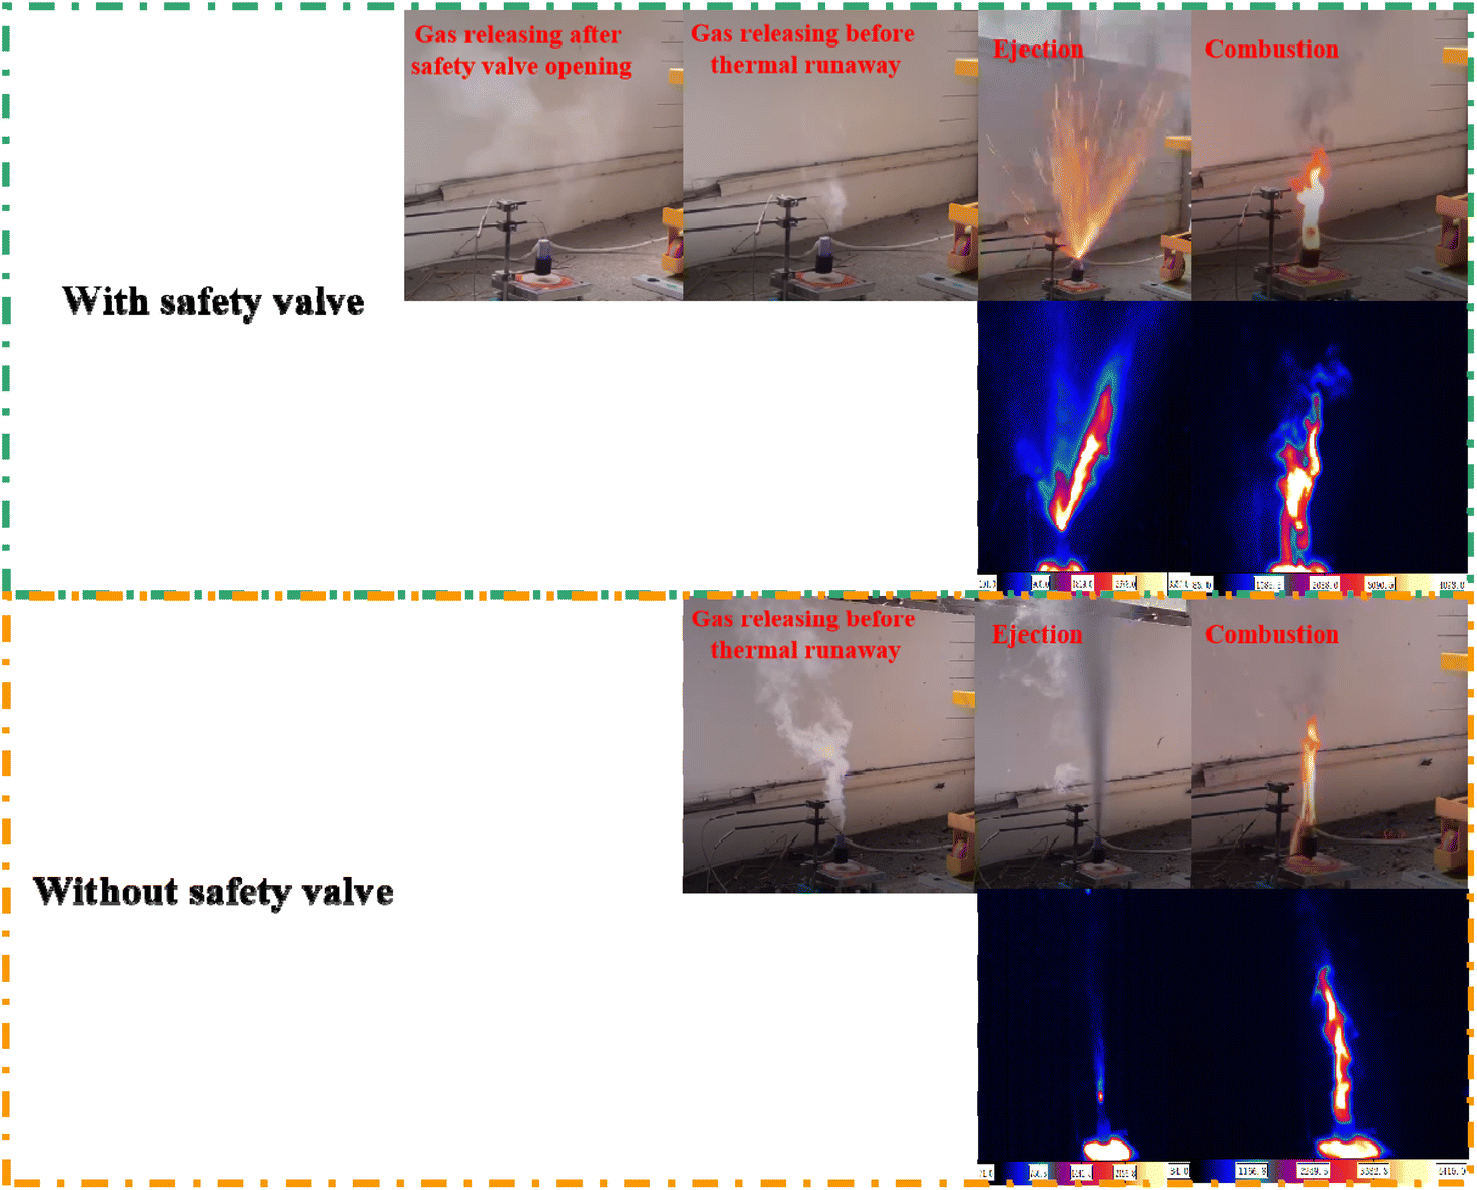 | ||
| Fig. 3 Typical phenomena of 21700-size cells with/without safety valves during the over-heating tests. | ||
In addition, Fig. 4 depicts the progress of the audio intensity of the two cell samples along with the thermal runaway. Compared to the cell with a safety valve, the cell in the absence of the safety valve made a noise until the encounter of ejection and thermal runaway. In most cases, the cracking noise caused by the safety valve opening might be employed as a warning alerting users to an impending thermal risk since that could be clearly heard by ears.17–19 When thermal concerns develop, the cell's much quieter thermal runaway behavior without a safety valve may pose a bigger danger.
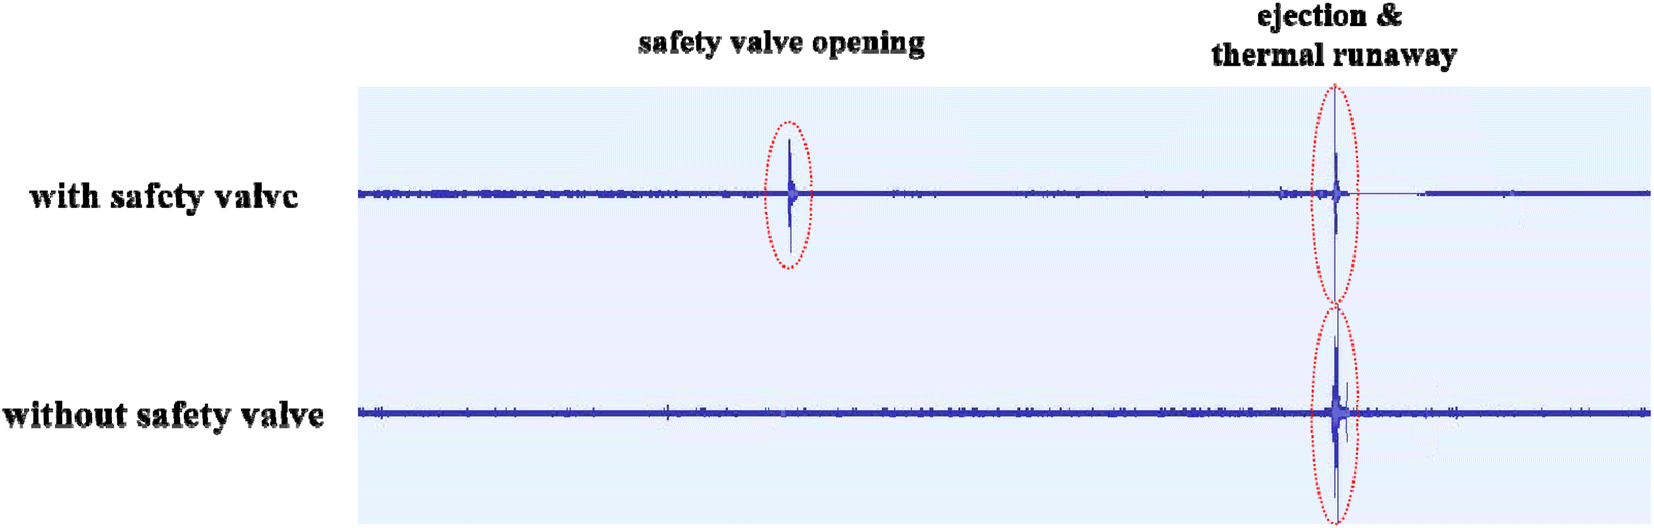 | ||
| Fig. 4 The evolution of audio intensity of the two cell samples in the process of over-heating tests. | ||
Besides the over-heating tests, the effect of safety valves on the safety performance of 21700-size cells in the ARC and overcharge tests is also demonstrated. Three crucial temperatures (Ts, the cell's self-heating temperature (dT/dt ≥ 0.02 °C min−1); Tr, the cell's thermal runaway temperature (dT/dt ≥ 2 °C min−1); Tm, the cell's maximum temperature during testing) were determined in the ARC tests.20,21 Table 3 lists the values of several crucial parameters. As shown in Fig. 5(a), the temperature rise rate of the cell without a safety valve was always larger than the critical value of self-heating (0.02 °C min−1) due to the heat generation of cells. The cell in the presence of a safety valve started the self-heating at around 90 °C. This value was somewhat lower than that of the 18650-size cells with the same chemistries,22 indicative of the worse thermal hazard of 21700-size cells at elevated temperatures. Beyond that, the cell without a safety valve occurred the thermal runaway at a lower temperature (144.9 vs. 146.5 °C); moreover its peak temperature obtained during the test was also larger (552.8 vs. 534.1 °C). Apparently, the presence of the safety valve was helpful to enhance the safety performance of 21700-size cells when subjected to the high temperature at ARC tests. Furthermore, Fig. 5(b) compares the overcharge testing results of the fixed cells. It can be found that there were huge differences between the thermal behaviors of these two cells. The cell with a safety valve did not encounter the thermal runaway when overcharged. Due to the presence of a safety valve, overcharging would be interrupted once the safety valve was activated by the increasing internal pressure of cells.23 Thereby, the peak temperature only reached 55 °C at 711 s; meanwhile, the cell voltage climbed to the upper range of the cell testing system (50 V) as a result of open circuiting. Conversely, the cell without a safety valve occurred the thermal runaway with the proceeding of overcharge, whose surface temperature climbed to a peak value of 537 °C at 1226 s. The overcharge result implies that the safety valve significantly impacted the thermal behavior of 21700-size cells at overcharge conditions, which could even prevent the occurrence of thermal runaway.
| Parameter | Ts (°C) | Tr (°C) | Tm (°C) |
|---|---|---|---|
| The cell with a safety valve | 90.0 | 146.5 | 534.1 |
| The cell without a safety valve | — | 144.9 | 552.8 |
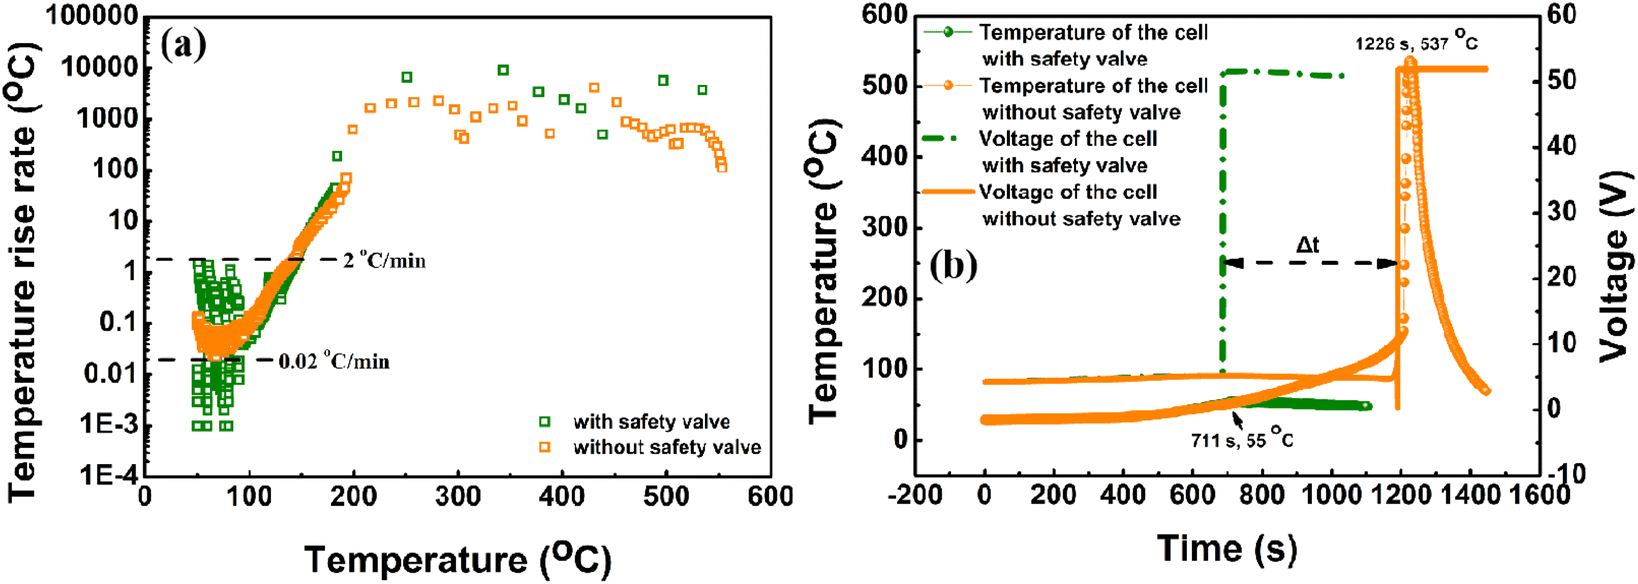 | ||
| Fig. 5 (a) ARC testing results and (b) overcharge testing results of lithium-ion cells with/without safety valves. | ||
3.2 Impact of safety valves on the thermal runaway behavior of cells with different states of charge
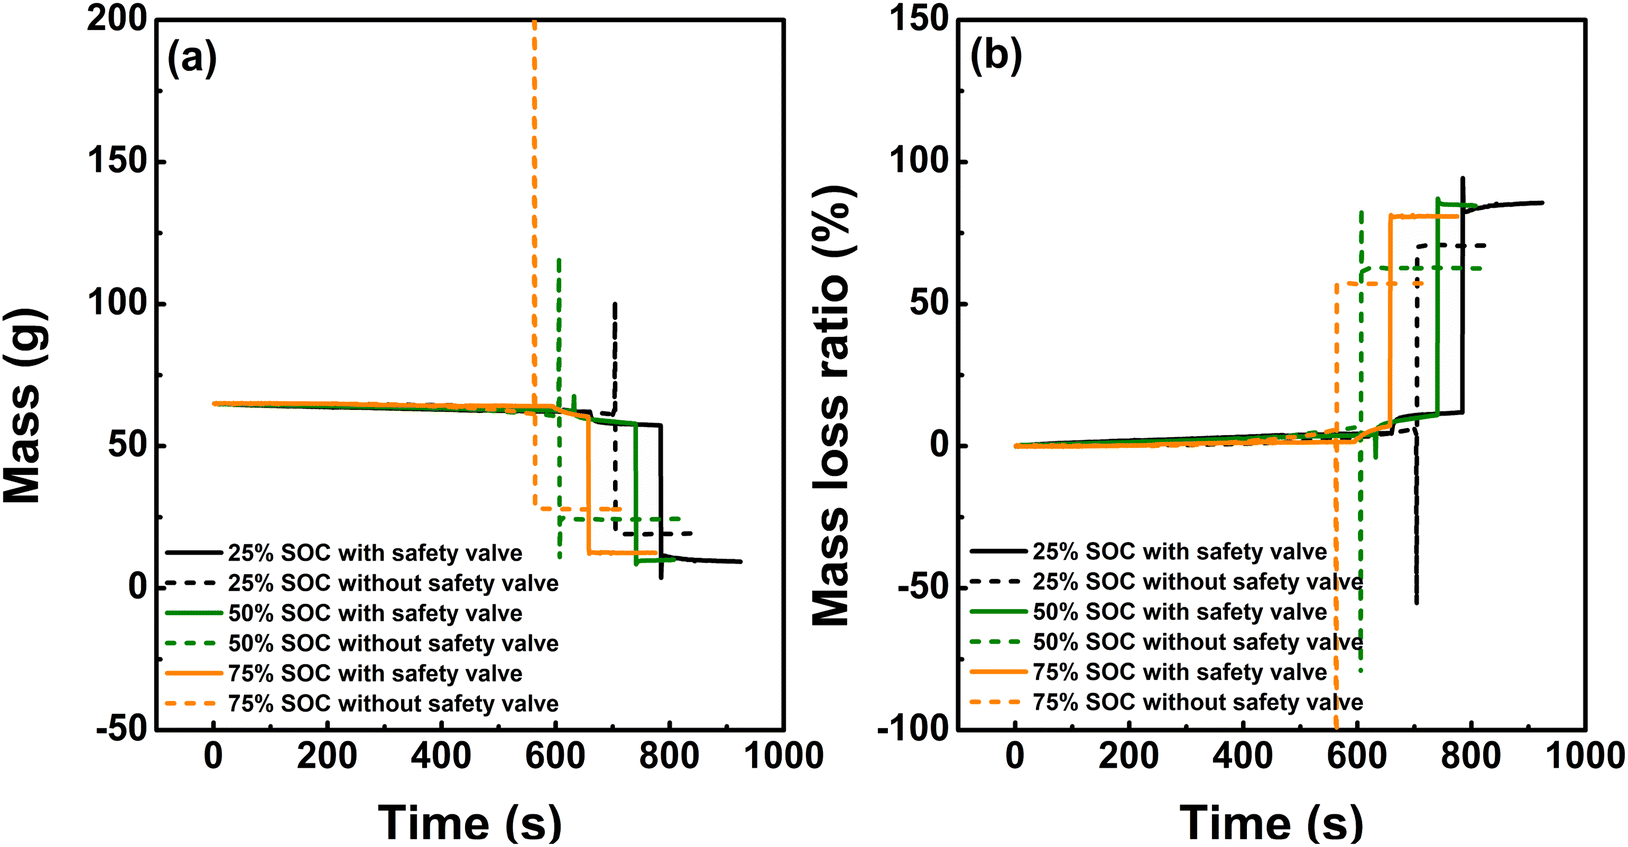
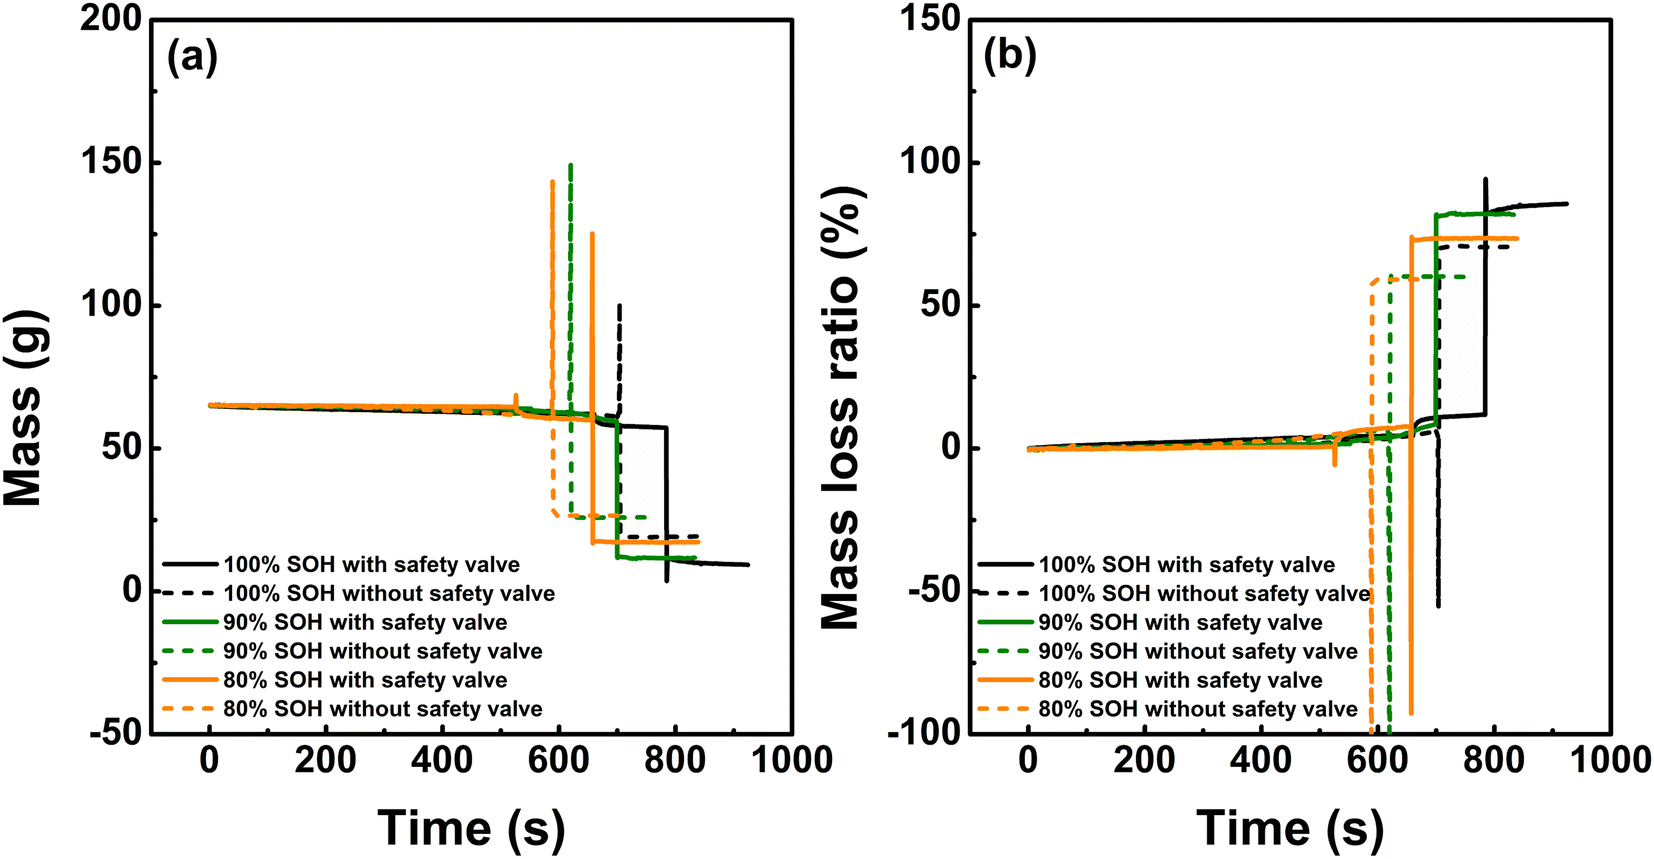
The result in Section 3.1 reveals that the safety valve effectively improves the safety performance of 21700-size cells when subjected to typical abusive environments. Following, the impact of safety valves on the thermal runaway behavior of cells with different SOCs and SOHs during the over-heating test would be discussed. Fig. 6 shows the surface temperature curves of cells with/without safety valves under different SOCs, the repetitive results are shown in Fig. S4.† Consistent to the results above, the cells in the absence of safety valves all underwent the thermal runaway earlier irrespective of the cell SOC. With the increasing the cell SOC, the thermal runaway behavior of cells evolved faster and earlier to encounter the thermal runaway. Table 4 lists the critical parameters of these cells in the thermal runaway process. Besides that, the mass changes of the fixed cells along with the thermal runaway are correspondingly depicted in Fig. 7. To maintain the consistency, the initial mass of cells without safety valves was adjusted to be the same as that of the cells with safety valves, i.e., 65 g. Different from the cell with a safety valve, the cell in the absence of a safety valve only experienced an obvious mass decline in the whole process, corresponding to the occurrence of thermal runaway. The violent ejection and combustion took away some masses. By contrast, the cell with a safety valve appeared one more mass decline after the safety valve opening.24–26 Compared with the cell with a safety valve, it can be seen that the cell in the absence of safety valves exhibited a somewhat gentler mass loss during tests. Owing to the faster evolution of the thermal runaway behavior for the cell without a safety valve, the ejection and combustion of the cell was comparatively inhibited, and thereby fewer substances were consumed.11 On the other hand, it is showed that with the increase of the cell SOC, less cell mass would be lost. This may be ascribed to the worse thermal runaway behavior for the high-SOC cell which restrained the ongoing of thermal runaway reactions.
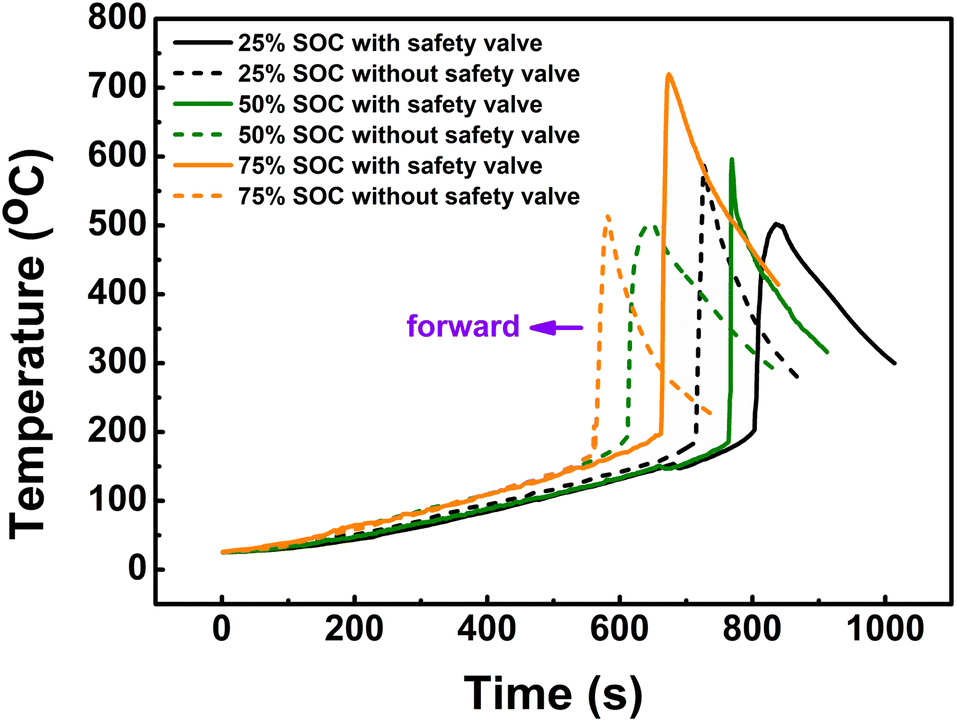 | ||
| Fig. 6 The surface temperature curves of the fixed cells in the process of thermal runaway. | ||
| Parameter | The 25% SOC cell with a safety valve | The 25% SOC cell without a safety valve | The 50% SOC cell with a safety valve | The 50% SOC cell without a safety valve | The 75% SOC cell with a safety valve | The 75% SOC cell without a safety valve |
|---|---|---|---|---|---|---|
| Time to thermal runaway (s) | 803 | 714 | 764 | 611 | 662 | 562 |
| Temperature to thermal runaway (°C) | 202 | 191 | 186 | 193 | 197 | 171 |
| Time to peak temperature (s) | 836 | 728 | 769 | 642 | 674 | 582 |
| Peak temperature (°C) | 502 | 588 | 596 | 502 | 720 | 516 |
| Mass loss (g) | 55.4 | 45.9 | 55.2 | 40.7 | 52.6 | 37.1 |
| Mass loss ratio (%) | 85.2 | 70.6 | 84.9 | 62.6 | 80.9 | 57.1 |
 | ||
| Fig. 7 (a) The mass changes of the fixed cells in the process of thermal runaway; (b) the mass loss ratio changes of the fixed cells in the process of thermal runaway. | ||
3.3 Impact of safety valves on the thermal runaway behavior of cells with different states of health
To comprehensively demonstrate the impact of safety valves on the safety performance of 21700-size cells, the thermal runaway behaviors of cells with different SOHs, i.e., under different aging degrees are revealed. The corresponding repetitive results are shown in Fig. S5.† Fig. 8 shows the surface temperature curves of the fixed cells (100% SOH, 90% SOH and 80% SOH) with/without safety valves in the over-heating tests. Similarly, the cells in the absence of safety valves all underwent the thermal runaway earlier irrespective of the cell SOH. That is, the safety valve play an important role in the safety performance of 21700-size cells no matter how severe degradation they experienced. Besides that, it is illustrated that the thermal runaway behavior of cells evolved faster and earlier to encounter the thermal runaway as the cell SOH declined. It indicates that the aged cells might have comparatively worse thermal runaway hazards at elevated temperatures. Furthermore, the mass change curves of these cells during tests are shown in Fig. 9. The overall mass variation of these cells is similar to the result discussed in Section 3.2. With the worsening of cell aging, it is shown that the cell was prone to experiencing less mass loss. As a result of the sharper evolution of the thermal runaway, the according side reactions inside the cell without a safety valve were somewhat restrained such that fewer substances were consumed. Table 4 displays the critical parameters of thermal runaway for the fixed cells.
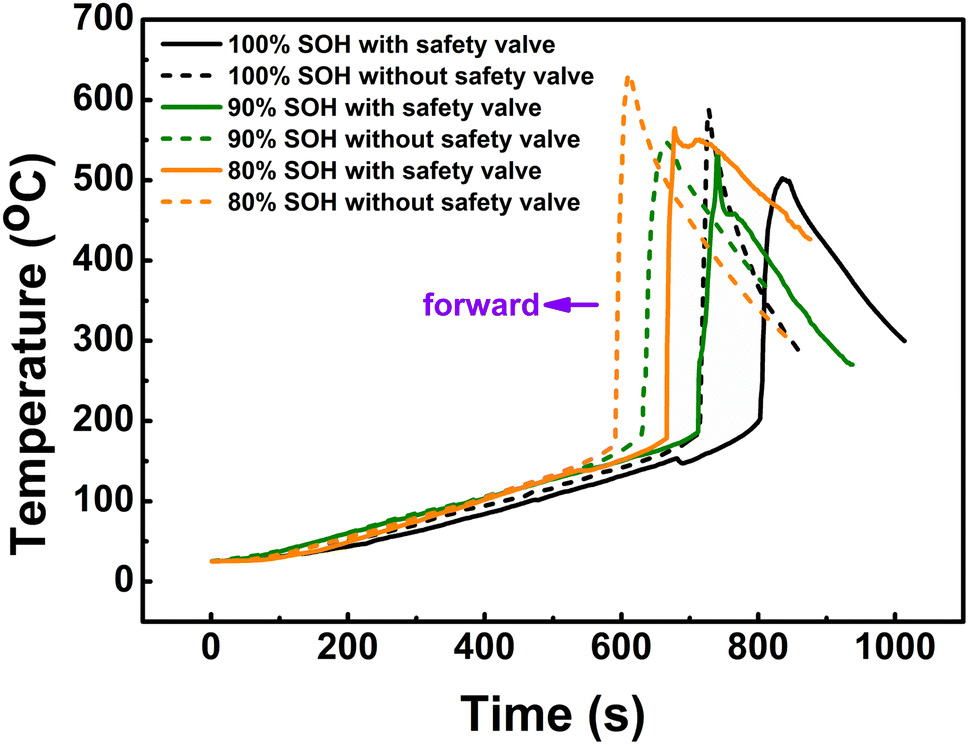 | ||
| Fig. 8 The surface temperature curves of the fixed cells in the process of thermal runaway. | ||
 | ||
| Fig. 9 (a) The mass changes of the fixed cells in the process of thermal runaway; (b) the mass loss ratio changes of the fixed cells in the process of thermal runaway. | ||
Considering the importance of the temperature to thermal runaway and the time to thermal runaway for the cell thermal runaway analysis, Fig. 10 summarizes the temperatures to thermal runaway and α of the cells discussed above. Whereby, α is specified as given in eqn (1) and (2) to determine the advancement ratio of the time to thermal runaway between cells with and without a safety valve.8 The larger the α, the greater the impact caused by the safety valve. Overall, the cell in the absence of a safety valve would occur thermal runaway at a lower temperature, indicative of the great impact of the safety valve on the safety performance of 21700-size cells. With the increase of SOC and/or the decline of SOH, it can be found that the temperature to thermal runaway decreased gradually; that is, the cell stored more energy or experienced worse aging possessed severer thermal runaway hazards under abusive conditions that might undergo thermal runaway at a lower temperature. In addition, it is shown that the values of α for these cells fluctuated around 15%; namely the removal of a safety valve might cause the cell thermal runaway occurring earlier by ∼15%. To conclude, the safety valve as an internal protective precaution for 21700-size cells, impacts significantly on the cell safety performance.
| Δt = ts − tns | (1) |
 | (2) |
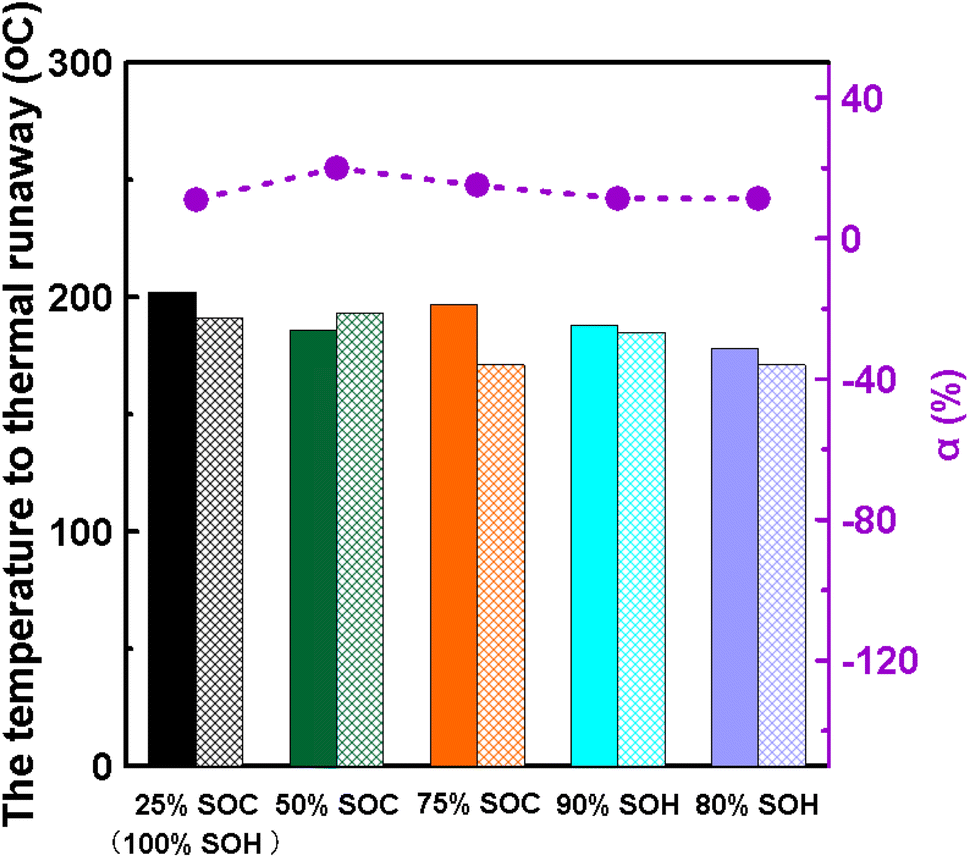 | ||
| Fig. 10 Comparison of temperatures to thermal runaway and α of the fixed cells. | ||
4. Conclusions
With the popularity of new-format lithium-ion cells such as 21700 and 46800, it is of great significance to attain better insight into the safety performance of these cells. This work performed a series of testing to demonstrate the impact of safety valves on the thermal runaway characteristics of 21700-size cells under typical abusive conditions involving over-heating tests, ARC tests and overcharge tests; in addition, the according impact of safety valves on cells with different SOCs and SOHs is also revealed. Given the results of the cell surface temperature, experimental phenomenon, audio intensity, cell mass, and some crucial thermal runaway parameters, the following conclusions were made:
1. The safety valve impacted significantly on the thermal runaway features of 21700-size cells. The absence of a safety valve would cause an earlier thermal runaway during the over-heating tests. Moreover, the according cell showed worse thermal runaway risks and hazards, with a lower temperature to thermal runaway, a higher peak temperature and a larger the maximum temperature rise rate. The existence of a safety valve could even prevent the cell from overcharge-induced thermal runaway, by interrupting the continuation of overcharge.
2. The 21700-size cell with a larger SOC underwent the thermal runaway earlier, accompanied by a lower temperature to thermal runaway and a fewer mass loss in the process of thermal runaway.
3. The 21700-size cell with a lower SOH is prone to undergoing the thermal runaway at a lower temperature; meanwhile less mass was lost as a result of the faster evolution of thermal runaway.
4. The advancement ratio of the time to thermal runaway between cells with and without a safety valve maintained around 15%.
In summary, the safety valve as a built-in protective device for 21700-size cells, had a great impact on the thermal runaway characteristics of cells when subjected to typical abusive situations. It effectively reduce the risk and hazards associated with cell thermal runaway. Moreover, the audio signal when a safety valve was activated can serve as an early warning of potential thermal runaway hazards. Thereby, greater investigation into the impact of the safety valve on the safety performance of cells is required, especially with the emergence of more new-format cells.
Author contributions
Linqun Ouyang: conceptualization, methodology, writing – original draft preparation. Jian Huang: investigation, visualization. Dongxu Ouyang: writing – reviewing and editing, funding acquisition.Conflicts of interest
None.Acknowledgements
The National Natural Science Foundation of China (No. 52204213, 52272396), the China Postdoctoral Science Foundation (No. 2022M711602), the Opening Fund of State Key Laboratory of Fire Science (SKLFS) under Grant No. HZ2022-KF07, and the Jiangsu Project Plan for Outstanding Talents Team in Six Research Fields (No. TD-XNYQC-002).References
- The global lithium-ion battery industry overview and development status analysis in 2022, https://zhuanlan.zhihu.com/p/522410910, accessed on October 14, 2022 Search PubMed.
- D. Ouyang, M. Chen and Q. Huang, et al., A review on the thermal hazards of the lithium-ion battery and the corresponding countermeasures, Appl. Sci., 2019, 9(12), 2483 CrossRef CAS.
- D. Lisbona and T. Snee, A review of hazards associated with primary lithium and lithium-ion batteries, Process Saf. Environ. Prot., 2011, 89(6), 434–442 CrossRef CAS.
- J. Wang, H. Zhou and Z. Wang, et al., Constructing hierarchical structure based on LDH anchored boron-doped g-C3N4 assembled with MnO2 nanosheets towards reducing toxicants generation and fire hazard of epoxy resin, Composites, Part B, 2022, 229, 109453 CrossRef CAS.
- J. Wang, Y. Wei and Z. Wang, et al., MOFs-derived self-sacrificing template strategy to double-shelled metal oxides nanocages as hierarchical interfacial catalyst for suppressing smoke and toxic gases releases of epoxy resin, Chem. Eng. J., 2022, 432, 134328 CrossRef CAS.
- P. G. Balakrishnan, R. Ramesh and T. P. Kumar, Safety mechanisms in lithium-ion batteries, J. Power Sources, 2006, 155(2), 401–414 CrossRef CAS.
- P. V. Chombo and Y. Laoonual, A review of safety strategies of a Li-ion battery, J. Power Sources, 2020, 478, 228649 CrossRef CAS.
- D. Ouyang, J. Weng and M. Chen, et al., Impact of charging and charging rate on thermal runaway behaviors of lithium-ion cells, J. Electrochem. Soc., 2021, 168(12), 120510 CrossRef CAS.
- X. Feng, M. Ouyang and X. Liu, et al., Thermal runaway mechanism of lithium ion battery for electric vehicles: A review, Energy Storage Mater., 2018, 10, 246–267 CrossRef.
- F. A. Mier, R. Morales and C. A. Coultas-McKenney, et al., Overcharge and thermal destructive testing of lithium metal oxide and lithium metal phosphate batteries incorporating optical diagnostics, J. Energy Storage, 2017, 13, 378–386 CrossRef.
- D. Ouyang, J. Weng and M. Chen, et al., What a role does the safety vent play in the safety of 18650-size lithium-ion batteries?, Process Saf. Environ. Prot., 2022, 159, 433–441 CrossRef CAS.
- J. Zhu, X. Zhang and E. Sahraei, et al., Deformation and failure mechanisms of 18650 battery cells under axial compression, J. Power Sources, 2016, 336, 332–340 CrossRef CAS.
- D. P. Finegan, E. Darcy and M. Keyser, et al., Identifying the cause of rupture of Li-Ion batteries during thermal runaway, Adv. Sci., 2018, 5(1), 1700369 CrossRef PubMed.
- S. Ogunfuye, H. Sezer and A. O. Said, et al., An analysis of gas-induced explosions in vented enclosures in lithium-ion batteries, J. Energy Storage, 2022, 51, 104438 CrossRef.
- G. Wang, D. Kong and P. Ping, et al., Revealing particle venting of lithium-ion batteries during thermal runaway: A multi-scale model toward multiphase process, eTransportation, 2023, 100237 CrossRef.
- D. Ouyang, J. Weng and M. Chen, et al., Electrochemical and thermal characteristics of aging lithium-ion cells after long-term cycling at abusive-temperature environments, Process Saf. Environ. Prot., 2022, 159, 1215–1223 CrossRef CAS.
- P. Liu, H. Sun and Y. Qiao, et al., Experimental study on the thermal runaway and fire behavior of LiNi0.8Co0.1Mn0.1O2 battery in open and confined spaces, Process Saf. Environ. Prot., 2022, 158, 711–726 CrossRef CAS.
- W. Liu, F. Zhao and S. Liu, et al., Chemical analysis of the cause of thermal runaway of lithium-ion iron phosphate batteries, J. Electrochem. Soc., 2021, 168(6), 060507 CrossRef CAS.
- Z. Liu, X. Guo and N. Meng, et al., Study of thermal runaway and the combustion behavior of lithium-ion batteries overcharged with high current rates, Thermochim. Acta, 2022, 715, 179276 CrossRef CAS.
- M. Lammer, A. Königseder and V. Hacker, Holistic methodology for characterisation of the thermally induced failure of commercially available 18650 lithium ion cells, RSC Adv., 2017, 7(39), 24425–24429 RSC.
- C. Zhao, T. Wang and Z. Huang, et al., Experimental study on thermal runaway of fully charged and overcharged lithium-ion batteries under adiabatic and side-heating test, J. Energy Storage, 2021, 38, 102519 CrossRef.
- J. Liu, Q. Duan and M. Ma, et al., Aging mechanisms and thermal stability of aged commercial 18650 lithium ion battery induced by slight overcharging cycling, J. Power Sources, 2020, 445, 227263 CrossRef CAS.
- D. Ouyang, J. Weng and M. Chen, et al., A comparative study on safety and electrochemical characteristics of cylindrical lithium-ion cells with various formats, Process Saf. Environ. Prot., 2022, 161, 126–135 CrossRef CAS.
- Z. Huang, C. Zhao and H. Li, et al., Experimental study on thermal runaway and its propagation in the large format lithium ion battery module with two electrical connection modes, Energy, 2020, 205, 117906 CrossRef CAS.
- M. Chen, J. Liu and D. Ouyang, et al., Experimental investigation on the effect of ambient pressure on thermal runaway and fire behaviors of lithium-ion batteries, Int. J. Energy Res., 2019, 43(9), 4898–4911 CrossRef CAS.
- H. Wang, Z. Du and L. Liu, et al., Study on the thermal runaway and its propagation of lithium-ion batteries under low pressure, Fire Technol., 2020, 56(6), 2427–2440 CrossRef.
Footnote |
| † Electronic supplementary information (ESI) available. See DOI: https://doi.org/10.1039/d3ra01374j |
| This journal is © The Royal Society of Chemistry 2023 |