 Open Access Article
Synthesis and characterization of ammonium-based protic ionic liquids for carbon dioxide absorption†
Asyraf Hanim Ab Rahimab,
Normawati M. Yunus *ab,
Zahirah Jaffarab,
Muhammad Faizadmesa Allimb,
Nurhidayah Zulakha Othman Zailaniab,
Shazri Amirah Mohd Fariddudinb,
Noraini Abd Ghaniab and
Mursyidah Umarc
aInstitute of Contaminant Management, Centre for Research in Ionic Liquid (CORIL), Universiti Teknologi PETRONAS, 32610, Seri Iskandar, Perak, Malaysia. E-mail: normaw@utp.edu.my
bDepartment of Fundamental and Applied Sciences, Universiti Teknologi PETRONAS, 32610, Seri Iskandar, Perak, Malaysia
cDepartment of Petroleum Engineering, Faculty of Engineering, Universitas Islam Riau, Jalan Kaharuddin Nasution, No. 113 Pekanbaru, Riau 28284, Indonesia
First published on 9th May 2023
Abstract
A series of ammonium-based protic ionic liquids (APILs) namely ethanolammonium pentanoate [ETOHA][C5], ethanolammonium heptanoate [ETOHA][C7], triethanolammonium pentanoate [TRIETOHA][C5], triethanolammonium heptanoate [TRIETOHA][C7], tributylammonium pentanoate [TBA][C5] and tributylammonium heptanoate [TBA][C7] was synthesized via proton transfer. Their structural confirmation and physiochemical properties namely thermal stability, phase transition, density, heat capacity (Cp) and refractive index (RI) have been determined. Specifically, [TRIETOHA] APILs have crystallization peaks ranging from −31.67 to −1.00 °C, owing to their large density values. A comparison study revealed the low Cp values of APILs in comparison to monoethanolamine (MEA) which could be advantageous for APILs to be used in CO2 separation during recyclability processes. Additionally, the performance of APILs toward CO2 absorption was investigated by using a pressure drop technique under a pressure range of 1–20 bar at 298.15 K. It was observed that [TBA][C7] recorded the highest CO2 absorption capacity with the value of 0.74 mole fraction at 20 bar. Additionally, the regeneration of [TBA][C7] for CO2 absorption was studied. Analysis of the measured CO2 absorption data showed marginal reduction in the mole fraction of CO2 absorbed between fresh and recycled [TBA][C7] thus proving the promising potential of APILs as good liquid absorbents for CO2 removal.
Introduction
The utilization of natural gas as an alternative fuel is essential in order to mitigate global climate change caused by significant carbon dioxide (CO2) emission resulting from fossil fuel combustion. According to Safari and co-workers, natural gas plays a vital role as a transition fuel in our process of dealing with high energy demand.1 Generally, natural gas contains a mixture of various gases such as methane (CH4), nitrogen (N) and CO2.2 The presence of CO2 in natural gas normally leads to pipeline corrosion due to formation of carbamic acid and reduces the burning velocity due to its high specific capacity. Therefore, highly efficient technology for CO2 removal from natural gas is essential to improve the heating value of the natural gas streamline.One of the common techniques for CO2 removal is via chemical absorption system where the reversible chemical reactions occurred conveniently at low temperatures and high pressure.3 Since decades ago, aqueous alkanolamine solutions such as monoethanolamine (MEA) and diethanolamine (DEA) were extensively used due to their low cost, safe to handle and accessibility.3,4 However, the utilization of alkanolamine solutions is limited to their highly volatile and corrosive properties, in addition to their high energy consumption for absorbent regeneration process.5 Dawson and co-workers also reported the loss of small amount of DEA due to its volatile property which likely leads to the pipeline corrosion issue.6
The interest in utilizing ionic liquids (ILs) as solvents for CO2 absorption has been growing mainly due to their unique properties which are flexible designability,7 high thermal stability, wide liquidous range, negligible vapor pressure and non-flammability.8 The extremely low vapor pressure of ILs suggests that losing of liquid absorbent during recyclability process could be avoided. Since the last decades, hundreds of literature related to the room temperature ILs (RTILs) for CO2 solubility were published, mainly involving class of imidazolium,9 pyridinium10 and pyrrolidinium.11 These cations combine with anions namely bis(trifluoromethylsulfonyl)imide (NTf2) and hexafluorophosphate (PF6) provide high CO2 uptake compared to nitrate (NO3) and dicyanamide (DCN).12 However, despite incredible performance of RTILs, these types of ILs suffer some drawbacks. The synthesis and purification steps are lengthy with some ILs requiring complicated synthesis route thus increasing the production cost.13
Amino acid based ILs (AAILs) were first introduced by Fukumoto and co-workers in an effort to gain functionalized ILs through simple methods.14 On the other hand, the presence of amines in AAILs is expected to be able to improve the CO2 absorption capacity as its mechanism mimics the MEA and DEA but with better recovery yield due to its low vapor pressure. Apart from that, AAILs are biodegradable, less corrosive, stable against oxidative degradation and offer fast kinetic CO2 absorption due to their low viscosity values. Numerous AAILs such as 1-(3-aminopropyl)-3-(2-aminoethyl)imidazolium alaninate [Apaeim][Ala],15 trihexyl(tetradecyl)ammonium lysinate [N66614][Lys],16 1-ethyl-3-methylimidazolium alanate [EMIM][Ala] and 1-ethyl-3-methylimidazolium glycinate [EMIM][Gly]17 have been utilized for CO2 absorption. Nevertheless, some AAILs are highly viscous thus reducing the rate of CO2 absorption capacity.
Nowadays, protic ILs (PILs) had gained attention due to their simple synthesis route and affordable reactants.18 According to Greaves and Drummond, PILs are formed through proton transfer that occur between Brønsted acid and Brønsted base.19 Apart from a straightforward synthesis process, PILs also do not undergo decomposition stage before boiling point due to the simple mechanism of proton transfer from cation to anion.19 This results in the reformation the original acid and base neutral species. Our previous work had reported the potential ammonium-based protic ILs for CO2 absorption in which bis(2-ethylhexyl) ammonium butyrate [BEHA][BA] had demonstrated higher mole fraction of CO2 absorption capacity, 0.486 in comparison to less than 0.30 by [C4py][NTf2] at the same reaction conditions.10,20
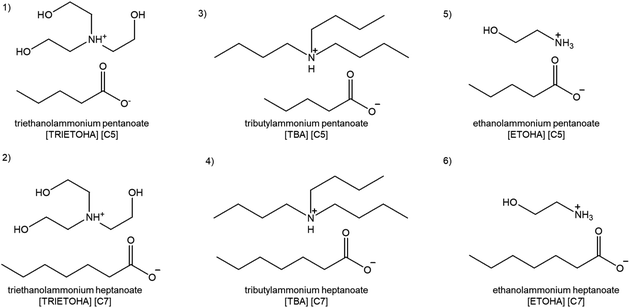
In light of this, this paper reports the continuation of our work of synthesis, characterization and CO2 absorption with six new ammonium-based PILs (APILs) containing carboxylate anions as shown in Fig. 1. All APILs had undergone characterizations including structural confirmation while thermal properties analyses comprising thermal stability, phase transition, heat capacity, refractive index and density were also completed and reported. The measurements of CO2 absorption for each APIL at pressures 1 to 20 bars and temperature 298.15 K were conducted. The recyclability and reusability of the APIL that displayed the highest CO2 absorption capacity were also conducted and discussed herein.
Experimental
Materials
All chemicals of analytical grade were used without additional purification process for APILs synthesis and CO2 absorption. The CAS number, source and chemical purity are as follow: ethanolamine (141-43-5, Merck, 98%), triethanolamine (102-71-6, Merck, 98%), tributylamine (102-82-9, Merck, 98.5%), pentanoic acid (109-52-4, Merck, 99%) and heptanoic acid (111-14-8, Merck, 99%).Synthesis of APILs
The synthesis of APILs was conducted based on our previous method as shown in Fig. 2 with slight modifications.20 In this work, the reaction was set up in an ice bath. An equal molar of acid was added dropwise into 50 mL round bottom flask containing 0.5 mol of base. The mixture was then continuously stirring at 250 rpm in room temperature for 24 hours to ensure all reactants were completely reacted. The resulting viscous liquid was dried using rotary evaporator and store in vacuum cabinet until further use.The combination of acids and bases produced six APILs namely ethanolammonium pentanoate [ETOHA][C5], triethano-lammonium pentanoate [TRIETOHA][C5], tributylammonium pentanoate [TBA][C5], ethanolammonium heptanoate [ETOHA][C7], triethanolammonium heptanoate [TRIETOHA][C7] and tributylammonium heptanoate [TBA][C7], which all exist as liquid at room temperature.
Characterization
[ETOHA][C5]: 1H NMR (500 MHz, CdCl3): δ 3.762 [t, 2H, CH2-OH], 2.993 [t, 2H, CH2-NH2], 1.516 [t, 2H, CH2-COOH], 1.470 [m, 2H, CH2], 1.323 [m, 2H, CH2], 1.293, [t, 3H, CH3], water content: 2.48%.
[ETOHA][C7]: 1H NMR (500 MHz, CdCl3): δ 3.753 [t, 2H, CH2-OH], 2.972 [t, 2H, CH2-NH2], 2.098 [t, 2H, CH2-COOH], 1.469 [m, 2H, CH2], 1.295 [m, 6H, CH2], 0.873, [t, 3H, CH3], water content: 3.47%.
[TRIETOHA][C5]: 1H NMR (500 MHz, CdCl3): δ 3.739 [t, 6H, CH2-OH], 2.983 [t, 6H, CH2-NH2], 2.173 [m, 2H, CH2-COOH], 1.486 [m, 2H, CH2], 1.326 [m, 2H, CH2], 0.874, [t, 3H, CH3], water content: 1.31%.
[TRIETOHA][C7]: 1H NMR (500 MHz, CdCl3): δ 3.726 [t, 6H, CH2-OH], 2.957 [t, 6H, CH2-NH2], 2.161 [m, 2H, CH2], 1.508 [t, 2H, CH2-COOH], 1.270 [m, 6H, CH2], 0.842 [t, 3H, CH3], water content: 2.18%.
[TBA][C5]: 1H NMR (500 MHz, CdCl3): δ 2.633 [t, 6H, CH2-NH2], 2.078 [t, 2H, CH2-COOH], 1.427 [m, 8H, CH2], 1.214 [m, 8H, CH2], 1.200 [t, 12H, CH3], water content: 0.41%.
[TBA][C7]: 1H NMR (500 MHz, CdCl3): δ 2.644 [t, 6H, CH2-NH2], 2.071 [t, 2H, CH2-COOH], 1.400 [m, 8H, CH2], 1.187 [m, 12H, CH2], 0.822 [t, 12H, CH3], water content: 0.20%.
 | (1) |
| v = Kt | (2) |
| η = ρ × v | (3) |
CO2 absorption measurement
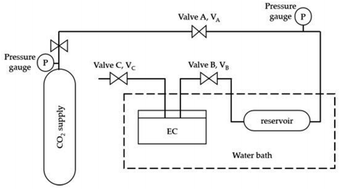
The solubility of CO2 in APILs was conducted by utilizing pressure drop technique using a solubility cell. Fig. 3 shows the schematic diagram of solubility cell used in this study. Generally, the pre-weighted amount of APILs was loaded into 15 mL equilibrium cell and degassed using a vacuum pump. The equilibrium cell, made up from stainless steel was immersed in thermostatic water bath to maintain the temperature at 298.15 K. Meanwhile, the CO2 in gas vessel was set up into desired pressure in reservoir (VA–VB) and was allowed to stabilize. The CO2 was then introduced into the equilibrium cell by opening VB and the system was maintained at sufficient time (120–180 minutes) until it reached an equilibrium state.The performance of APILs in CO2 absorption was calculated based on eqn (4):
 | (4) |
 | (5) |
Besides that, the solubility of CO2 in APILs was determined by using Henry's law constant (KH) in which the experimental data was fitted into linear regression of eqn (6):
| PCO2 = HxCO2 | (6) |
Furthermore, 13C NMR and FTIR spectroscopy analyses were conducted to evaluate the possible reaction pathway between CO2 and APILs. In this study, both analyses were done after 20 minutes of CO2 absorption process.
The recyclability of APILs towards CO2 absorption was conducted according to the method suggested by Li and co-workers.21 APILs was transferred into an evaporating flask in which CO2 was released by using rotary evaporator at the temperature 333.15 K. The recycled APILs was left under vacuum for 2 hours prior to reuse in CO2 absorption analysis. In this work, the recyclability test was conducted for a single cycle only.
Results and discussions
Thermal stability of APILs
TGA analysis was conducted in order to study the thermal decomposition behaviour of APILs. Basically, the APILs were categorized by the cation namely [ETOHA]+, [TRIETOHA]+ and [TBA]+ to facilitate the findings discussion. Analysis on TG curves for all APILs showed similar pattern with sharp shouldering around 191.42–291.88 °C. In addition, the thermal stability of APILs increased with the alkyl chain of anion as shown in Table 1. This result is in agreement with work done by Chhotaray and co-workers in which they reported an improvement in thermal stability of lactam-based ILs as the number of anion carbon atom increased from formate to hexanoate.22 Besides that, according to Othman Zailani et al., the longer the anion alkyl chain, the higher the amount of energy required to cleave the neighbouring bond.23 Table 1 shows the thermal stability of APILs presented in the forms of onset (To) and decomposition temperatures (Tp). In particular, To is an intersection between baseline and tangent of sample weight against temperature while Tp indicates the temperature where the maximum weight loss occurred.24 Further analysis revealed that APILs with [TRIETOHA]+ cation possessed high values of To and Tp, signifying their superior thermal stability compared to [ETOHA]+ and [TBA]+ APILs and this finding could be attributed to the bulky size of [TRIETOHA]+ in comparison to other cations.| APILs | To (°C) | Tp (°C) |
|---|---|---|
| [ETOHA][C5] | 162.2 | 191.42 |
| [ETOHA][C7] | 168.86 | 197.63 |
| [TRIETOHA][C5] | 256.18 | 280.71 |
| [TRIETOHA][C7] | 267.45 | 291.88 |
| [TBA][C5] | 137.4 | 168.31 |
| [TBA][C7] | 149.5 | 195.86 |
Density of APILs
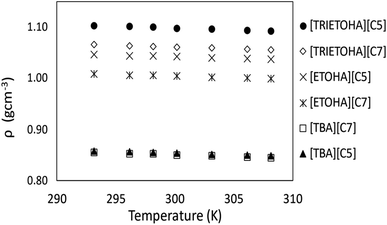
Generally, ILs density decreases gradually with increasing temperature.25 Theoretically, elevated temperature weakens the intermolecular forces that exist between ions thus causing molecules to move apart from each other.26 This phenomenon will increase the molecules volume which then will result in low density value of liquids at high temperatures. In this work, the APILs density measurement was conducted in triplicate and the result is shown in ESI data† (Table S1†). Fig. 4 shows the average density values of APILs at the temperature range of 293.15–333.15 K.Previous study had shown that, the density of PILs for common cations is affected by the length of anion alkyl chain.23 In this study, APILs with C7 anion own lower density values compared to APILs with C5 anion. Similar results were also reflected in the work conducted by Yunus and co-workers in which their density of PILs decreased with increasing of anion alkyl chain.20 The reduction of density in longer alkyl chain of APIL was caused by an increasing in interionic separation and low packing efficiency in their elongated anion structure.27 This contributed into an increasing of volume occupied by anion thus decreasing the density value of APILs with C7 anion. Besides that, less efficient packing structure of tributylammonium cation [TBA]+ had resulted in low density values of by [TBA][C5] and [TBA][C7] in comparison to APILs with [ETOHA]+ and [TRIETOHA]+.
The value of APILs density was then fitted based on eqn (7) as follows:
| ρ = A0 + A1T | (7) |
 | (8) |
| Ionic liquids | A0 | A1 | SD |
|---|---|---|---|
| [ETOHA][C5] | 1.2164 | −0.0006 | 0.0004 |
| [ETOHA][C7] | 1.7619 | −0.0006 | 0.0006 |
| [TRIETOHA][C5] | 1.3105 | −0.0007 | 0.0008 |
| [TRIETOHA][C7] | 1.2318 | −0.0006 | 0.0008 |
| [TBA][C5] | 1.0447 | −0.0006 | 0.0006 |
| [TBA][C7] | 1.0380 | −0.0007 | 0.0004 |
In the meantime, the thermal expansion coefficient (α) was calculated by using eqn (9) and the data were tabulated in Table 3. Generally, α is defined as the expansion amount of substance in reaction to a change in temperature.28 As oppose to previous work in which α increased as temperature increased,29 based on Table 3, the changes of α in this study is insignificant. This indicates that the α of APILs is independent of temperature. At 298.15 K, the α of APILs are in the range of 3.7 × 10⁻⁴ to 7.9 × 10⁻⁴ K−1, which is lower than common solvents such as acetone (1.10 × 10⁻³ K−1), chloroform (1.27 × 10⁻³ K−1) and ethyl acetate (1.38 × 10⁻³ K−1).
| αρ = 1/ρ × (∂ρ/∂T) = −(A1)/(A0 + A1T) | (9) |
 | (10) |
 | (11) |
| S° = 1246.5 × V + 29.5 | (12) |
| UPOT = 1981.2 × (ρ/M)1/3 + 103.8 | (13) |
| Temperature (K) | Molar mass (g mol−1) | α × 10−4 (K−1) | Vm × 102 | S° (J K−1 mol−1) | UPOT (K J mol−1) | V (nm3) | Rm (cm3 mol−1) | Vf (cm3 mol−1) |
|---|---|---|---|---|---|---|---|---|
| [ETOHA][C5] | 163.21 | |||||||
| 293.15 | 5.9 | 1.572 | 355.0 | 470.9 | 0.261 | 43.33 | 113.9 | |
| 296.15 | 5.9 | 1.575 | 355.5 | 470.7 | 0.261 | 43.33 | 114.1 | |
| 298.15 | 5.9 | 1.578 | 356.0 | 470.5 | 0.262 | 43.37 | 114.4 | |
| 300.15 | 5.9 | 1.580 | 356.5 | 470.3 | 0.262 | 43.39 | 114.6 | |
| 303.15 | 5.9 | 1.582 | 357.0 | 470.1 | 0.263 | 43.39 | 114.9 | |
| 306.15 | 5.9 | 1.585 | 357.6 | 469.9 | 0.263 | 43.40 | 115.1 | |
| 308.15 | 5.9 | 1.588 | 358.2 | 469.7 | 0.264 | 43.42 | 115.4 | |
| 313.15 | 5.9 | 1.591 | 358.9 | 469.4 | 0.264 | 43.40 | 115.7 | |
| 323.15 | 6.0 | 1.602 | 361.0 | 468.6 | 0.266 | 43.44 | 116.7 | |
| 333.15 | 6.0 | 1.610 | 362.8 | 468.0 | 0.267 | 43.43 | 117.6 | |
![[thin space (1/6-em)]](https://www.rsc.org/images/entities/char_2009.gif) |
||||||||
| [ETOHA][C7] | 191.27 | |||||||
| 293.15 | 3.7 | 1.901 | 422.9 | 448.4 | 0.316 | 51.73 | 138.3 | |
| 296.15 | 3.7 | 1.905 | 423.8 | 448.1 | 0.316 | 51.76 | 138.7 | |
| 298.15 | 3.7 | 1.908 | 424.5 | 447.9 | 0.317 | 51.79 | 139.0 | |
| 300.15 | 3.7 | 1.912 | 425.3 | 447.7 | 0.318 | 51.84 | 139.4 | |
| 303.15 | 3.7 | 1.915 | 426.0 | 447.5 | 0.318 | 51.84 | 139.7 | |
| 306.15 | 3.7 | 1.918 | 426.5 | 447.3 | 0.319 | 51.82 | 140.0 | |
| 308.15 | 3.7 | 1.921 | 427.0 | 447.2 | 0.319 | 51.83 | 140.2 | |
| 313.15 | 3.7 | 1.925 | 427.9 | 446.9 | 0.320 | 51.79 | 140.7 | |
| 323.15 | 3.7 | 1.937 | 430.4 | 446.2 | 0.322 | 51.81 | 141.9 | |
| 333.15 | 3.7 | 1.947 | 432.5 | 445.6 | 0.323 | 51.77 | 142.9 | |
![[thin space (1/6-em)]](https://www.rsc.org/images/entities/char_2009.gif) |
||||||||
| [TRIETOHA][C5] | 251.32 | |||||||
| 293.15 | 6.9 | 2.301 | 505.9 | 427.1 | 0.382 | 64.67 | 165.5 | |
| 296.15 | 6.9 | 2.307 | 506.9 | 426.9 | 0.383 | 64.72 | 165.9 | |
| 298.15 | 6.9 | 2.312 | 508.0 | 426.6 | 0.384 | 64.79 | 166.4 | |
| 300.15 | 6.9 | 2.316 | 508.9 | 426.4 | 0.385 | 64.84 | 166.8 | |
| 303.15 | 6.9 | 2.319 | 509.6 | 426.3 | 0.385 | 64.81 | 167.1 | |
| 306.15 | 6.9 | 2.323 | 510.4 | 426.1 | 0.386 | 64.80 | 167.5 | |
| 308.15 | 6.9 | 2.329 | 511.7 | 425.8 | 0.387 | 64.89 | 168.1 | |
| 313.15 | 7.0 | 2.337 | 513.2 | 425.4 | 0.388 | 64.90 | 168.8 | |
| 323.15 | 7.0 | 2.354 | 516.7 | 424.7 | 0.391 | 64.95 | 170.4 | |
| 333.15 | 7.0 | 2.366 | 519.1 | 424.1 | 0.393 | 64.86 | 171.7 | |
![[thin space (1/6-em)]](https://www.rsc.org/images/entities/char_2009.gif) |
||||||||
| [TRIETOHA][C7] | 279.37 | |||||||
| 293.15 | 5.7 | 2.650 | 577.9 | 412.3 | 0.440 | 74.22 | 190.7 | |
| 296.15 | 5.7 | 2.655 | 578.8 | 412.1 | 0.441 | 74.24 | 191.1 | |
| 298.15 | 5.8 | 2.658 | 579.7 | 411.9 | 0.441 | 74.29 | 191.6 | |
| 300.15 | 5.8 | 2.661 | 580.4 | 411.8 | 0.442 | 74.28 | 191.9 | |
| 303.15 | 5.8 | 2.664 | 581.0 | 411.7 | 0.442 | 74.22 | 192.2 | |
| 306.15 | 5.8 | 2.668 | 581.8 | 411.5 | 0.443 | 74.20 | 192.63 | |
| 308.15 | 5.8 | 2.673 | 582.8 | 411.4 | 0.444 | 74.24 | 193.1 | |
| 313.15 | 5.8 | 2.681 | 584.5 | 411.0 | 0.445 | 74.23 | 194.0 | |
| 323.15 | 5.8 | 2.691 | 586.4 | 410.7 | 0.447 | 74.00 | 195.1 | |
| 333.15 | 5.9 | 2.715 | 591.5 | 409.8 | 0.451 | 74.15 | 197.4 | |
![[thin space (1/6-em)]](https://www.rsc.org/images/entities/char_2009.gif) |
||||||||
| [TBA][C5] | 287.48 | |||||||
| 293.15 | 7.3 | 3.340 | 720.8 | 389.3 | 0.555 | 87.52 | 246.5 | |
| 296.15 | 7.3 | 3.350 | 722.9 | 389.1 | 0.556 | 87.56 | 247.4 | |
| 298.15 | 7.3 | 3.357 | 724.3 | 388.9 | 0.557 | 87.60 | 248.1 | |
| 300.15 | 7.3 | 3.361 | 725.1 | 388.8 | 0.558 | 87.55 | 248.5 | |
| 303.15 | 7.4 | 3.365 | 725.9 | 388.6 | 0.559 | 87.42 | 249.0 | |
| 306.15 | 7.4 | 3.370 | 727.1 | 388.5 | 0.560 | 87.34 | 249.7 | |
| 308.15 | 7.4 | 3.375 | 728.2 | 388.3 | 0.560 | 87.32 | 250.2 | |
| 313.15 | 7.4 | 3.387 | 730.5 | 388.0 | 0.562 | 87.25 | 251.4 | |
| 323.15 | 7.5 | 3.415 | 736.4 | 387.2 | 0.567 | 87.21 | 254.3 | |
| 333.15 | 7.5 | 3.445 | 742.6 | 386.4 | 0.572 | 87.17 | 257.3 | |
![[thin space (1/6-em)]](https://www.rsc.org/images/entities/char_2009.gif) |
||||||||
| [TBA][C7] | 315.53 | |||||||
| 293.15 | 7.9 | 3.741 | 803.9 | 378.8 | 0.621 | 98.48 | 275.6 | |
| 296.15 | 7.9 | 3.757 | 807.1 | 378.4 | 0.624 | 98.65 | 277.0 | |
| 298.15 | 7.9 | 3.76.1 | 808.0 | 378.3 | 0.625 | 98.61 | 277.5 | |
| 300.15 | 7.9 | 3.766 | 809.0 | 378.2 | 0.625 | 98.56 | 278.0 | |
| 303.15 | 8.0 | 3.773 | 810.5 | 378.0 | 0.627 | 98.51 | 278.8 | |
| 306.15 | 8.0 | 3.782 | 812.3 | 377.8 | 0.628 | 98.49 | 279.7 | |
| 308.15 | 8.0 | 3.789 | 813.7 | 377.6 | 0.629 | 98.50 | 280.4 | |
| 313.15 | 8.0 | 3.804 | 816.8 | 377.2 | 0.632 | 98.47 | 281.9 | |
| 323.15 | 8.1 | 3.833 | 822.9 | 376.5 | 0.636 | 98.35 | 284.9 | |
| 333.15 | 8.2 | 3.869 | 830.3 | 375.7 | 0.642 | 98.44 | 288.4 | |
Table 4 shows the values of Vm, V, S° and UPOT of APILs, calculated at 298.15–333.15 K. Based on Table 4, the values of Vm, V, and S° increase in the order of [ETOHA][C5] < [ETOHA][C7] < [TRIETOHA][C5] < [TRIETOHA][7] < [TBA][C5] < [TBA][C7] at all temperatures which are in accordance with the molar mass of the APILs. This indicates the apparent effect of molar mass towards Vm, V and S° instead of density value.31 Further analysis showed [TBA][C7] owns the highest Vm possibly due to its large cation size. Meanwhile, the strong anion–cation interaction that existed in small cation like ETOHA had contributed into its low Vm value. The same trend was also reflected in their V and Vf values. In contrary, analysis on UPOT showed the opposite trend. For example, [TBA][C7] with the highest molar mass than other APILs has the lowest UPOT value. This could be due to its larger size than other APILs leading into less packing of its ions which results in low UPOT. This result is in line with the work done by Khan and co-workers in which their ILs with large paratoluene sulfonate anion had the lowest UPOT value.30
| Ionic liquids | A2 | A3 | SD |
|---|---|---|---|
| [ETOHA][C5] | 1.5469 | −0.0003 | 0.0002 |
| [ETOHA][C7] | 1.5455 | −0.0003 | 0.0002 |
| [TRIETOHA][C5] | 1.5732 | −0.0003 | 0.0005 |
| [TRIETOHA][C7] | 1.5744 | −0.0003 | 0.0003 |
| [TBA][C5] | 1.5625 | −0.0004 | 0.0001 |
| [TBA][C7] | 1.5631 | −0.0004 | 0.0002 |
Other than that, for APILs with the same cation classification, the values of Vm, V and S° were observed to be strongly dependence on the chemical structure of the anion. It also has been identified that anion with longer alkyl chain (C7) has high Vm and V due to the presence of extra methylene group (–CH2) in carboxylate anion. At 298.15 K, the difference of V value between C5 and C7 anion for [ETOHA]+, [TRIETOHA]+ and [TBA]+ are 0.055, 0.057 and 0.068 nm3, respectively. For comparison purpose, we calculated the difference in V for APILs from literature which are [BEHA][C5] and [BEHA][C7].23 Correspondingly, the V difference between both APILs is 0.056 nm3 which in agreement with data obtained in this study thus supporting the contribution of extra -CH2 in C7 anion. Meanwhile, under different cation classification, the TBA-APILs own highest Vm, V and S° than TRIETOHA- and ETOHA-APILs due to the presence of CH3 in [TBA]+ cation.
Refractive index of APILs
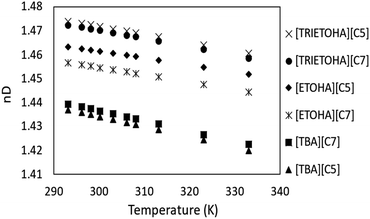
The refractive index (RI) demonstrates the dielectric response to an electrical field induced by electromagnetic field. In this work, the RI APILs was studied at temperature range 293.15–333.15 K, and the results are plotted in Fig. 5. The RI value of APILs was listed in the ESI data (Table S2).† It is important to note that RI values are solely reported based on the measured water contents of APILs. Based on Fig. 5, the values of RI for each APIL show a decreasing trend as temperature increases. These results are in line with the findings reported by Marcinkowski et al.32The trend of RI is also in agreement with temperature dependence of APILs density with the exception of APIL with [TBA] cation. As for RI values, the trend is in the order of [TRIETOHA][C5] > [TRIETOHA][C7] > [ETOHA][C5] > [ETOHA][7] > [TBA][C7] > [TBA][C5]. According to Seki and co-workers, the RI was not affected by cation molecular weight33 as the value decreased with increasing in number of carbon in anion which can be seen in TRIETOHA and ETOHA-based APILs. However, the order of RI is not retained for TBA-based APILs as it decreased with decreasing in anion molecular weight.
The RI of synthesized APILs was also fitted by least squares method using the linear eqn (14) while SD was calculated based on eqn (7). In eqn (14), A2 and A3 are the estimated values of fitting parameters. The data of fitting parameters and SD were tabulated in Table 4.
| nD = A2 + A3T | (14) |
Besides that, the RI value can be used to calculate the electronic polarizability or molar refraction (Rm) by applying Lorentz–Lorenz relation as shown in eqn (15) where nD is representing the RI value and Vm is the molar volume of the APILs. The calculated value of Rm can further be used to obtain free volume (Vf) of APILs, based on eqn (16). Vf is the unoccupied space between molecules which existed due to static and dynamic disorder of the chemical structure.34 It plays a crucial role for gas solubility in ILs. The Vf can be calculated based on equation.19,30
 | (15) |
| Vf = Vm − Rm | (16) |
As presented in Table 3, the values of Rm do not show a fixed trend as temperature increases. Thus, it can be concluded that the Rm is not temperature dependent. The same result was obtained by Zhang and co-workers in their study of ether-functionalization ILs coupled with amino acid anion as they concluded this behaviour was due to the induced dipole effect of ILs.35 As shown in Table 3, the Vf was found to be directly proportional to APILs's molar mass and increased as temperature increased. Correspondingly, [ETOHA][C5] that has the lowest molar mass owns the lowest Vf value. This is probably due to the small size of [ETOHA]+ cation compared to [TRIETOHA]+ and [TBA]+ thus had contributed into its low Vf.
Viscosity of APILs
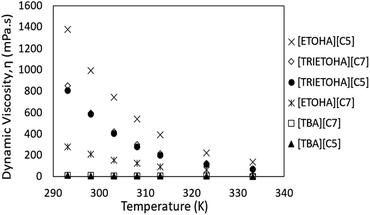
In this study, the viscosity of APILs was measured in triplicate at temperature range 293.15–333.15 K. Nonetheless, the viscosity analysis was solely reported by using the water contents as stated in the previous section. The experimental viscosity data is tabulated in the ESI data (Table S3).† Fig. 6 shows the dynamic viscosity of all APILs. Generally, the viscosity of APILs decreased as temperature increased. This is due to the reduction of the binding energy caused by temperature elevation thus increases the mobility of molecules. It was observed that, the viscosity value increased as alkyl chain increased with the exception for ETOHA APILs. According to Chennuri and co-workers, an in-creased in alkyl chain had resulted in increasing of van der Waals attraction in aliphatic chains which leading into greater dynamic viscosity.36Meanwhile, the opposite trend was observed in viscosity value ETOHA APILs in which [ETOHA][C5] owns higher viscosity value than [ETOHA][C7]. In spite of low molecular force, this may be due to the presence of stronger hydrogen bond in [ETOHA][C5] that overcompensated smaller anion hence contributed to its high viscosity value.37 Besides that, it had been identified that APILs with [TBA]+ cation own lower viscosity values compared to [TRIETOHA]+ and [ETOHA]+. According to Alcantara et al., the presence of hydroxyl groups in [TRIETOHA]+ and [ETOHA]+ of APILs had increased the polarity of APILs which created a greater ion–ion interaction.38 This caused the formation of hydrogen bond thus resulting in high viscosity value.
The values of dynamic viscosity were then fitted using eqn (16) as follows:
log![[thin space (1/6-em)]](https://www.rsc.org/images/entities/char_2009.gif) η = A4 + A5/T η = A4 + A5/T
| (17) |
| Ionic liquids | A4 | A5 | SD |
|---|---|---|---|
| [ETOHA][C5] | −5.2774 | 2463.4 | 0.0057 |
| [ETOHA][C7] | −4/3744 | 1993.1 | 0.0171 |
| [TRIETOHA][C5] | −6.2739 | 2690.6 | 0.0130 |
| [TRIETOHA][C7] | −6.0304 | 2623.6 | 0.0092 |
| [TBA][C5] | −3.4281 | 1292.7 | 0.0195 |
| [TBA][C7] | −3.4998 | 1332.5 | 0.0103 |
Phase transition of APILs
The study on APILs phase transition was carried out by using Differential Scanning Calorimetry (DSC) at the temperature range of −150–80 °C. According to Clough and co-workers, ILs are glass-transforming materials which will not display a freezing point.39 Except for [TRIETOHA][C7], analysis on DSC thermogram showed the presence of glass transition (Tg) in the temperature range of −77.4 to −114.52 °C for all APILs as shows in Table 6. Meanwhile, the Tg for [TRIETOHA][C7] was not detected within the measured temperature range.| APILs | Tg (°C) | Tc (°C) | Tm (°C) |
|---|---|---|---|
| [ETOHA][C5] | −79.53 | — | — |
| [ETOHA][C7] | −81.83 | — | — |
| [TRIETOHA][C5] | −70.54 | −1.00 | 8.57 |
| [TRIETOHA][C7] | — | −31.67 | 11.98 |
| [TBA][C5] | −114.52 | — | — |
| [TBA][C7] | −110.52 | — | — |
On the other hand, the presence of crystallization (Tc) and melting points (Tm) were detected for APILs with [TRIETOHA]+ cation. Further analysis of the results showed that, Tm increased as anion alkyl chain increased. Besides that, the presence of Tc in [TRIETOHA] APILs could be due to their efficient molecular packing compared to the other APILs. The compactness of [TRIETOHA]+ cation packing is reflected in their density property as both APILs own the largest density value compared [ETOHA] and [TBA] APILs. Meanwhile, the reduction of Tc values was observed as anion alkyl chain increased from [C5] to [C7] which could be due to poor stacking of molecules having relatively longer alkyl chain.
Heat capacity of APILs
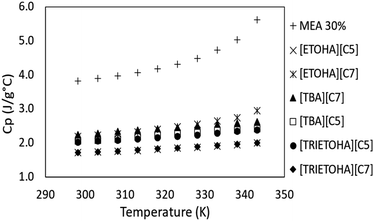
The data on the ILs heat capacity (Cp) is vital for estimating the energy consumption during regeneration process, nonetheless very limited data on Cp of ILs is available in literature. Heat capacity is defined as the amount of energy required to increase the temperature of 1 g or 1 mol of substance by 1 K.40 The Cp of APILs in this study was determined by means of Differential Scanning Calorimetry (DSC). Fig. 7 shows the Cp for APILs and 30% MEA for comparison purpose. Similar to MEA, the Cp value increases with increasing temperature. Furthermore, the comparison study showed APILs own low Cp compared to MEA. As stated by Xie and co-workers, the overall energy consumption is determined by the Cp value.41 Ordinarily, solvents with low Cp are much preferable for CO2 absorption due to low energy consumption compared to MEA.CO2 absorption experiment
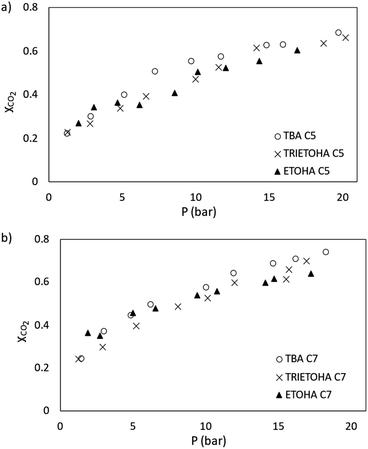
In this study, the performance of APILs towards CO2 absorption was analysed in term of mole fraction (XCO2) and presented in Fig. 8(a) and (b). For clarity, the results are plotted separately according to a common anion. According to Henry's law, the absorption of CO2 increases with pressure.Based on Fig. 8(a) and (b), at 298.15 K with the pressure range from 1–20 bar, the mole fraction of CO2 (XCO2) absorbed by APILs was in the range of 0.22 to 0.74. The performance of APILs in CO2 absorption within the common anion follows the order of [TBA][C7] > [TRIETOHA][C7] > [ETOHA][C7] and [TBA][C5] > [TRIETOHA][C5] > [ETOHA][C5]. For a fixed anion, it was found that APILs with [TBA]+ cation show the highest CO2 absorption which are 0.69 and 0.74 for [TBA][C5] and [TBA][C7], respectively.
A study by Liu and co-workers confirmed a strong linear correlation between CO2 solubility in ILs with fractional Vf value.42 Based on our experimental data, as the molar mass of APILs increased, the Vf value increased as well as the CO2 absorption capacity of the APILs. In our work, [TBA][C7] with the largest Vf has the highest CO2 solubility as it provides more space for gas absorption. Additionally, from Fig. 9(a) through (c), a slight increase in CO2 absorption was observed as anion was shifted from [C5] into [C7]. For example, the mole fraction of CO2 absorbed by [ETOHA][C5] and [ETOHA][C7] at 20 bar are 0.60 and 0.64, correspondingly. The same result was observed on [TRIETOHA] and [TBA]-based APILs. An increase in the anion alkyl chain increased the Vf thus contributed into the overall improvement in the CO2 solubility of the APIL.
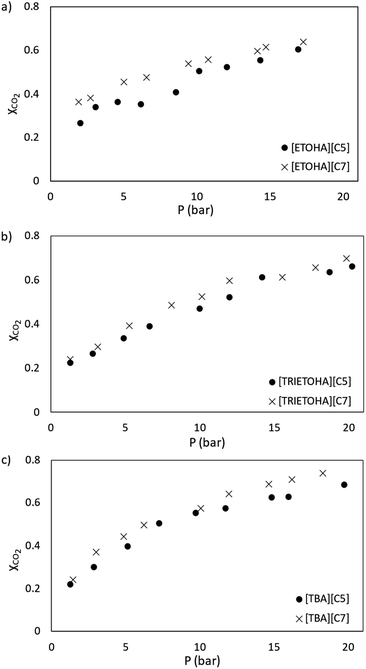 | ||
| Fig. 9 CO2 absorption plot for APILs with (a) [ETOHA], (b) [TRIETOHA] and (c) [TBA] cations at 298.15 K. | ||
According to Huerstas et al., the absorbing capacity of primary and secondary MEA could reach up to 720 g CO2 per kg MEA or 72 wt% owing to the hydrolyzation of unstable carbamates to bicarbonate [HCO3]−.43 Furthermore, works by Rinprasertmeechai and co-workers have shown that the CO2 absorption capacity of 30 wt% aqueous MEA was 324 g CO2 per kg MEA or 32.4 wt% at atmospheric pressure and 298.15 K.44 Meanwhile, [TBA][C7] recorded 44 g CO2 per kg IL or 4.4 wt% CO2 absorption capacity under the same condition which is lower than commercial MEA. Though comparatively the absorption capacity of [TBA][C7] is lower than that of MEA, this somehow shows the potential ability of APILs to be used as solvents for CO2 removal. However, this result highlight the needs of several improvements before APILs could realistically be utilized in CO2 removal application.
Table 7 shows the KH values of APILs calculated based on eqn (6). Generally, the KH can be obtained through the slope of eqn (6) by assuming that the experimental equilibrium pressure increases linearly with gas solubility in APILs.45 In this work, the KH values were calculated in the region of less than 10 bar where the mole fraction of CO2 is directly proportional to the pressure.
| APILs | KH (bar) |
|---|---|
| [ETOHA][C5] | 16.19 |
| [ETOHA][C7] | 14.12 |
| [TRIETOHA][C5] | 40.53 |
| [TRIETOHA][C7] | 30.08 |
| [TBA][C5] | 18.86 |
| [TBA][C7] | 27.59 |
| [B4MPyr][L-Arg] | 121.88 (ref. 46) |
Based on Table 7, it was observed that KH values increase in the order of [ETOHA][C7] < [ETOHA][C5] < [TBA][C5] < [TBA C7] < [TBA][C7] < [TRIETOHA][C5] < [TRIETOHA][C7]. The values of KH for APILs in this work are lower than the reported AAILs in which the chemisorption had occurred. This suggests that physical absorption dominates the interactions between CO2 and APILs in this work.
Comparison of CO2 absorption with other ILs
There are limited publications on CO2 solubility in APILs consist of amines cation and carboxylate anion combination. However, for comparison purposes, the present CO2 solubility data was compared with several developed ILs namely 1-hexyl-3-methylimidazolium bis(trifluoromethylsulfonyl)imide [HMIM][NTf2], 1-butyl-4-methyl pyridinium arginate [B4MPyr][L-Arg],46 choline arginate [Cho][Arg]47 and N,N-diethanolammonium pentanoate [DEEA][Pent].45 It has been observed that, the CO2 absorption by APILs displayed a remarkable performance in comparison to traditional [HMIM][NTf2]. For example, [TBA][C7] recorded 0.736 mole fraction of CO2 at 20 bar, 298.15 K while [HMIM][NTf2] demonstrated 0.415 absorption capacity at the same conditions. Research by Noorani et al. demonstrated that their amino acid based-IL, 1-butyl-4-methyl pyridinium arginate [BMPyr][L-Arg] recorded the value of 0.594 CO2 mole fraction at 6 bar, 298.15 K.46 The same authors also synthesized choline based ILs coupled with amino acid anion. It was observed that the CO2 absorption capacity by choline arginate [Cho][Arg] was 0.552 mole fraction at 3 bar, 298.15 K. Higher CO2 solubility in AAILs compared to APILs could be contributed to the presence of two amines group in AAILs structure thus allowing more sites for gas absorption. Nonetheless, the best comparison can be made by comparing [TRIETOHA][C5] and [TBA][C5] with [DEEA][Pent] as they have common combination of tertiary amine and carboxylic acid. Based on Fig. 10, the CO2 absorption data for [TRIETOHA][C5], [TBA][C5] and [DEAA][Pent] show the same trend in which the mole fraction of CO2 absorbed is directly proportional to gas pressure.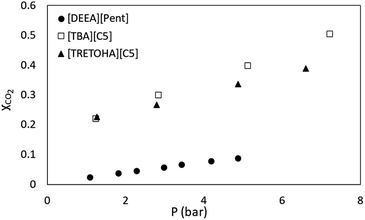 | ||
| Fig. 10 Comparison of CO2 absorption in APILs, [TBA][C5] and [TRIETOHA][C5] at 298.15 K with [DEEA][Pent] at 303 K by Silva et al.45 | ||
Characterization of APILs after CO2 absorption
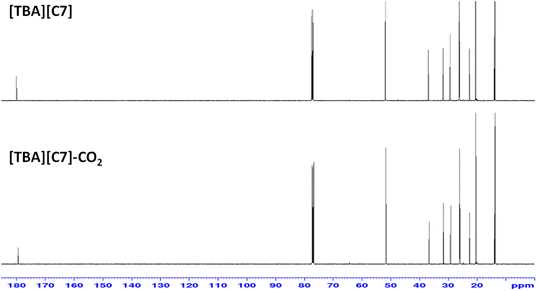
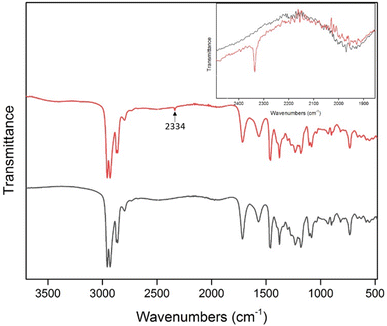
In this work, FTIR and 13C NMR spectroscopy were used to study the possible CO2 absorption pathway by APILs. Analysis conducted on 13C NMR of [TBA][C7] as shown in Fig. 11 shows the absence of any new peak in [TBA][C7]-CO2. Besides that, FTIR analysis was done by employing attenuated total reflectance (ATR) sampling technique in the region of 4000–450 cm−1 under 16 scans. Fig. 12 shows the comparison of the FTIR spectra for [TBA][C7] before and after CO2 absorption while the FTIR spectra for [ETOHA][C5], [ETOHA][C7], [TRIETOHA][C5], [TRIETOHA][C7] and [TBA][C5] are presented in the ESI data.† In general, the aliphatic amine (–NH) was observed at 2922–2954 cm−1. The C–H of alkane is depicted at 2856–2871 cm−1. The COO– of carboxylate anion can be assigned at 1526–1586 cm−1. Furthermore, peaks at 1071–1068 cm−1 represent primary alcohol, OH of [ETOHA]+ and [TRIETOHA]+ cations. Meanwhile, the FTIR spectra of APILs after gas absorption show the presence of a new peak at around 2334–2336 cm−1, associated with O![[double bond, length as m-dash]](https://www.rsc.org/images/entities/char_e001.gif) C
C![[double bond, length as m-dash]](https://www.rsc.org/images/entities/char_e001.gif) O thus indicates the existence of CO2 in APILs. Besides that, there are no formation of new peaks in the area corresponds to carbonyl of carbamate which is usually shown in the case of chemisorption mechanism. Therefore, these results manifest that the CO2 absorption in APILs is solely based on physisorption interaction.
O thus indicates the existence of CO2 in APILs. Besides that, there are no formation of new peaks in the area corresponds to carbonyl of carbamate which is usually shown in the case of chemisorption mechanism. Therefore, these results manifest that the CO2 absorption in APILs is solely based on physisorption interaction.
Recyclability of APILs for CO2 absorption
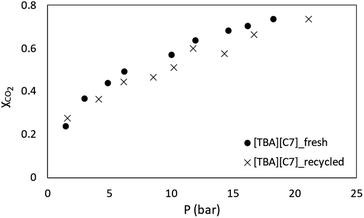
Besides that, the study on recyclability of APILs towards CO2 absorption was also conducted. In this work, APIL [TBA][C7] that has recorded the highest CO2 solubility was selected to be used in the recyclability study. This preliminary recyclability study was conducted in a single cycle only. Used [TBA][C7] was placed under vacuum for 2 hours at 60 °C to remove absorbed CO2 before being utilized in a new cycle of absorption. In the meantime, Fig. 13 shows the data of CO2 absorption in fresh and recycled [TBA][C7]. The plot indicates a marginal difference in the absorption capacity of CO2 between fresh and recycled [TBA][C7] thus suggesting that the APIL indicates a good potential to be used several times in absorbing CO2.However, one should take note on the high energy and cost incurred with the utilization of vacuum during recyclability process. Therefore, it is crucial to further explore other methods with comparatively lower energy usage than that of vacuum such as pressure, thermal and electric swing techniques for recyclability study of the ILs.
Conclusions
In this work, six APILs were successfully synthesized, characterized and utilized for CO2 absorption study. The study indicates that APILs have lower Cp value compared to commonly used MEA thus providing low energy consumption during recyclability process. Further analysis on APILs physiochemical properties also revealed that, their molar masses provide significant effect towards Vm, V, S°, UPOT and Vf values. Other than that, it has been observed that Vf is the key factor in determining the capability of APILs in CO2 absorption in which [TBA][C7] with the largest Vf recorded the highest mole fraction of absorbed CO2. The experimental values of CO2 absorption were utilized in KH determination which in turn have revealed that the CO2 absorption in APILs is attributed by physisorption interaction. This deduction was supported by 13C NMR and FTIR analyses in view of the absence of new peaks related to the formation of carbamate species. The recyclability study conducted at one cycle shows an insignificant reduction in CO2 solubility in [TBA][C7] thus suggesting the promising performance of APILs as liquid absorbents. Nevertheless, in this preliminary study of APIL recyclability, high energy vacuum system was used. Hence, it is of utmost important in the future to focus on the development of new alternatives utilize low energy yet effective in ILs recyclability for CO2 capture.Author contribution
A. H. A. R.: investigation, formal analysis, data curation, methodology and writing-original draft. N. M. Y., N. A. G. and M. U.: conceptualization, N. M. Y.: supervision, funding acquisition, validation, and writing-review and editing. Z. J. M. F. A., N. H. Z. O. Z., S. A. M. F.: methodology and investigation.Conflicts of interest
There are no conflicts to declare.Acknowledgements
The authors would like to acknowledge the financial fund provided by International Collaborative Research Funding (ICRF) between Universiti Teknologi PETRONAS and Universitas Islam Riau (UTP-UIR) with the cost center number of 015ME0-165 for this project. Financial assistance and support from Universiti Teknologi PETRONAS and Centre for Research in Ionic Liquid (CORIL), UTP, are greatly acknowledged.References
- A. Safari, N. Das, O. Langhelle, J. Roy and M. Assadi, Energy Sci. Eng., 2019, 7, 1075–1094 CrossRef.
- A. B. Wasiu, A. R. A. Aziz and M. R. Heikal, J. Appl. Sci., 2012, 12, 2345–2350 CrossRef.
- N. Ghasem, in Advances in Carbon Capture, Elsevier, 2020, pp. 479–501 Search PubMed.
- F. Vega, M. Cano, S. Camino, L. M. G. Fernández, E. Portillo and B. Navarrete, Carbon Dioxide Chemistry, Capture and Oil Recovery, 2018, pp. 142–163 Search PubMed.
- M. Hasib-ur-Rahman, M. Siaj and F. Larachi, Chem. Eng. Process. Process Intensif., 2010, 49, 313–322 CrossRef CAS.
- R. Dawson, L. A. Stevens, O. S. Williams, W. Wang, B. O. Carter, S. Sutton, T. C. Drage, F. Blanc, D. J. Adams and A. I. Cooper, Energy Environ. Sci., 2014, 7, 1786–1791 RSC.
- P. Nancarrow and H. Mohammed, ChemBioEng Rev., 2017, 4, 106–119 CrossRef.
- F. U. Shah, R. An and N. Muhammad, Front. Chem., 2020, 8, 1–3 CrossRef PubMed.
- A. Tagiuri, K. Z. Sumon and A. Henni, Fluid Phase Equilib., 2014, 380, 39–47 CrossRef CAS.
- N. M. Yunus, M. A. Mutalib, Z. Man, M. A. Bustam and T. Murugesan, Chem. Eng. J., 2012, 189, 94–100 CrossRef.
- B.-C. Lee and S. G. Nam, Korean J. Chem. Eng., 2015, 32, 521–533 CrossRef CAS.
- S. Babamohammadi, A. Shamiri and M. K. Aroua, Rev. Chem. Eng., 2015, 31, 383–412 CAS.
- M. Ghorbani and M. I. Simone, ACS Omega, 2020, 5, 12637–12648 CrossRef CAS PubMed.
- K. Fukumoto, M. Yoshizawa and H. Ohno, J. Am. Chem. Soc., 2005, 127, 2398–2399 CrossRef CAS PubMed.
- S. Kang, Y. G. Chung, J. H. Kang and H. Song, J. Mol. Liq., 2020, 297, 111825 CrossRef CAS.
- S. Saravanamurugan, A. J. Kunov-Kruse, R. Fehrmann and A. Riisager, ChemSusChem, 2014, 7, 897–902 CrossRef CAS PubMed.
- M. Rezaeian, M. Izadyar and A. Nakhaei Pour, J. Phys. Chem. A, 2018, 122, 5721–5729 CrossRef CAS PubMed.
- M. Przypis, K. Matuszek, A. Chrobok, M. Swadźba-Kwaśny and D. Gillner, J. Mol. Liq., 2020, 308, 113166 CrossRef CAS.
- T. L. Greaves and C. J. Drummond, Chem. Rev., 2008, 108, 206–237 CrossRef CAS PubMed.
- N. M. Yunus, N. H. Halim, C. D. Wilfred, T. Murugesan, J. W. Lim and P. L. Show, Processes, 2019, 7, 820 CrossRef CAS.
- F. Li, Y. Bai, S. Zeng, X. Liang, H. Wang, F. Huo and X. Zhang, Int. J. Greenhouse Gas Control, 2019, 90, 102801 CrossRef CAS.
- P. K. Chhotaray, S. Jella and R. L. Gardas, J. Chem. Thermodyn, 2014, 74, 255–262 CrossRef CAS.
- N. H. Z. Othman Zailani, N. M. Yunus, A. H. Ab Rahim and M. A. Bustam, Processes, 2020, 8, 742 CrossRef.
- Y. Cao and T. Mu, Ind. Eng. Chem. Res., 2014, 53, 8651–8664 CrossRef CAS.
- D. Santos, M. Santos, E. Franceschi, C. u. Dariva, A. Barison and S. Mattedi, J. Chem. Eng. Data, 2016, 61, 348–353 CrossRef CAS.
- R. Gusain, S. Panda, P. S. Bakshi, R. L. Gardas and O. P. Khatri, J. Mol. Liq., 2018, 269, 540–546 CrossRef CAS.
- M. Montalbán, C. Bolívar, F. G. Diaz Banos and G. Víllora, J. Chem. Eng. Data, 2015, 60, 1986–1996 CrossRef.
- F. Yang and P. Feng, Appl. Sci., 2020, 10, 8342 CrossRef CAS.
- D. Keshapolla, K. Srinivasarao and R. L. Gardas, J. Chem. Thermodyn, 2019, 133, 170–180 CrossRef CAS.
- A. S. Khan, Z. Man, A. Arvina, M. A. Bustam, A. Nasrullah, Z. Ullah, A. Sarwono and N. Muhammad, J. Mol. Liq., 2017, 227, 98–105 CrossRef CAS.
- R. L. Gardas, H. F. Costa, M. G. Freire, P. J. Carvalho, I. M. Marrucho, I. M. Fonseca, A. G. Ferreira and J. A. Coutinho, J. Chem. Eng. Data, 2008, 53, 805–811 CrossRef CAS.
- Ł. Marcinkowski, E. Szepiński, M. J. Milewska and A. Kloskowski, J. Mol. Liq., 2019, 284, 557–568 CrossRef.
- S. Seki, S. Tsuzuki, K. Hayamizu, Y. Umebayashi, N. Serizawa, K. Takei and H. Miyashiro, J. Chem. Eng. Data, 2012, 57, 2211–2216 CrossRef CAS.
- Y. Yu and Y. Chen, ACS Omega, 2021, 6, 14869–14874 CrossRef CAS PubMed.
- D. Zhang, B. Li, M. Hong, Y.-X. Kong, J. Tong and W.-G. Xu, J. Mol. Liq., 2020, 304, 112718 CrossRef CAS.
- B. K. Chennuri, V. Losetty, C. D. Wilfred and R. L. Gardas, J. Mol. Liq., 2017, 241, 246–254 CrossRef CAS.
- P. Bonhote, A.-P. Dias, N. Papageorgiou, K. Kalyanasundaram and M. Grätzel, Inorg. Chem., 1996, 35, 1168–1178 CrossRef CAS PubMed.
- M. L. Alcantara, J. P. Santos, M. Loreno, P. I. Ferreira, M. L. Paredes, L. Cardozo-Filho, A. K. Silva, L. M. Liao, C. A. Pires and S. Mattedi, Fluid Phase Equilib., 2018, 459, 30–43 CrossRef CAS.
- M. T. Clough, C. R. Crick, J. Gräsvik, P. A. Hunt, H. Niedermeyer, T. Welton and O. P. Whitaker, Chem. Sci., 2015, 6, 1101–1114 RSC.
- E. Gómez, N. Calvar and Á. Domínguez, Ionic Liquids-Current State of the Art, 2015, vol. 20, pp. 199–228 Search PubMed.
- Y. Xie, Y. Zhang, X. Lu and X. Ji, Appl. Energy, 2014, 136, 325–335 CrossRef CAS.
- X. Liu, K. E. O'Harra, J. E. Bara and C. H. Turner, Phys. Chem. Chem. Phys., 2020, 22, 20618–20633 RSC.
- J. I. Huertas, M. D. Gomez, N. Giraldo and J. Garzón, J. Chem., 2015, 2015, 1–7 CrossRef.
- S. Rinprasertmeechai, S. Chavadej, P. Rangsunvigit and S. Kulprathipanja, Int. J. Chem. mol. Eng., 2012, 6, 284–288 Search PubMed.
- L. P. Silva, E. A. Crespo, M. A. Martins, P. C. Barbosa, R. L. Gardas, L. F. Vega, J. o. A. Coutinho and P. J. Carvalho, Ind. Eng. Chem. Res., 2022, 61, 4046–4057 CrossRef CAS.
- N. Noorani, A. Mehrdad and I. Ahadzadeh, Fluid Phase Equilib., 2021, 547, 113185 CrossRef CAS.
- N. Noorani and A. Mehrdad, J. Mol. Liq., 2022, 357, 119078 CrossRef CAS.
Footnote |
| † Electronic supplementary information (ESI) available. See DOI: https://doi.org/10.1039/d3ra01345f |
| This journal is © The Royal Society of Chemistry 2023 |

