 Open Access Article
Effect of air bubbling on electroless Pd plating for the practical application of hydrogen selective membranes†
Eun-Han Lee ab,
Tae-Woo Kimab,
Segi Byun
 a,
Doo-Won Seoa,
Hyo-Jung Hwanga,
Hyung-Chul Yoon
 c,
Hansung Kim
 *b and
Shin-Kun Ryi
 *a
*a
aHigh Temperature Energy Conversion Laboratory, Korea Institute of Energy Research (KIER), 152 Gajeong-ro, Yuseong-gu, Daejeon 34129, Republic of Korea. E-mail: h2membrane@kier.re.kr; Fax: +82-42-860-3133; Tel: +82-42-860-3155
bDepartment of Chemical and Biological Engineering, Yonsei University, 50 Yonsei-ro, Seodaemun-gu, Seoul 03722, Republic of Korea. E-mail: elchem@yonsei.ac.kr; Tel: +82-2-2123-5753
cClean Fuel Research Laboratory, Korea Institute of Energy Research (KIER), 152 Gajeong-ro, Yuseong-gu, Daejeon 34129, Republic of Korea
First published on 10th May 2023
Abstract
In this study, an air bubbling electroless plating (ELP) method was newly developed for the production of Pd composite membranes. The air bubble ELP alleviated the concentration polarization of Pd ions, making it possible to achieve a plating yield of 99.9% in 1 h and form very fine Pd grains with a uniform layer of ∼4.7 μm. A membrane with a diameter of 25.4 mm and a length of 450 mm was produced by the air bubbling ELP, achieving a hydrogen permeation flux of 4.0 × 10⁻¹ mol m−2 s−1 and selectivity of ∼10![[thin space (1/6-em)]](https://www.rsc.org/images/entities/char_2009.gif) 000 at 723 K with a pressure difference of 100 kPa. To confirm the reproducibility, six membranes were produced by the same method and assembled in a membrane reactor module to produce high-purity hydrogen by ammonia decomposition. Hydrogen permeation flux and selectivity of the six membranes at 723 K with a pressure difference of 100 kPa were 3.6 × 10⁻¹ mol m−2 s−1 and ∼8900, respectively. An ammonia decomposition test with an ammonia feed rate of 12
000 at 723 K with a pressure difference of 100 kPa. To confirm the reproducibility, six membranes were produced by the same method and assembled in a membrane reactor module to produce high-purity hydrogen by ammonia decomposition. Hydrogen permeation flux and selectivity of the six membranes at 723 K with a pressure difference of 100 kPa were 3.6 × 10⁻¹ mol m−2 s−1 and ∼8900, respectively. An ammonia decomposition test with an ammonia feed rate of 12![[thin space (1/6-em)]](https://www.rsc.org/images/entities/char_2009.gif) 000 mL min−1 showed that the membrane reactor produced hydrogen with >99.999% purity and a production rate of 1.01 Nm3 h−1 at 748 K with a retentate stream gauge pressure of 150 kPa and a permeation stream vacuum of −10 kPa. The ammonia decomposition tests confirmed that the newly developed air bubbling ELP method affords several advantages, such as rapid production, high ELP efficiency, reproducibility, and practical applicability.
000 mL min−1 showed that the membrane reactor produced hydrogen with >99.999% purity and a production rate of 1.01 Nm3 h−1 at 748 K with a retentate stream gauge pressure of 150 kPa and a permeation stream vacuum of −10 kPa. The ammonia decomposition tests confirmed that the newly developed air bubbling ELP method affords several advantages, such as rapid production, high ELP efficiency, reproducibility, and practical applicability.
1. Introduction
Hydrogen has attracted considerable attention as a promising alternative energy source because of its high energy density, nontoxicity, economy, abundance, and environmental friendliness.1 To realize a hydrogen-based society, substantial R&D effort has been invested throughout the hydrogen energy value chain, including in hydrogen production, storage, transportation, and utilization.2–4 Hydrogen can be used to generate electricity through fuel cells, including solid oxide fuel cells, molten carbonated fuel cells, and proton-exchange membrane fuel cells (PEMFCs).5 Among them, the most suitable fuel cells for use in transportation applications, such as automobiles, drones, submarines, and ships, are PEMFCs.6 Generally, high-purity hydrogen is need to maintain the efficiency and durability of the PEMFCs.5 Hydrogen is commonly produced by fossil fuel reforming reactions, such as steam methane reforming,7 methanol steam reforming,8 and ethanol steam reforming.9 Recently, ammonia has attracted considerable attention as a hydrogen source because it is easy to transport and store, has a high volumetric hydrogen density, and hydrogen production via ammonia decomposition does not emit CO2 (ref. 10–12) Additional purification processes like pressure swing adsorption, which is most commonly used, are required to increase the purity of the produced hydrogen.13,14Membranes have been considered an alternative method for obtaining high-purity hydrogen with a simple process configuration, high hydrogen recovery rate, and one-step simultaneous production and purification, which shifts forward the reaction equilibrium.15 Among membrane materials, Pd or Pd alloy membranes have various advantages, such as high hydrogen permeability, selectivity, hydrogen embrittlement, and chemical resistance.16,17 In particular, self-supported Pd-based membranes have been commercialized for producing ultra-high-purity hydrogen.18 However, they require a large amount of Pd, which results in a high material cost, low hydrogen permeation flux, and difficulty in modularization.16 Consequently, the Kikuchi and Uemiya groups proposed the use of a composite membrane coated with Pd or Pd alloy on a porous support in 1991.19 Since then, many coating methods such as chemical vapor deposition, sputtering, spray pyrolysis, laser synthesis, photocatalytic coating, electrolytic plating, and electroless plating (ELP) have been used to manufacture composite membranes on ceramic or metal supports.14,18,20,21 Among them, ELP has been deemed the most realistic method for increasing the membrane area and the most suitable for commercialization owing to its simple equipment and having no additional electrical energy requirements.17
Pd ELP is carried out by reducing Pd ions using a reducing agent. Since Rhoda developed the hydrazine method (eqn (1)) in 1958, various studies on plating optimization have been conducted.22–24
| 2Pd(NH3)2+4 + N2H4 + 4OH− → 2Pd0 + 8NH3 + N2 + 4H2O, E0 = 2.07 V | (1) |
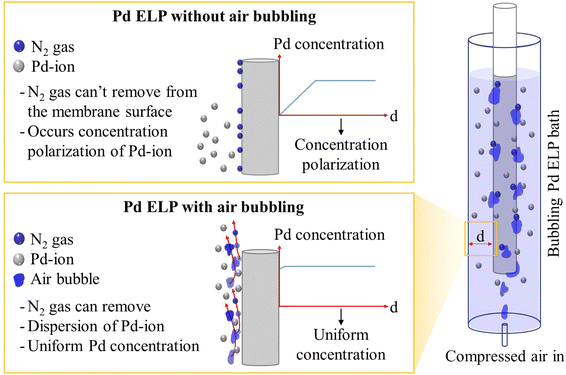
During ELP by the hydrazine method, nitrogen is generated on the surface of the substrate, and nitrogen gas strongly adheres to the surface, causing defects and non-uniformity of the plating layer.24–26 In addition, the concentration polarization of Pd ions occurs because the ELP reaction occurs on the surface of the substrate, as shown in Fig. 1. This concentration polarization of the Pd ions is the reason for the low plating efficiency.27,28 Some studies have been conducted to resolve these issues. Ayturk et al.28 reported that the plating rate of Pd was improved when the plating bath was agitated and that an agitation speed of 400 rpm was sufficient to minimize the external mass transfer limitation. Sitar et al.25 reported that using sonication and plating solution circulation can produce a defect-free membrane because of the efficient removal of the nitrogen gas generated during plating and good mixing of the plating solution. Souleimanova et al.29 reported that the use of osmosis in ELP improves the mass transfer in the boundary layer along the surface to form a finer and more uniform plating layer. Our group has made steady efforts to enhance the plating efficiency and remove nitrogen gas from the membrane surface. In the case of plate-type membranes, we developed a plating rig and subjected the plating rig to shaking using a shaking bath to enhance the mass transfer of Pd ions.27 The shaking method increased the plating yield to 99.9% in 3 h and effectively removed nitrogen gas. For tubular membranes, very simple periodic agitation of the plating complex with a Teflon rod resulted in 99.9% Pd ion consumption and effective nitrogen gas removal.30
From an industrial viewpoint, a simple, effective, and automated method should be considered for mass production and reproducibility. We introduced bubble injection to eliminate nitrogen gas and minimize the polarization effect of Pd ion concentration during ELP for the first time. The Pd layer was plated on a porous Inconel 600 support with a diameter of 1/2 inch (12.7 mm) and a length of 450 mm, which was pre-treated with an alumina sol and a yttria-stabilized zirconia (YSZ) diffusion barrier using the blowing coating method developed by our group.18,30 To confirm the effects of air bubbling, compressed air was fed into the bottom of the plating bath in the flow rate range of 90–1590 mL min−1. The plating efficiency was calculated based on the number of Pd ions remaining in the plating solution over time. The remaining Pd ions were detected by inductively coupled plasma-optical emission spectroscopy (ICP-OES). After Pd ELP with an air flow rate of 90 mL min−1, the membrane was evaluated with gas permeation test and cut to verify the membrane morphology by scanning electron microscopy (SEM). To verify the reproducibility, six membranes were prepared using the same procedure. For the gas permeation and ammonia decomposition tests, the six prepared membranes were installed in a membrane module using commercial fittings. Permeation tests using hydrogen and nitrogen confirmed that the newly developed bubble injection method was highly effective and reliable for producing Pd composite membranes. From the ammonia decomposition test equipped with a commercial Ru/Al2O3 catalyst from Tanaka Co., the ammonia decomposition rate, hydrogen concentration, and hydrogen recovery ratio were verified using gas chromatography analysis, ammonia detectors, and a dry gas flow meter.
2. Experimental section
2.1 Membrane preparation
A tubular porous Inconel 600 support (GaoQ Funct. Mater, Ltd) with a diameter of 1/2 inch (12.7 mm) and length of 450 mm was used as the support for the membrane. Before ELP, the support was pre-treated to reduce the entrance pore size and prevent interdiffusion between the Pd layer and metal support. The entrance pore size of the support was reduced by packing a nanosized YSZ slurry with a vacuum pump, and the remaining YSZ powder was removed by polishing with a clean cloth.31 After packing the entrance pores of the support, a boehmite-based alumina sol was applied to eliminate the surface roughness, causing defect formation during the diffusion barrier coating process.30 The support was completed by applying a YSZ diffusion barrier coating using the blowing coating method developed by our group.18 The Pd nuclei were seeded on the pre-treated supports by spraying a 0.1 M PdCl2 solution, followed by reduction under hydrogen at 723 K. ELP was performed using the newly developed bubble injection method with compressed air, as shown in Fig. 1. The Pd ELP solution was prepared using an ethylenediaminetetraacetic acid (EDTA)-free bath, as described in our previous study.5,14,32 During Pd ELP, compressed air was supplied to the bottom of the plating bath using a mass flow controller (MFC, Alicat Co.). To verify the effect of the number of bubbles, the air feed rate was changed to 90, 350, and 1590 mL min−1. During Pd plating, 10 mL of the plating solution was removed from the plating bath every 30 min for ICP-OES analysis. After base plating, vacuum-assisted ELP was performed under similar bubble injection conditions. To verify the reproducibility from an industrial viewpoint, six membranes were produced under the selected bubble injection conditions.2.2 Gas permeation tests and ammonia decomposition
The hydrogen permeation flux and H2/N2 selectivity of the prepared membranes were compared to verify the reproducibility. Membrane performance tests were conducted at a transmembrane pressure difference of 100 kPa and 723 K. While increasing the temperature at a rate of 3 K min−1, nitrogen was supplied to prevent hydrogen embrittlement. When the temperature reached 723 K, the hydrogen permeation flux and nitrogen leakage were measured using a digital soap bubble flow meter (Gilibrator-2, Gilian) and a micro-soap bubble flow meter (Soap Film Flowmeter 10 mL, Wilmad-LabGlass), respectively. The H2/N2 selectivity was calculated using eqn (2).
 | (2) |
The prepared membranes were used for ammonia decomposition to verify an industrial application to produce high-purity hydrogen. As shown in Fig. 2, hydrogen production tests through ammonia decomposition were carried out using a membrane reactor installed with the six prepared membranes. The six membranes were installed in the membrane module using the very simple fitting method, and the Ru/Al2O3 catalyst (TRC10-04.54, TANAKA, Ltd) was filled from the shell side. The catalyst was spherical, with an average diameter of ∼2 mm, and contained 2 wt% Ru. Nitrogen was supplied to the membrane reactor while increasing the temperature. After the temperature reached 748 K, ammonia (99.999%) was supplied and the nitrogen supply was stopped. Ammonia decomposition tests were performed at a transmembrane pressure difference of 150 kPa. A vacuum pump (ULVAC, DTC-22B) was installed in the permeation stream to effectively remove permeated hydrogen. The ammonia conversion, hydrogen production rate, hydrogen recovery, and hydrogen concentration were measured at an NH3 feed flow rate of 12![[thin space (1/6-em)]](https://www.rsc.org/images/entities/char_2009.gif) 000 mL min−1. The ammonia conversion, hydrogen production rate, and hydrogen recovery were calculated using eqn (3)–(5). Before measuring the flow rate of products, remained ammonia was dissolved using water trap. The decomposed gases (H2 and N2) on the permeate and retentate sides were analyzed using a gas chromatograph (Agilent, HP 7890) equipped with a thermal conductivity detector, and the flow rates on the permeate and retentate sides were measured using a dry gas meter (SNAGAWA, DC-2C-M). The ammonia concentrations on the permeate and retentate sides were analyzed using an ammonia detector (Gastec Corporation, ammonia detector tube) placed before the water trap.
000 mL min−1. The ammonia conversion, hydrogen production rate, and hydrogen recovery were calculated using eqn (3)–(5). Before measuring the flow rate of products, remained ammonia was dissolved using water trap. The decomposed gases (H2 and N2) on the permeate and retentate sides were analyzed using a gas chromatograph (Agilent, HP 7890) equipped with a thermal conductivity detector, and the flow rates on the permeate and retentate sides were measured using a dry gas meter (SNAGAWA, DC-2C-M). The ammonia concentrations on the permeate and retentate sides were analyzed using an ammonia detector (Gastec Corporation, ammonia detector tube) placed before the water trap.
 | (3) |
 | (4) |
 | (5) |
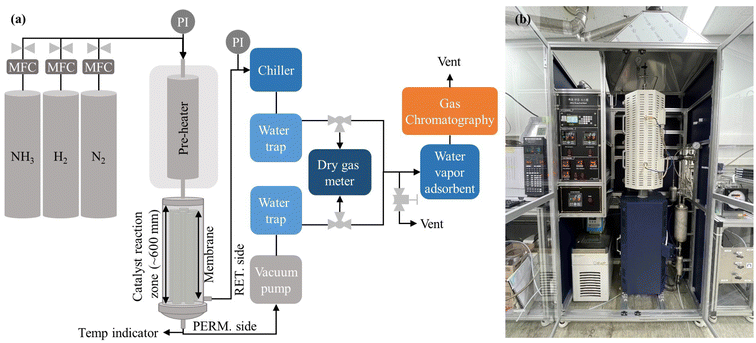 | ||
| Fig. 2 Ammonia decomposition test equipment: (a) flow diagram for ammonia decomposition; (b) photo of ammonia decomposition equipment. | ||
3. Results and discussion
3.1 Effect of air flow rate on Pd plating
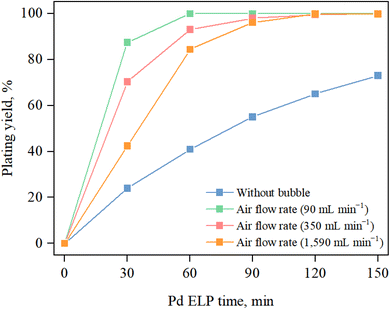
Pd ELP was conducted using the newly developed bubble injection method with the plating equipment described in Fig. 1. To verify the effect of the number of bubbles on Pd ELP, the air flow rate was varied and the plating yield was calculated by ICP analysis of Pd. As shown in Fig. 1, air injection at the bottom of the plating bath created bubbles, and bubbling increased the plating yield, as shown in Fig. 3. In the case of ELP with no bubbling, the Pd plating yield increased rapidly over time and reached ∼73% after 150 min. However, air bubbling drastically increased the plating yield, and ∼99% yield was achieved in 60 min with an air flow rate of 90 mL min−1. In general, Pd ELP occurs on the surface of the substrate through an auto-catalytic reaction, i.e., Pd ion reduction by a reducing agent.27,32–34 For the auto-catalytic reaction, the Pd ion and reducing agent should move and adhere to the substrate surface. Without additional effects, the Pd ions and reducing agent diffused to the substrate surface due to conduction. If the conduction rate of the Pd ions and reducing agent to the substrate surface is insufficient for the auto-catalytic reaction, concentration polarization of the Pd ions and reducing agent occurs, as shown in Fig. 1. This concentration polarization decreased the reaction rate, resulting in a low plating yield. To alleviate concentration polarization, additional methods should be considered. To improve mass transfer and overcome concentration polarization, some approaches have been reported, such as agitation with a rod,28,30,35 sonication,25,36 and osmosis ELP;29,37 however, a simple and reliable method should be considered for large tubular membranes and for ensuring reproducibility. Air bubbling has been widely used for mixing the solution effectively, which dynamically enhances the turbulence of the mixture to increase the diffusion effect of the material.38,39 For this reason, a high plating yield can be obtained by introducing bubbles in the plating bath and homogenously mixing the plating solution, which can effectively avoid concentration polarization.When comparing the air flow rates, the plating yield tended to decrease as the air flow rate increased. As indicated by eqn (1), Pd ions in the plating solution react with hydrazine to form Pd clusters on the substrate surface. We can infer that an increase in the air flow rate decreases the concentration polarization effect, leading to an increase in the plating yield. However, in this case, the increase in the air flow rate had a negative effect, and this phenomenon may be similar to the space-velocity effect. In some cases, in reactions that are at thermodynamic equilibrium, the oversupply of reactants tends to hinder the forward reaction. El-Bahy et al.40 observed that excessive addition of water led to a decrease in CF4 conversion in the hydrolysis reaction, i.e., a reaction at thermodynamic equilibrium. They concluded that the decrease in catalytic activity with excessive addition of water may be attributed to either an increase in the space velocity, which in turn decreases the contact time, and/or competition between H2O and CF4 for adsorption onto the surface active site of the catalyst. In this case, excessive supply of air might hinder the reaction because there may be insufficient time for the auto-catalytic reaction. In addition, when the air flow rate was increased, the membrane quaked and the plating solution tended to rush out of the plating bath, which is an obstacle for mass production. Therefore, we chose an air flow rate of 90 mL min−1 for membrane manufacturing.
In addition to the plating time, minimizing the waste of useful elements is important in the plating process. Utilizing useful elements minimizes the need for wastewater treatment and provides an economic advantage to the industry.27 To minimize Pd ion waste, increasing the plating yield is very important. As shown in Fig. 3, plating needed to be carried out for a long time to obtain a sufficient plating yield, and using Pd up was impossible without bubbling. When the bubbles were introduced, we achieved a plating efficiency of 99.9% in 2 h, regardless of the air flow rate. This means that the newly developed bubbling Pd ELP method does not require wastewater treatment to recover Pd ions.
In the hydrazine method, nitrogen gas is generated by an autocatalytic reaction, and gas bubbles are produced (eqn (1)). The nitrogen bubbles adhere to the surface of the membrane and cause the bubble dome to interrupt further reactions (Fig. 4). This phenomenon was the cause of the non-uniformity of the Pd layer. Sitar et al.25 reported that hydrazine, a reducing agent, released ammonia and nitrogen gases during ELP, and these gases contributed to the perpetuation of defects and non-uniformity. They attempted to resolve this problem by sonicating and rotating the plating solution. They concluded that the sonicating and rotating the plating solution were effective methods for removing gases from the membrane surface and obtaining a defect-free thin Pd layer. Our newly devised, very simple air bubbling Pd ELP had a similar effect. To verify the effect of air bubbling on plating quality, compressed air at 90 mL min−1 was introduced into the bottom of the plating bath during Pd ELP, and the membrane surface was closely observed. The movement of air and nitrogen bubbles was shown in ESI 1.† The edited snapshots of the recorded video presented in Fig. 4 show that the nitrogen bubble dome generated during the ELP reaction was successfully removed by the air bubbles.
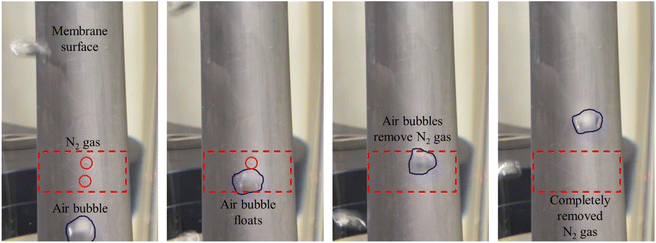 | ||
| Fig. 4 Snapshots of the removal of the N2 gas formed on the membrane surface by bubbles with an air flow rate of 90 mL min−1. | ||
For a highly selective and permeable membrane, the Pd layer should be thin and dense and not have any defects. The condition of the Pd plating layer is strongly dependent on the plating conditions, such as the availability of seed nuclei, uniformity, temperature, and amount of reducing agent. Yeung et al.34 reported that the plating temperature affected the grain size, and the membrane with a large grain size had many defects. Souleimanova et al.41 introduced an osmosis ELP method to increase mass transfer to the surface of the support and obtained finer Pd grains than those obtained using the conventional method. Osmosis ELP increased the hydrogen permeability and selectivity of the membranes. Keuler et al.42 showed that an increase in temperature and the concentration of the reducing agent increased the plating rate, and a fast plating rate caused defects on the membrane surface. They concluded that a slow plating rate was required to obtain a dense and uniform layer. Ryi et al.32 introduced an EDTA-free ELP method and reported that plating temperature had a significant impact on the morphology of the membrane. They observed bulky plating at 308 K but a fine layer at 293 K. However, the temperature affected the plating rate, and 3 h were required to achieve ∼80% plating yield at 293 K.
In addition to the dense layer, which is essential for a good membrane, the plating time is very important from the viewpoint of manufacturing. We obtained a plating yield of 99.9% in 1 h at 292 K with a compressed air flow rate of 90 mL min−1. This is much faster than the plating times reported in previous studies.32,41,42 The densification of Pd layer was confirmed by gas permeation tests. Hydrogen permeation flux and nitrogen leakage tests were performed at 723 K with a transmembrane pressure difference of 100 kPa. The performances of our membrane are compared with those of other reported membranes manufactured by the ELP method. The results in Table 1 show that the membrane has a hydrogen permeation flux of 4.0 × 10⁻¹ mol m−2 s−1 and a selectivity of 10![[thin space (1/6-em)]](https://www.rsc.org/images/entities/char_2009.gif) 000, which are similar to those of the membrane prepared using the stirring method30 and quite high compared with the values reported for the previous membranes in Table 1.
000, which are similar to those of the membrane prepared using the stirring method30 and quite high compared with the values reported for the previous membranes in Table 1.
| Membrane | Support | Geometry | Method | Area [cm2] | Thick [μm] | Temp. [K] | ΔP [kPa] | H2 permeation flux [mol m−2 s−1] | Selectivity [H2/N2] | Ref. |
|---|---|---|---|---|---|---|---|---|---|---|
| a PSS: porous stainless steel, ELP: electroless plating, VA-ELP: vacuum-assisted ELP, B-ELP: bubbling ELP. | ||||||||||
| Pd | PSS | Tubular | VA-ELP | 30.6 | 7 | 773 | 101.3 | 9.1 × 10⁻³ | 100–150 | 46 |
| Pd/CeO2 | PSS | Tubular | ELP | 2.0 | 13 | 773 | 100 | 1.2 × 10⁻¹ | ∞ | 47 |
| Pd/CeO2 | PSS | Tubular | ELP | 2.0 | 13 | 823 | 200 | 2.7 × 10⁻¹ | ∞ (H2/He) | |
| Pd–Ag | PSS | Tubular | ELP | 2.0 | 10 | 753 | 100 | 8.9 × 10⁻² | 1000 | 48 |
| Pd | PSS | Tubular | ELP | 6.0 | 20 | 623 | 101 | 4.9 × 10⁻² | 5000 | 49 |
| Pd | Al2O3 | Tubular | ELP | 24.2 | 7 | 673 | 100 | 2.3 × 10⁻¹ | 7500 | 50 |
| Pd–Ag | Al2O3 | Tubular | ELP | 64.4 | 1.29 | 673 | 100 | 9.2 × 10⁻¹ | 1900 | 51 |
| Pd–Au | PSS | Tubular | ELP | 16.1 | 5 | 823 | 50 | 1.7 × 10⁻¹ | 6400 | 52 |
| Pd | PSS | Tubular | ELP | 175 | 3 | 773 | 20 | 9.8 × 10⁻² | 595 | 18 |
| Pd | Inconel 600 | Tubular | ELP | 175 | 4–4.5 | 773 | 10.1 | 7.4 × 10⁻² | 335 | 5 |
| Pd | Inconel 600 | Tubular | VA-ELP | 175 | 5 | 723 | 100 | 3.4 × 10⁻¹ | 8050 | 30 |
| Pd | Inconel 600 | Tubular | B-ELP | 175 | 4.7 | 723 | 100 | 4.0 × 10⁻¹ | 10![[thin space (1/6-em)]](https://www.rsc.org/images/entities/char_2009.gif) 000 000 |
This study |
To verify and compare the membrane morphology of a fresh membrane, the membrane was cut and SEM analysis was conducted. Surface SEM images of the fresh membrane showed that the membrane had a very small Pd cluster with 100–300 nm and a defect-free Pd layer (Fig. 5a). After gas permeation test at 723 K, the fine Pd cluster were disappeared and larger Pd grain was observed (Fig. 5b). The increase of Pd grain size could be attributed to the sintering of the small Pd clusters and Pd crystallites. Sintering is a common phenomenon in Pd-based membrane obtained by ELP.43,44 Han et al.18 analyzed the surface SEM image after stability test of the Pd membrane at 673–773 K for ∼200 h and observed large Pd grains generation. Ryi et al.45 reported that the tested membrane exhibited a larger Pd grain morphology when compared to fresh membrane. And they concluded that the small grains became large grains due to the sintering. Li et al.15 explained this phenomenon by thermodynamic energy state. Small clusters are thermodynamically unstable due to excess surface energy and transform into a low-energy steady state by merging grains. The cross-sectional SEM images in Fig. 5c indicates that the Pd layer thickness was approximately ∼4.7 μm and uniform along with the membrane length.
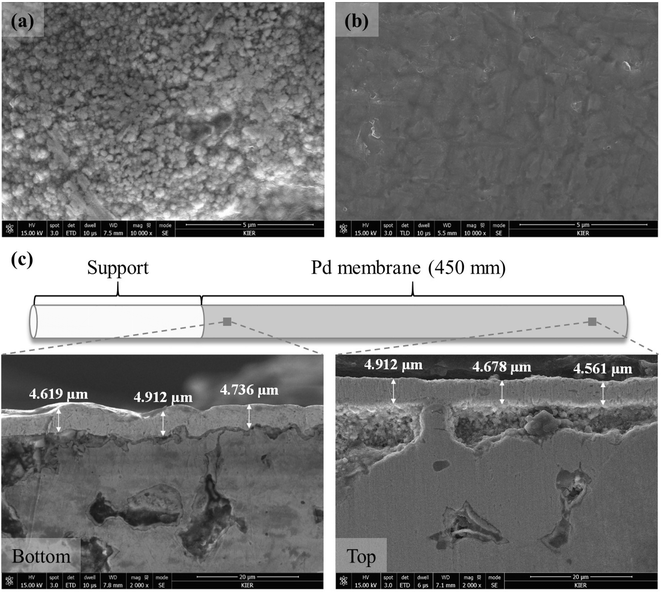 | ||
| Fig. 5 Surface SEM images of the fresh (a) and the tested (b) membranes; cross-sectional SEM images (c) along with membrane length. | ||
3.2 Ammonia decomposition test using membrane reactor
To investigate the practical applicability of the membranes prepared by the air bubbling ELP method, ammonia decomposition tests were carried out using a membrane reactor (MR) equipped with prepared membranes. The reactor module was designed to install six membranes using a simple metal-fitting method. And six membranes were produced by the same process using the newly developed bubble Pd ELP method with a compressed air flow rate of 90 mL min−1. As shown in Fig. 6, the membrane module consisted of a top plate, module body, and bottom plate. A feed port was installed on the top plate to introduce ammonia. The bottom plate was composed of six male unions welded to install the membranes and a permeation port for collecting permeated hydrogen. The top plate, module body, and bottom plate were assembled using flanges, and the assembled module was 660 mm in length and 140 mm in diameter with the flanges. To improve the gas tightness of the module, metal-graphite composite gaskets were placed between the flanges of the top plate, bottom plate, and module body. Before installing the membranes, gas tightness tests of the membrane module were performed using nitrogen at room temperature, and no gas leakage was verified up to ∼2000 kPa. After the gas tightness test, the module was cleaned by baking at 773 K for 5 h under hydrogen to remove contaminants, such as oily compounds.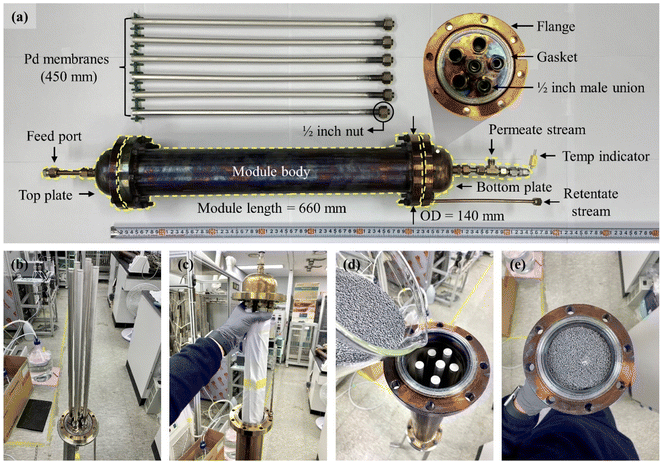 | ||
| Fig. 6 Membrane reactor: (a) image of membrane reactor module and six Pd composite membranes fabricated by the air bubbling ELP method; (b–e) module assembling process. | ||
The prepared membranes were installed on the bottom plate of the module using commercial metal fittings (Swagelok). During the mounting of the bottom plate on the module body, the membranes were covered with a clean cloth to protect them from scratching (Fig. 6b and c). After fixing the bottom plate with bolts and nuts, the Ru/Al2O3 catalysts were filled through the top side of the module body (see Fig. 6d and e). After the catalysts were filled, the MR module was completed by joining the top plate with bolts and nuts. To verify module leakage between the flanges, nitrogen was supplied and maintained at ∼500 kPa at room temperature. Soap water was applied between the flanges to confirm the gas tightness.
After gas tightness test, hydrogen permeation flux and nitrogen leakage tests were performed at 723 K with a transmembrane pressure difference of 100 kPa. The results show that the values of hydrogen permeation flux and selectivity were 3.6 × 10⁻¹ mol m−2 s−1 and 8900, respectively. These values of six membrane module are similar to those of the membrane compared in Table 1. These results indicate that our newly developed air bubble ELP method provides reproducibility and practical applicability with simple equipment for highly permeable and selective membranes.
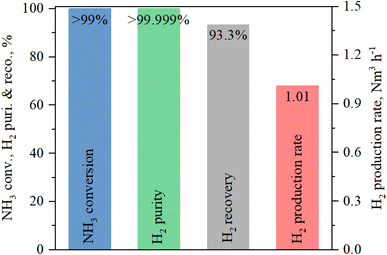
After gas permeation test, an ammonia decomposition test was performed at 748 K with a feed-side pressure of 150 kPa. During the heating of the MR up to the reaction temperature, nitrogen was supplied to protect the membrane from phase transition below the critical points, i.e., 573 K and 2 × 10³ kPa.53 A thermocouple was inserted into the bottom plate for measuring the temperature, as shown in Fig. 6. When the temperature reached 748 K, ammonia, instead of nitrogen, was supplied at a feed flow rate of 12![[thin space (1/6-em)]](https://www.rsc.org/images/entities/char_2009.gif) 000 mL min−1. During the ammonia decomposition test, the permeate stream was maintained at approximately −10 kPa using a vacuum pump, as described in our previous study.30 The results of the ammonia decomposition tests are summarized in Fig. 7. In our previous work,30 a hydrogen production rate of 0.25 Nm3 h−1 was achieved using a single membrane with the gauge pressure in the retentate stream at 500 kPa and a −10 kPa vacuum in the permeation stream.
000 mL min−1. During the ammonia decomposition test, the permeate stream was maintained at approximately −10 kPa using a vacuum pump, as described in our previous study.30 The results of the ammonia decomposition tests are summarized in Fig. 7. In our previous work,30 a hydrogen production rate of 0.25 Nm3 h−1 was achieved using a single membrane with the gauge pressure in the retentate stream at 500 kPa and a −10 kPa vacuum in the permeation stream.
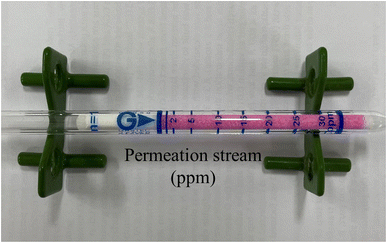
As shown in Fig. 7, we achieved an ammonia conversion rate of 99%. The hydrogen purity and recovery ratio were >99.999% and 93.3%, respectively. As shown in Fig. 8, no ammonia slip was observed in the permeation stream using an ammonia-detecting tub. The hydrogen production rate was calculated by multiplying the permeation flow rate by the hydrogen purity. The hydrogen production rate was ∼1.01 Nm3 h−1. The hydrogen production rate was identical for the four membranes. Generally, the hydrogen permeation flux depends on the hydrogen partial pressure difference and temperature. In this study, the ammonia decomposition test was performed at a pressure lower than that in our previous study,30 resulting in a lower hydrogen permeation flux and hydrogen production rate. On the other hand, a higher hydrogen purity was achieved because fewer impurities, especially N2, could penetrate through the small pinholes at low pressure. The hydrogen recovery rate is affected by the ammonia feed flow rate and tends to decrease with increasing ammonia feed flow rate.12,54,55 In this study, the ratio of feed flow rate (mL min−1) to membrane area (cm2) (F/A ratio) was 11.4 mL cm−2 min−1, i.e., ∼70% of that in a previous study.30 We achieved ∼99% ammonia conversion and 93.3% hydrogen recovery, which are higher values than those reported in a previous study.30 The hydrogen production rate is affected by the ammonia feed rate, conversion rate, and hydrogen recovery ratio. Considering the F/A ratio, the hydrogen production rate achieved in this study, using six membranes, is an appropriate value in comparison with the results obtained previously with a single membrane.30 From the ammonia decomposition tests, we can conclude that it is possible to multiply the hydrogen production capacity in the MR by multiplying the number of membranes prepared using our newly developed air bubbling ELP method.
4. Conclusion
We developed an air bubbling ELP method for the practical application of a Pd composite membrane, and the following conclusions were obtained:1. The introduction of air bubbles at the bottom of the plating bath with compressed air assisted in the transfer of Pd ions and removed N2 gas, which increased the plating yield by 99.9% in 1 h and afforded fine Pd grains (100–300 nm) with a thin and uniform (∼4.7 μm) Pd layer. And gas permeation test showed that the membrane had a hydrogen permeation flux of 4.0 × 10⁻¹ mol m−2 s−1 and a selectivity of 10![[thin space (1/6-em)]](https://www.rsc.org/images/entities/char_2009.gif) 000 at 723 K with a transmembrane pressure difference of 100 kPa.
000 at 723 K with a transmembrane pressure difference of 100 kPa.
2. Six Pd membranes were fabricated by the same air bubbling ELP method, and the obtained hydrogen permeation flux and selectivity were 3.6 × 10⁻¹ mol m−2 s−1 and 8900, respectively, indicating that the newly developed air bubbling ELP method provides reproducibility and practical applicability.
3. To verify the applicability of the membranes in hydrogen production and purification, an MR equipped with six membranes and a Ru/Al2O3 catalyst was built, and ammonia decomposition tests were performed. We obtained a hydrogen production rate of 1.01 Nm3 h−1 with >99.999% purity at 748 K with a retentate stream gauge pressure of 150 kPa, a permeation stream vacuum of −10 kPa, and an F/A ratio of 11.4 mL cm−2 min−1. The ammonia conversion rate and hydrogen recovery ratio were 99% and 93.3%, respectively.
Conflicts of interest
There are no conflicts to declare.Acknowledgements
This work was supported by the Korea Evaluation Institute of Industrial Technology (KEIT), Alchemist project, Republic of Korea (No. 20012383) and conducted under the framework of Research and Development Program of the Korea Institute of Energy Research (KIER) (C2-2415).References
- F. Dawood, M. Anda and G. M. Shafiullah, Int. J. Hydrogen Energy, 2020, 45, 3847–3869 CrossRef CAS.
- S. Chen, A. Kumar, W. C. Wong, M.-S. Chiu and X. Wang, Appl. Energy, 2019, 233, 321–337 CrossRef.
- A. M. Abdalla, S. Hossain, O. B. Nisfindy, A. T. Azad, M. Dawood and A. K. Azad, Energy Convers. Manage., 2018, 165, 602–627 CrossRef CAS.
- S. Sharma and S. K. Ghoshal, Renewable Sustainable Energy Rev., 2015, 43, 1151–1158 CrossRef CAS.
- H.-Y. Do, C.-H. Kim, J.-Y. Han, H.-S. Kim and S.-K. Ryi, J. Membr. Sci., 2021, 634 Search PubMed.
- J.-H. Wee, Renewable Sustainable Energy Rev., 2007, 11, 1720–1738 CrossRef CAS.
- T. da Silva Veras, T. S. Mozer, D. da Costa Rubim Messeder dos Santos and A. da Silva César, Int. J. Hydrogen Energy, 2017, 42, 2018–2033 CrossRef CAS.
- A. Iulianelli, P. Ribeirinha, A. Mendes and A. Basile, Renewable Sustainable Energy Rev., 2014, 29, 355–368 CrossRef CAS.
- J. L. Contreras, J. Salmones, J. A. Colín-Luna, L. Nuño, B. Quintana, I. Córdova, B. Zeifert, C. Tapia and G. A. Fuentes, Int. J. Hydrogen Energy, 2014, 39, 18835–18853 CrossRef CAS.
- Y. Qiu, E. Fu, F. Gong and R. Xiao, Int. J. Hydrogen Energy, 2022, 47, 5044–5052 CrossRef.
- J. L. Cerrillo, N. Morlanés, S. R. Kulkarni, N. Realpe, A. Ramírez, S. P. Katikaneni, S. N. Paglieri, K. Lee, A. Harale, B. Solami, A. Jamal, S. Mani Sarathy, P. Castaño and J. Gascon, Chem. Eng. J., 2022, 431 Search PubMed.
- V. Cechetto, L. Di Felice, J. A. Medrano, C. Makhloufi, J. Zuniga and F. Gallucci, Fuel Process. Technol., 2021, 216 Search PubMed.
- E.-H. Lee, T.-W. Kim, S.-G. Byun, D.-W. Seo, H.-J. Hwang, H.-S. Kim and S.-K. Ryi, Clean Technol., 2022, 28, 54–62 Search PubMed.
- C.-H. Kim, J.-Y. Han, H. Lim, K.-Y. Lee and S.-K. Ryi, J. Membr. Sci., 2018, 563, 75–82 CrossRef CAS.
- A. Li, J. R. Grace and C. J. Lim, J. Membr. Sci., 2007, 306, 159–165 CrossRef CAS.
- S. Yun and S. Ted Oyama, J. Membr. Sci., 2011, 375, 28–45 CrossRef CAS.
- M. R. Rahimpour, F. Samimi, A. Babapoor, T. Tohidian and S. Mohebi, Chem. Eng. Process., 2017, 121, 24–49 CrossRef CAS.
- J.-Y. Han, C.-H. Kim, H. Lim, K.-Y. Lee and S.-K. Ryi, Int. J. Hydrogen Energy, 2017, 42, 12310–12319 CrossRef CAS.
- S. Uemiya, N. Sato, H. Ando, Y. Kude, T. Matsuda and E. Kikuchi, J. Membr. Sci., 1991, 56, 303–313 CrossRef CAS.
- C.-H. Kim, J.-Y. Han, H. Lim, K.-Y. Lee and S.-K. Ryi, Int. J. Hydrogen Energy, 2018, 43, 5863–5872 CrossRef CAS.
- C.-H. Kim, J.-Y. Han, S. Kim, B. Lee, H. Lim, K.-Y. Lee and S.-K. Ryi, Int. J. Hydrogen Energy, 2018, 43, 7684–7692 CrossRef CAS.
- Y. Okinaka and C. Wolowodiuk, Electroless Plating: Fundamentals and Applications, 1990, pp. 421–440 Search PubMed.
- A. Alkali, J. Power Energy Eng., 2020, 8, 1 CrossRef.
- D. Alique, D. Martinez-Diaz, R. Sanz and J. A. Calles, Membranes, 2018, 8, 5 CrossRef PubMed.
- R. Sitar, J. Shah, Z. Zhang, H. Wikoff, J. D. Way and C. A. Wolden, J. Membr. Sci., 2022, 644 Search PubMed.
- Y. Cheng and K. Yeung, J. Membr. Sci., 2001, 182, 195–203 CrossRef CAS.
- B.-S. Seo, J.-Y. Han, K.-Y. Lee, D.-W. Kim and S.-K. Ryi, Korean J. Chem. Eng., 2016, 34, 266–272 CrossRef.
- M. E. Ayturk and Y. H. Ma, J. Membr. Sci., 2009, 330, 233–245 CrossRef CAS.
- R. S. Souleimanova, A. S. Mukasyan and A. Varma, J. Membr. Sci., 2000, 166, 249–257 CrossRef CAS.
- T.-W. Kim, E.-H. Lee, S. Byun, D.-W. Seo, H.-J. Hwang, H.-C. Yoon, H. Kim and S.-K. Ryi, Energy, 2022, 260 CAS.
- S.-K. Ryi, J.-S. Park, K.-R. Hwang, D.-W. Kim and H.-S. An, Korean J. Chem. Eng., 2011, 29, 59–63 CrossRef.
- S.-K. Ryi, N. Xu, A. Li, C. J. Lim and J. R. Grace, Int. J. Hydrogen Energy, 2010, 35, 2328–2335 CrossRef CAS.
- B. K. R. Nair, J. Choi and M. P. Harold, J. Membr. Sci., 2007, 288, 67–84 CrossRef CAS.
- K. L. Yeung, S. C. Christiansen and A. Varma, J. Membr. Sci., 1999, 159, 107–122 CrossRef CAS.
- F. Braun, A. M. Tarditi and L. M. Cornaglia, J. Membr. Sci., 2011, 382, 252–261 CrossRef CAS.
- V. K. Bulasara, R. Uppaluri and M. K. Purkait, Surf. Eng., 2013, 29, 489–494 CrossRef CAS.
- A. Li, W. Liang and R. Hughes, Thin Solid Films, 1999, 350, 106–112 CrossRef CAS.
- L. Clime, D. Brassard, M. Geissler and T. Veres, Lab Chip, 2015, 15, 2400–2411 RSC.
- H. Chen, J. Zhou, J. Mao, J. Yin and S. Li, RSC Adv., 2016, 6, 101485–101491 RSC.
- Z. El-Bahy, R. Ohnishi and M. Ichikawa, Appl. Catal., B, 2003, 40, 81–91 CrossRef CAS.
- R. S. Souleimanova, A. S. Mukasyan and A. Varma, AIChE J., 2002, 48, 262–268 CrossRef CAS.
- J. N. Keuler, L. Lorenzen and S. Miachon, Sep. Sci. Technol., 2002, 37, 379–401 CrossRef CAS.
- F. Guazzone and Y. H. Ma, AIChE J., 2008, 54, 487–494 CrossRef CAS.
- F. Guazzone, E. A. Payzant, S. A. Speakman and Y. H. Ma, Ind. Eng. Chem. Res., 2006, 45, 8145–8153 CrossRef CAS.
- S.-K. Ryi, S.-W. Lee, D.-K. Oh, B.-S. Seo, J.-W. Park, J.-S. Park, D.-W. Lee and S. S. Kim, J. Membr. Sci., 2014, 467, 93–99 CrossRef CAS.
- L. Wei, J. Yu, X. Hu and Y. Huang, Int. J. Hydrogen Energy, 2012, 37, 13007–13012 CrossRef CAS.
- J. Tong, Y. Matsumura, H. Suda and K. Haraya, Sep. Purif. Technol., 2005, 46, 1–10 CrossRef CAS.
- J. Shu, B. Grandjean, E. Ghali and S. Kaliaguine, J. Membr. Sci., 1993, 77, 181–195 CrossRef CAS.
- P. P. Mardilovich, Y. She, Y. H. Ma and M. H. Rei, AIChE J., 1998, 44, 310–322 CrossRef CAS.
- S. Liguori, A. Iulianelli, F. Dalena, P. Pinacci, F. Drago, M. Broglia, Y. Huang and A. Basile, Membranes, 2014, 4, 143–162 CrossRef PubMed.
- Y. Huang and R. Dittmeyer, J. Membr. Sci., 2006, 282, 296–310 CrossRef CAS.
- H. W. A. El Hawa, S.-T. B. Lundin, N. S. Patki and J. D. Way, Int. J. Hydrogen Energy, 2016, 41, 10193–10201 CrossRef.
- S.-K. Ryi, J.-S. Park, S.-H. Kim, S.-H. Cho, D.-W. Kim and K.-Y. Um, Sep. Purif. Technol., 2006, 50, 82–91 CrossRef CAS.
- V. Cechetto, L. Di Felice, R. Gutierrez Martinez, A. Arratibel Plazaola and F. Gallucci, Int. J. Hydrogen Energy, 2022, 47, 21220–21230 CrossRef CAS.
- J. Zhang, H. Xu and W. Li, J. Membr. Sci., 2006, 277, 85–93 CrossRef CAS.
Footnote |
| † Electronic supplementary information (ESI) available. See DOI: https://doi.org/10.1039/d3ra01596c |
| This journal is © The Royal Society of Chemistry 2023 |

