 Open Access Article
Extraction of Se(IV) and Se(VI) from aqueous HCl solution by using a diamide-containing tertiary amine†
Hirokazu Narita *a,
Motoki Maedab,
Chiharu Tokorob,
Tomoya Suzuki
 a,
Mikiya Tanakac,
Hideaki Shiwakud and
Tsuyoshi Yaitad
aGlobal Zero Emission Research Center, National Institute of Advanced Industrial Science and Technology (AIST), 16-1 Onogawa, Tsukuba, Ibaraki 305-8569, Japan. E-mail: hirokazu-narita@aist.go.jp
bSchool of Creative Science and Engineering, Waseda University, 3-4-1 Okubo, Shinjuku, Tokyo 169-8555, Japan
cNational Institute of Advanced Industrial Science and Technology (AIST), 1-1-1 Umezono, Tsukuba, Ibaraki 305-8560, Japan
dMaterials Science Research Center, Japan Atomic Energy Agency (JAEA), 1-1-1 Koto, Sayo, Hyogo 679-5148, Japan
First published on 6th June 2023
Abstract
Here, we investigated the mechanism underlying the extraction of Se(IV) and Se(VI) from aqueous HCl solutions by N-2-ethylhexyl-bis(N-di-2-ethylhexyl-ethylamide)amine (EHBAA). In addition to examining extraction behavior, we also elucidated structural properties of the dominant Se species in solution. Two types of aqueous HCl solutions were prepared by dissolving a SeIV oxide or a SeVI salt. X-ray absorption near edge structure analyses revealed that Se(VI) was reduced to Se(IV) in 8 M HCl. Using 0.5 M EHBAA, ∼50% of Se(VI) was extracted from 0.5 M HCl. In contrast, Se(IV) was hardly extracted from 0.5 to 5 M HCl; however, at molar concentrations above 5 M, the extraction efficiency of Se(IV) increased drastically, reaching ∼85%. Slope analyses for the distribution ratios of Se(IV) in 8 M HCl and Se(VI) in 0.5 M HCl showed that apparent stoichiometries of Se(IV) or Se(VI) to EHBAA were 1![[thin space (1/6-em)]](https://www.rsc.org/images/entities/char_2009.gif) :
:![[thin space (1/6-em)]](https://www.rsc.org/images/entities/char_2009.gif) 1 and 1
1 and 1![[thin space (1/6-em)]](https://www.rsc.org/images/entities/char_2009.gif) :
:![[thin space (1/6-em)]](https://www.rsc.org/images/entities/char_2009.gif) 2, respectively. Extended X-ray absorption fine structure measurements revealed that the inner-sphere of the Se(IV) and Se(VI) complexes extracted with EHBAA was [SeOCl2] and [SeO4]2−, respectively. Together, these results indicate that Se(IV) is extracted from 8 M HCl with EHBAA via a solvation-type reaction, whereas Se(VI) is extracted from 0.5 M HCl via an anion-exchange-type reaction.
2, respectively. Extended X-ray absorption fine structure measurements revealed that the inner-sphere of the Se(IV) and Se(VI) complexes extracted with EHBAA was [SeOCl2] and [SeO4]2−, respectively. Together, these results indicate that Se(IV) is extracted from 8 M HCl with EHBAA via a solvation-type reaction, whereas Se(VI) is extracted from 0.5 M HCl via an anion-exchange-type reaction.
1. Introduction
Selenium (Se) has been widely used in various industrial fields.1,2 Industrial production of Se is mainly achieved by recovery as a byproduct from the anode slimes produced during copper smelting.3,4 Solvent extraction is one of the important methods for the recovery of Se; however, our understanding of the extraction of Se ions from acidic solutions and the precise speciation of Se ions in relatively concentrated HCl solutions remains largely incomplete. Se is also an essential trace element for humans and animals; however, its consumption in large amounts is detrimental to health. Therefore, there have been many studies conducted to determine the concentration and oxidation states of Se in the natural environment and to examine how best to facilitate its removal.5–7 Thus, more precise speciation data will facilitate the development of more efficient solvent extraction methods for Se.Many microextraction approaches have been reported for the solvent extraction of trace amounts of Se from media such as food and environmental water.7 However, approaches for the extraction of Se from highly acidic solutions are limited. Tri-n-butyl phosphate (TBP) has been successfully used for solvent extraction of Se(IV) from HCl solution.8–10 Interestingly, Chowdhury and Sanyal9 reported that the dominant complex extracted changes depending on the concentration of the HCl solution, with SeOCl2(TBP)2 being extracted from 3 to 6 M HCl and H2SeOCl4(TBP)2 being extracted from 6 to 10 M HCl. A TBP analog, tri-iso-butyl phosphate, has also been shown to extract Se(IV) from chloride aqueous solution at around pH 8.5.11 A protonated N-n-octylaniline has been shown to form an ion-pair complex with [HSeO3]−.12 In contrast, diammoniumcalix[4]arene has been shown to extract Se(VI) via ion-pair formation with [HSeO4]− or [SeO4]2−.13,14 The reactions of these extractants with Se were estimated mainly by slope analyses of the distribution ratio of Se between the organic and aqueous phases. Moving forward, direct structural information of the dominant Se species in the organic and aqueous phases is needed to understand the extraction behavior in more detail.
In acidic chloride solutions, Se(IV) and Se(VI) form selenous acid (H2SeO3) and selenic acid (H2SeO4), respectively, and dissociate to anions such as HSeO3−, SeO32−, HSeO4−, and SeO42− with a decrease in the acid concentration.15 For Se(IV), it has been suggested that an SeOCl2 complex forms in highly concentrated HCl solutions (4–12 M), and at even higher concentrations (∼15 M) SeCl5− is produced.16 Compared with the number of reports providing structural information for some precious metals and base metals, which are present in the anode slimes, there are fewer reports providing structural information about Se ions in acidic chloride solutions. Knowledge of the structure of Se ions in the aqueous phase is needed for the development of new extractants because extraction type is highly dependent on the dominant Se complex in solution.
Our group has been examining the possibility of using amide-containing tertiary amines (ACTAs) as extractants of metal ions.17–22 ACTAs efficiently extract chlorometalates via an anion-exchange reaction because of their stable protonation ability.21 They also extract rare earth elements from HNO3 via a solvation reaction.22 In particular, ACTAs have excellent extraction efficiency for platinum-group metals from HCl solutions. For example, diamide- and triamide-type ACTAs are able to extract [RhCl5(H2O)]2−, an aqua–chloro complex, despite this complex generally being considered unextractable.18,21 ACTAs are also much more efficient extractants of metal complex anions than the typical tertiary amine extractant tri-n-octyl amine (TOA). We therefore expected that ACTAs could be used to efficiently extract Se from HCl.
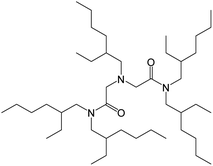
Here, we examined the extraction of Se(IV) and Se(VI) from aqueous HCl solutions by using a diamide-containing tertiary amine, N-2-ethylhexyl-bis(N-di-2-ethylhexyl-ethylamide)amine (EHBAA) (Fig. 1). We discuss the underlying extraction mechanism based on a slope analysis of the distribution ratio of Se ions between the organic and aqueous phases and structural data for the dominant Se complexes in the solutions obtained by X-ray absorption fine structure (XAFS) analysis. To allow comparison, the efficacies of the extractants TOA and TBP were also examined.
2. Experimental
2.1. Reagents
SeO2 (FUJIFILM Wako Pure Chemical Co.) and Na2SeO4·10H2O (Alfa Aesar) were used as an Se(IV) oxide and Se(VI) salt, respectively. EHBAA (purity: 96%) was provided by Chemicrea Inc. TBP and TOA were purchased from the Tokyo Chemical Industry Co. The extractants were used without further purification. All the other chemicals used were of reagent grade.2.2. Solutions of Se in aqueous HCl
Aqueous solutions of Se ions were prepared by dissolving SeO2 or Na2SeO4·10H2O in aqueous HCl. Hereafter, the aqueous solutions are abbreviated as SolAxH and SolBxH, where ‘A’ = SeO2, ‘B’ = Na2SeO4·10H2O, and ‘x’ = HCl concentration (M). The Se concentration was 0.001 M for the solvent extraction experiments and 0.1 M for the XAFS measurements. For the solvent extraction experiments, the aqueous solutions were used at 12 h after oxide or salt dissolution. For the XAFS measurements, mainly the aqueous solutions were used at 3 w after oxide or salt dissolution.2.3. Solvent extraction
An 80/20 (v/v) n-dodecane/2-ethylhexanol mixture was used as the diluent for the extractants. Equal volumes of one of the diluted extractants (EHBAA, TOA, or TBP) and of Se-free HCl solution were added to a 10 mL glass tube, and the tube was shaken vertically for 30 min at an amplitude of 100 mm and a frequency of 200 stroke per min and then centrifuged. Next 1 mL of the HCl-equilibrated organic phase and the same volume of HCl solution containing 0.001 M Se (SolAxH or SolBxH) was similarly shaken for 60 min and then centrifuged. The shaking time was sufficient to ensure that the extraction equilibrium was reached. The concentrations of Se ions in the aqueous phase were measured by ICP-AES (Horiba ULTIMA2). The concentrations in the organic phase were calculated from the mass balance of the metal ions before and after extraction. The data accuracy was within 5%. The extractions were performed at room temperature (23 ± 2 °C). The extraction percentage (E%) and distribution ratio (D) were calculated by using eqn (1) and (2), respectively, where [Se]init,aq, [Se]eq,org, and [Se]eq,aq denote the Se concentrations in the initial aqueous phase, the equilibrated organic phase after extraction, and the equilibrated aqueous phase after extraction, respectively.| E% = ([Se]eq,org/[Se]init,aq) × 100 = {([Se]init,aq − [Se]eq,aq)/([Se]init,aq)} × 100 | (1) |
| D = [Se]eq,org/[Se]eq,aq = ([Se]init,aq − [Se]eq,aq)/[Se]eq,aq | (2) |
2.4. XAFS measurements
Four aqueous solutions, SolA0.5H, SolA8H, SolB0.5H, and SolB8H ([Se] = 0.1 M), were prepared. For SolB8H, the dependence on standing time was investigated because a change in the oxidation state was suggested during the solvent extraction experiment. Organic solutions containing Se complexes extracted with EHBAA were prepared by the solvent extraction method detailed in Section 2.3. SolA8H and SolB0.5H ([Se] = 0.1 M) and 0.5 M EHBAA were used for the aqueous and organic phases, respectively. The concentration of the Se complexes extracted with EHBAA from SolA8H and SolB05H (hereafter abbreviated to ExSolA and ExSolB, respectively) was 0.08 M for ExSolA and 0.05 M for ExSolB. The solutions were transferred to 10 mm diameter polyethylene cells, which were then tightly sealed. Solid reference samples were prepared by grinding the Se oxide or salt with boron nitrate and then pelleting the resulting powder.XAFS measurements were performed at the BL11XU beamline of SPring-8 (8 GeV at ∼99 mA). Synchrotron X-ray radiation was monochromatized using Si(111) crystal monochromators. Se K-edge XAFS spectra were collected in transmission mode using two ion chambers (both filled with N2) at room temperature (∼25 °C). The beam size on the sample was about 1 × 1 mm2. The SeO2 was used for energy calibration prior to X-ray absorption near edge structure (XANES) measurements; the peak top of the Se K-edge (white line) was aligned to 12![[thin space (1/6-em)]](https://www.rsc.org/images/entities/char_2009.gif) 664 eV.23 XAFS data were collected three times and then averaged for each sample.
664 eV.23 XAFS data were collected three times and then averaged for each sample.
Data processing was performed with the EXAFS data analysis software package WinXAS version 4.0.24 Theoretical phases and amplitudes were calculated by using the software FEFF 8.25 For the FEFF calculations, the crystal structures of (SeIVO3)2− in [Na2SeO3],26 (SeVIO4)2− in [(NH4)4H2(SeO4)3],27 and (SeIVOCl2) in [SbCl5·SeOCl2]28 were used as model compounds. Multiple scattering paths were ignored because their contribution was not significant for the studied systems. Thus, we considered only single scattering paths: Se–O and/or Se–Cl. The k-range for the Fourier transforms was 4–12 Å−1 for SolA0.5H and 4–13 Å−1 for the others, and the curve-fitting R-range was 0.5–2.5 Å for SolA8H and ExSolA, and 0.8–2.0 Å for the others. The coordination geometry of Se in 0.5 M HCl solution (SolA0.5H) is tetragonal SeO3 because SeO32−, HSeO4−, and/or H2SeO4 are present.15 Therefore, the coordination number was kept constant at 3 and the amplitude reduction factor, S02, was refined; the obtained S02 value (0.86(3)) was used for all fits. This value was considered reasonable because the obtained number of correlations (coordination number), N, for Se–O for the solid reference samples, SeIVO2 and Na2SeVIO4·10H2O, was 3.1(3) and 4.0(4), respectively (Fig. S3 and Table S1†). The structural parameters (N; bond distance, r (Å); Debye–Waller factor squared, σ2 (Å2); and the shift in threshold energy, ΔE0 (eV)) were allowed to vary in the fit; the same ΔE0 value was used for each shell. The difference in bond lengths between Se–O and Se–Cl was distinguishable because their difference is more than the smallest separation,29 given by Δr = π/2Δk (Δk ≈ 9 Å−1, Δr ≈ 0.17 Å). The fitting quality was checked by using the R-factor: {Σ|k3χ(k)obs − k3χ(k)calc|/Σ|k3χ(k)obs|} × 100.
3. Results and discussion
3.1. Effect of HCl concentration on Se ion extraction
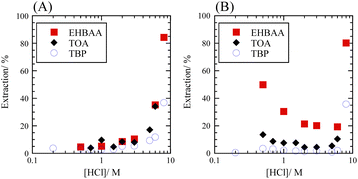
The extraction percentage of Se as a function of HCl concentration with 0.5 M extractants was determined for SolAxH and SolBxH. Three extractants were examined: EHBAA, TOA, and TBP. Third phase formation was observed at 0.5 M and 8 M HCl in the TOA system. In the SolAxH system, very little Se was extracted at HCl concentrations below 5 M; however, the extraction percentage rapidly increased at HCl concentrations above 5 M for each of the extractants (Fig. 2A). In the SolBxH system, similar rapid increases were observed at HCl concentrations above 5 M for each of the extractants (Fig. 2B); however, extraction percentages up to 50% were obtained at HCl concentrations below 5 M, depending on the extractant. The extraction efficiency in this region decreased in the order of EHBAA ≫ TOA > TBP, indicating that anion-exchange extraction predominantly occurred at concentrations of 0.5–5 M because TBP is a weak anion exchanger,30 and EHBAA is a more efficient extractant of metal complex anions than TOA.17–19,21 According to a previous study examining the reduction of Se(VI), Se(VI) is rapidly reduced to Se(IV) by chloride in a strongly acidic medium;31 a similar reduction of Se(VI) to Se(IV) was indicated to have occurred at HCl concentrations above 5 M in the SolBxH system.3.2. Dominant Se species in aqueous HCl solution
Fig. 3 shows the Se K-edge XANES spectra obtained for SolA0.5H, SolA8H, SolB0.5H, and SolB8H, together with the spectra for solid samples of SeIVO2 and Na2SeVIO4·10H2O for reference. The peak positions in the spectra for SolA0.5H and SolA8H were in good agreement with that of the solid SeIVO2 sample. In contrast, although the peak position in the spectrum for SolB0.5H was in good agreement with that of the solid Na2SeVIO4·10H2O sample, the peak position for SolB8H was in agreement with that of SeIVO2, indicating that Se(VI) in 8 M HCl was reduced to Se(IV) after dissolution. This is consistent with the findings from the extraction experiment discussed in Section 3.1.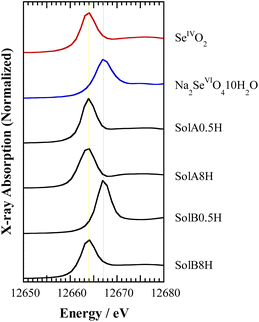 | ||
| Fig. 3 Se K-edge XANES spectra for the aqueous solutions SolA0.5H, SolA8H, SolB0.5H, and SolB8H and the reference solids SeIVO2 and Na2SeVIO4·10H2O. | ||
The time for this reduction to occur was investigated by XANES measurement using SolB8H solutions that were left to stand before analysis (Fig. S1†). The spectra show that Se(VI) was reduced to Se(IV) within 12 h after dissolution.
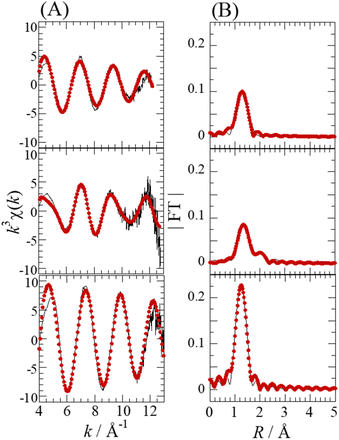
Fig. 4 shows the Se K-edge k3-weighted EXAFS spectra and corresponding Fourier transforms for SolA0.5H, SolA8H, and SolB0.5H. An intense peak seen at ∼1.3 Å in each spectrum (Fig. 4B) was assigned to the Se–O correlation. For SolA8H, in addition to the intense peak, there was a small peak at ∼2 Å, which was assigned to the Se–Cl correlation. The curve-fitting results are shown in Table 1. According to the pKa1 value of selenous acid (∼2.5),15 H2SeO3 is predominant in 0.5 M HCl solution. In contrast, in >7 M HCl solution both [SeOCl2] and [H2SeO3] are present, and in 15 M HCl solution SeCl5− is dominant.16 For SolA0.5H, both the N value (3) and Se–O bond length (1.71(1) Å) were almost the same as those for the crystal structure of [SeO3]−.26 The small peak at ∼2 Å for SolA8H was confirmed to represent the Se–Cl correlation by the obtained structural parameters. The obtained N values for Se–O and Se–Cl were 1.8(1) and 1.1(1), which although not consistent with the structure of the [SeOCl2] complex, are consistent with a mixture of [SeOCl2] and [H2SeO3]. Although Raman studies have inferred the existence of a [SeO2Cl]− complex anion,32 that study conducted measurements not in HCl aqueous solution but in solid and acetonitrile. For SolB0.5H, the curve-fitting results (Se–O: N = 4.4(4), r = 1.633(4) Å) indicated that the inner-sphere structure is tetrahedral SeO4, which is consistent with the XANES spectrum. According to the pKa2 of selenic acid (1.6–2.0),15 both [SeO4]2− and [HSeO4]− would exist in low-pH solutions.
| Na | rb (Å) | σ2![[thin space (1/6-em)]](https://www.rsc.org/images/entities/char_2009.gif) c (Å2) c (Å2) |
ΔEd (eV) | R-factore | ||
|---|---|---|---|---|---|---|
| a Coordination number.b Bond distance (Å).c Debye–Waller factor squared (Å2).d The shift in threshold energy (eV).e Residual: R-factor = Σ|k3χ(k)obs − k3χ(k)calc|/Σ|k3χ(k)obs| × 100.f Fixed parameter.g Ref. 26.h Averaged bond distances.i Ref. 28.j Ref. 33.k Ref. 27. Estimated errors are shown in parentheses. | ||||||
| SolA0.5H | Se–O | 3f | 1.71(1) | 0.0048(9) | 9(1) | 18 |
| SolA8H | Se–O | 1.8(1) | 1.70(1) | 0.0016(5) | 5.8(5) | 7.9 |
| Se–Cl | 1.1(1) | 2.29(1) | 0.0065(6) | |||
| SolB0.5H | Se–O | 4.4(4) | 1.633(4) | 0.0014(6) | 8(1) | 13 |
| ExSolA | Se–O | 1.0(2) | 1.64(2) | 0.002(1) | 5(1) | 14 |
| Se–Cl | 2.0(3) | 2.28(2) | 0.006 (1) | |||
| ExSolB | Se–O | 3.8(3) | 1.632(4) | 0.0018(5) | 5(1) | 8.5 |
| Crystal structures | ||||||
| [Na2SeO3]g | Se–O | 3 | 1.71h | |||
| [SbCl5·SeOCl2]i | Se–O | 1 | 1.69 | |||
| Se–Cl | 2 | 2.12h | ||||
| [TiCl3(SeOCl2)2]2(μ-O)j | Se–O | 1 | 1.644 | |||
| Se–Cl | 2 | 2.145h | ||||
| [(NH4)4H2(SeO4)3]k | Se–O | 4 | 1.64h | |||
3.3. Structure of the Se complexes extracted with EHBAA
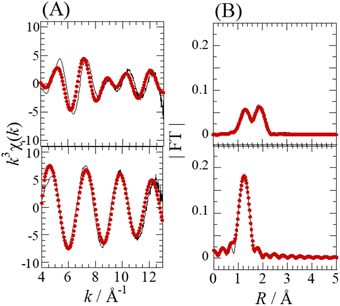
The Se complexes extracted with EHBAA from SolA8H and SolB0.5H (abbreviated as ExSolA and ExSolB, respectively) were examined by XAFS. The XANES spectra obtained for these extracts indicated that the oxidation state of Se is retained after being extracted into the organic phase (Fig. S2†). The Se K-edge k3-weighted EXAFS spectra and the corresponding Fourier transforms for ExSolA and ExSolB are shown in Fig. 5. In the Fourier transform for ExSolA, two intense peaks were seen at ∼1.3 and ∼2 Å. The ∼2 Å peak was more intense than that observed in the spectrum for the aqueous phase (i.e., in the spectrum for SolA8H). The ratio of N(Se–O) to N(Se–Cl) for ExSolA was about 1![[thin space (1/6-em)]](https://www.rsc.org/images/entities/char_2009.gif) :
:![[thin space (1/6-em)]](https://www.rsc.org/images/entities/char_2009.gif) 2, which is different from that for SolA8H (2
2, which is different from that for SolA8H (2![[thin space (1/6-em)]](https://www.rsc.org/images/entities/char_2009.gif) :
:![[thin space (1/6-em)]](https://www.rsc.org/images/entities/char_2009.gif) 1). In the reported crystal structures of [SeOCl2], the bond lengths of Se–O (1.644–1.69 Å) and Se–Cl (2.12–2.145 Å) vary slightly.28,32 The parameter of Se–Cl obtained in the present study is longer than these values, suggesting that the slight structural change of the SeOCl2 moiety in solution. In contrast, the XANES and EXAFS spectra for ExSolB are very similar to those for SolB0.5H, which is consistent with the obtained structural parameters indicating the presence of SeO4, as was observed for SolB0.5H.
1). In the reported crystal structures of [SeOCl2], the bond lengths of Se–O (1.644–1.69 Å) and Se–Cl (2.12–2.145 Å) vary slightly.28,32 The parameter of Se–Cl obtained in the present study is longer than these values, suggesting that the slight structural change of the SeOCl2 moiety in solution. In contrast, the XANES and EXAFS spectra for ExSolB are very similar to those for SolB0.5H, which is consistent with the obtained structural parameters indicating the presence of SeO4, as was observed for SolB0.5H.
3.4. Extraction mechanism of Se(IV) and Se(VI)
Fig. 6 shows the dependence of the distribution ratio of Se on the EHBAA concentration for SolA8H and SolB0.5H. The slope values are different between SolA8H and SolB0.5H, indicating that 1![[thin space (1/6-em)]](https://www.rsc.org/images/entities/char_2009.gif) :
:![[thin space (1/6-em)]](https://www.rsc.org/images/entities/char_2009.gif) 1 Se(IV)
1 Se(IV)![[thin space (1/6-em)]](https://www.rsc.org/images/entities/char_2009.gif) :
:![[thin space (1/6-em)]](https://www.rsc.org/images/entities/char_2009.gif) EHBAA and 1
EHBAA and 1![[thin space (1/6-em)]](https://www.rsc.org/images/entities/char_2009.gif) :
:![[thin space (1/6-em)]](https://www.rsc.org/images/entities/char_2009.gif) 2 Se(VI)
2 Se(VI)![[thin space (1/6-em)]](https://www.rsc.org/images/entities/char_2009.gif) :
:![[thin space (1/6-em)]](https://www.rsc.org/images/entities/char_2009.gif) EHBAA complexes are formed, respectively. Since EHBAA is readily protonated as contacting with HCl solution,19,21 ion-pair formation with a complex anion preferentially occurs. Also, neutral complexes may be extracted by EHBAA via a solvation reaction.22 For the EHBAA–SolA8H system, the EXAFS results suggested that a SeOCl2 moiety is dominant in the organic phase. Therefore, the extraction reaction can be presented as
EHBAA complexes are formed, respectively. Since EHBAA is readily protonated as contacting with HCl solution,19,21 ion-pair formation with a complex anion preferentially occurs. Also, neutral complexes may be extracted by EHBAA via a solvation reaction.22 For the EHBAA–SolA8H system, the EXAFS results suggested that a SeOCl2 moiety is dominant in the organic phase. Therefore, the extraction reaction can be presented as| EHBAA + HCl ⇄ EHBAA·HCl | (3) |
| (EHBAA·HCl) + [SeOCl2] ⇄ [SeOCl2](EHBAA·HCl) | (4) |
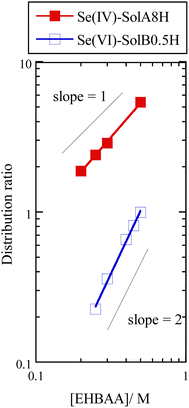 | ||
| Fig. 6 Dependence of distribution ratio of Se(IV) and Se(VI) on EHBAA concentration. Organic phase, EHBAA pre-equilibrated with 0.5 or 8 M HCl; aqueous phase, SolA8H or SolB0.5H, [Se] = 0.001 M. | ||
The SolA8H solution probably contains neutral [H2SeO4] and [SeOCl2], as mentioned in Section 3.2. The very low extraction percentage of Se in the HCl concentration range of 0.5–5 M, indicates that [H2SeO4], which was the dominant species at those concentrations, was unextractable. Although [SeOCl2] is not anionic, a higher reactivity can be expected than that of [H2SeO4].1 A previous study using TBP also showed that TBP did not extract [H2SeO4], but instead it extracted [SeOCl2] and [H2SeOCl4].9
Regarding the protonated structure of EHBAA,21 an H+ is chelated by two amide oxygen atoms and an amine nitrogen atom, and a Cl− weakly bonds to an array of polarized C–Hδ+ units on the opposite side of EHBAA from the protonation site. Considering the stable protonation ability of EHBAA, solvation with [SeOCl2] possibly occurs at the site opposite the diamide oxygen atoms. The crystal structure of [TiCl3(SeOCl2)2]2(μ-O)·CH2Cl2 has three long-distance Se⋯Cl interactions (2.930–3.465 Å) and two direct Se–Cl bonds (avg. 2145 Å).33 The Cl− in the EHBAA·HCl complex might have a weak interaction with [SeOCl2] at the outer-sphere of the Se, although the interaction was too weak to produce a peak in the EXAFS spectrum.
For the EHBAA–SolB0.5H system, the EXAFS results show that SeO4 was dominant in both the organic and aqueous phases. In the aqueous phase, both [HSeO4]− and [SeO4]2− existed, as mentioned in Section 3.2. Two protonated EHBAA may preferentially extract a [SeO4]2− complex via an anion-exchange reaction, as supported by the formation of a 1![[thin space (1/6-em)]](https://www.rsc.org/images/entities/char_2009.gif) :
:![[thin space (1/6-em)]](https://www.rsc.org/images/entities/char_2009.gif) 2 complex in the organic phase. In addition, the decreasing extraction percentage of Se(VI) in the low HCl concentration range of 0.5–5 M (Fig. 2B) probably stems from the change in the dominant Se species in the order of [SeO4]2− → [HSeO4]− → [H2SeO4].15 Similarly, the low extraction percentage reported for TBP in this low concentration region can be explained by its lower basicity (i.e., its low protonation ability).30 Therefore, the extraction reaction of Se(VI) from 0.5 M HCl can be represented as
2 complex in the organic phase. In addition, the decreasing extraction percentage of Se(VI) in the low HCl concentration range of 0.5–5 M (Fig. 2B) probably stems from the change in the dominant Se species in the order of [SeO4]2− → [HSeO4]− → [H2SeO4].15 Similarly, the low extraction percentage reported for TBP in this low concentration region can be explained by its lower basicity (i.e., its low protonation ability).30 Therefore, the extraction reaction of Se(VI) from 0.5 M HCl can be represented as
| [SeO4]2− + 2(EHBAA·HCl) ⇄ [SeO4]·(EHBAA·H)2 + 2Cl− | (5) |
4. Conclusions
Here, we used XAFS to investigate the extraction of Se by EHBAA from two types of aqueous HCl solution (SolAxH made by dissolving SeO2 and SolBxH made by dissolving Na2SeO4·10H2O). SolB8H mostly contained Se(IV) species due to a reduction of Se(VI) to Se(IV). In the EHBAA–SolAxH system, the extraction percentage of Se rapidly increased at HCl concentrations above 5 M, but was poor below that limit. In contrast, in the SolBxH systems, ∼50% of Se was extracted with EHBAA at 0.5 M HCl; the extraction percentage of Se gradually decreased with an increase in HCl concentration up to 5 M; and then it rapidly increased at HCl concentrations above 5 M, although this rapid increase was due to the reduction to Se(IV). The XAFS measurements indicated that the inner-sphere structures of the dominant Se complexes were SeO3 for SolA0.5H, a mixture of SeO3 and SeOCl2 for SolA8H, and SeO4 for SolB0.5H. The EXAFS curve-fitting results showed that the Se complexes extracted with EHBAA have inner-sphere structures of SeOCl2 for SolA8H and of SeO4 for SolB0.5H. The relationship between the distribution ratio of Se and EHBAA concentration revealed that 1![[thin space (1/6-em)]](https://www.rsc.org/images/entities/char_2009.gif) :
:![[thin space (1/6-em)]](https://www.rsc.org/images/entities/char_2009.gif) 1 and 1
1 and 1![[thin space (1/6-em)]](https://www.rsc.org/images/entities/char_2009.gif) :
:![[thin space (1/6-em)]](https://www.rsc.org/images/entities/char_2009.gif) 2 Se
2 Se![[thin space (1/6-em)]](https://www.rsc.org/images/entities/char_2009.gif) :
:![[thin space (1/6-em)]](https://www.rsc.org/images/entities/char_2009.gif) EHBAA complexes were dominant in the organic phase of the SolA8H and SolB0.5H systems. The obtained results suggested that the dominant Se complexes with EHBAA are [SeOCl2](EHBAA·HCl) for SolA8H and [SeO4](EHBAA·H)2 for SolB0.5H; the former was a solvation-type extraction, and the latter was an anion-exchange-type.
EHBAA complexes were dominant in the organic phase of the SolA8H and SolB0.5H systems. The obtained results suggested that the dominant Se complexes with EHBAA are [SeOCl2](EHBAA·HCl) for SolA8H and [SeO4](EHBAA·H)2 for SolB0.5H; the former was a solvation-type extraction, and the latter was an anion-exchange-type.
Author contributions
Hirokazu Narita: conceptualization, methodology, validation, formal analysis, investigation, writing – original draft, visualization, writing – review & editing; Motoki Maeda: validation, investigation, Chiharu Tokoro: methodology, visualization; Tomoya Suzuki: data curation, formal analysis; Mikiya Tanaka: writing – review & editing; Hideaki Shiwaku: methodology, formal analysis; Tsuyoshi Yaita: methodology, formal analysis.Conflicts of interest
There are no conflicts to declare.Acknowledgements
The authors wish to thank Ms. Tomoko Saito for technical assistance. A part of this work was performed under the Shared Use Program of JAEA Facilities (Proposal No. 2013B-E08) supported by JAEA Advanced Characterization Nanotechnology Platform as a program of “Nanotechnology Platform” of the Ministry of Education, Culture, Sports, Science and Technology (MEXT), Japan. The synchrotron radiation experiments were performed at JAEA beamline BL11XU in SPring-8 (Proposal No. 2013B3518).Notes and references
- W. H. Midura and M. Midura, in Encyclopedia of Inorganic and Bioinorganic Chemistry, John Wiley & Sons, Ltd., 2014 Search PubMed.
- S. Chaudhary, A. Umar and S. K. Mehta, Prog. Mater. Sci., 2016, 83, 270–329 CrossRef CAS.
- G. Liu, Y. Wu, A. Tang, D. Pan and B. Li, Hydrometallurgy, 2020, 197, 105460 CrossRef CAS.
- Z. Dong, T. Jiang, B. Xu, J. Yang, Y. Chen, Q. Li and Y. Yang, Chem. Eng. J., 2020, 393, 124762 CrossRef CAS.
- A. Połatajako, N. Jakubowski and J. Szpunar, J. Anal. At. Spectrom., 2006, 21, 639–654 RSC.
- Y. liu, M. He, B. Chen and B. Hu, Talanta, 2015, 142, 213–220 CrossRef CAS PubMed.
- E. A. Azooz, M. Tuzen, W. I. Mortaba and N. Ullah, Crit. Rev. Anal. Chem., 2022 DOI:10.1080/10408347.2022.2153579.
- Y.-C. Hou, C.-C. Chang, W.-L. Cheng and I.-S. Shaw, Hydrometallurgy, 1983, 9, 381–392 CrossRef.
- M. R. Chowdhury and S. K. Sanyal, Hydrometallurgy, 1993, 32, 189–200 CrossRef CAS.
- M. R. Chowdhury and S. K. Sanyal, Hydrometallurgy, 1994, 34, 319–330 CrossRef CAS.
- A. Sattari, M. Kavousi and E. K. Alamdari, Trans. Indian Inst. Met., 2017, 70, 1103–1109 CrossRef CAS.
- B. M. Sargar, S. V. Mahamuni and M. A. Anuse, J. Saudi Chem. Soc., 2011, 15, 177–185 CrossRef CAS.
- W. Aeungmaitrepirom, A. Hagège, Z. Asfari, L. Bennouna, J. Vicens and M. Leroy, Tetrahedron Lett., 1999, 40, 6389–6392 CrossRef CAS.
- W. Aeungmaitrepirom, A. Hagege, Z. Asfari, J. Vicens and M. Leroy, J. Inclusion Phenom. Macrocyclic Chem., 2001, 40, 225–229 CrossRef CAS.
- F. Séby, M. P. Gautier, E. Giffaut, G. Borge and O. F. X. Donard, Chem. Geol., 2001, 171, 173–194 CrossRef.
- J. Milne and P. LaHaie, Inorg. Chem., 1979, 18, 3180–3183 CrossRef CAS.
- H. Narita, K. Morisaku and M. Tanaka, Chem. Commun., 2008, 45, 5921–5923 RSC.
- H. Narita, K. Morisaku and M. Tanaka, Solvent Extr. Ion Exch., 2015, 33, 407–441 CrossRef CAS.
- M. Maeda, H. Narita, C. Tokoro, M. Tanaka, R. Motokawa, H. Shiwaku and T. Yaita, Sep. Purif. Technol., 2017, 177, 176–181 CrossRef CAS.
- T. Suzuki, T. Ogata, M. Tanaka, T. Kobayashi, H. Shiwaku, T. Yaita and H. Narita, Metals, 2018, 8, 558 CrossRef.
- H. Narita, R. M. Nicolson, R. Motokawa, F. Ito, K. Morisaku, M. Goto, M. Tanaka, W. T. Heller, H. Shiwaku, T. Yaita, R. J. Gordon, J. B. Love, P. A. Tasker, E. R. Schofield, M. R. Antonio and C. A. Morrison, Inorg. Chem., 2019, 58, 8720–8734 CrossRef CAS PubMed.
- S. Uchino, H. Narita, K. Kita, H. Suzuki, T. Matsumura, H. Naganawa, K. Sakaguchi and K. Ohto, Solvent Extr. Res. Dev., Jpn., 2023, 30, 39–46 CrossRef CAS.
- F. E. Huggins, C. L. Senior, P. Chu, K. Ladwig and G. P. Huffman, Environ. Sci. Technol., 2007, 41, 3284–3289 CrossRef CAS PubMed.
- T. Ressler, J. Synchrotron Radiat., 1998, 5, 118–122 CrossRef CAS PubMed.
- A. L. Ankudinov, B. Ravel, J. J. Rehr and S. D. Conradson, Phys. Rev. B: Condens. Matter Mater. Phys., 1998, 58, 7565–7576 CrossRef CAS.
- R. B. Helmholdt, E. J. Sonneveld and H. Schenk, Z. Kristall., 1999, 214, 151–153 CAS.
- A. Pawłowski and A. Haznar, J. Solid State Chem., 2001, 160, 189–194 CrossRef.
- Y. Hermodsson, Acta Chem. Scand., 1967, 21, 1313–1327 CrossRef CAS.
- J. E. Penner-Hahn, Coord. Chem. Rev., 1999, 190–192, 1101–1123 CrossRef CAS.
- F. L. Bernardis, R. A. Grant and D. C. Sherrington, React. Funct. Polym., 2005, 65, 205–217 CrossRef CAS.
- J. Pettersson and Å. Olin, Talanta, 1991, 38, 413–417 CrossRef CAS PubMed.
- P. Lahaie and J. Milne, Inorg. Chem., 1979, 18, 632–637 CrossRef CAS.
- F. Calderazzo, M. D'Attoma, F. Marchetti and G. Pampaloni, J. Chem. Soc., Dalton Trans., 2000, 2497–2498 RSC.
Footnote |
| † Electronic supplementary information (ESI) available. See DOI: https://doi.org/10.1039/d3ra01341c |
| This journal is © The Royal Society of Chemistry 2023 |

