 Open Access Article
Ultrasensitive electrochemical biosensor for detection of circulating tumor cells based on a highly efficient enzymatic cascade reaction†
Min Donga,
Zhihong Gaoa,
Yating Zhanga,
Jiahui Caia,
Jian Li a,
Panpan Xua,
Hong Jiang
 *a,
Jianmin Gu
 *ab and
Jidong Wang
 *ab
*ab
aHebei Key Laboratory of Applied Chemistry, Nano-biotechnology Key Lab of Hebei Province, School of Environmental and Chemical Engineering, Yanshan University, Qinhuangdao 066004, China. E-mail: wangjidong@ysu.edu.cn
bState Key Laboratory of Metastable Materials Science and Technology (MMST), Yanshan University, Qinhuangdao 066004, China
First published on 26th April 2023
Abstract
There has been great interest in the enzymatic cascade amplification strategy for the electrochemical detection of circulating tumor cells (CTCs). In this work, we designed a highly efficient enzymatic cascade reaction based on a multiwalled carbon nanotubes–chitosan (MWCNTs–CS) composite for detection of CTCs. A high electrochemical effective surface area was obtained for a MWCNTs–CS-modified glassy carbon electrode (GCE) for loading glucose oxidase (GOD), as well as a high loading rate and high electrical activity of the enzyme. As a ‘power source’, the MWCNTs–CS composites provided a strong driving power for horseradish peroxidase (HRP) on the surface of polystyrene (PS) microspheres, which acted as probes for capturing CTCs and allowed the reaction to proceed with further facilitation of electron transfer. Aptamer, CTCs, and PS microspheres with HRP and anti-epithelial cell adhesion molecule (anti-EpCAM) antibody were assembled on the MWCNTs–CS/GCE to allow for the modulation of enzyme distance at the micrometer level, and thus ultra-long-range signal transmission was made possible. An ultrasensitive response to CTCs was obtained via this proposed sensing strategy, with a linear range from 10 cell mL−1 to 6 × 10⁶ cell mL−1 and a detection limit of 3 cell mL−1. Moreover, this electrochemical sensor possessed the capability to detect CTCs in serum samples with satisfactory accuracy, which indicated great potential for early diagnosis and clinical analysis of cancer.
Introduction
Circulating tumor cells (CTCs) are tumor cells that disseminate and survive at low concentrations in the peripheral blood during the development of malignant tumors, and are closely related to tumor metastasis and prognosis.1,2 There are many methods used for the detection of CTCs, such as liquid biopsy,3,4 fluorometry,5 photoelectrochemical biosensors,6,7 ratiometric detection,8 flow cytometry,9 mass spectrometry,10 and colorimetric analysis.11 Electrochemical biosensors based on enzymatic cascade reactions have exhibited great potential in clinical analysis and diagnosis of CTCs.12–14In a typical case, the first enzyme's catalytic product is directly used as the second enzyme's catalytic substrate in a one-pot reaction with high activity and stereoselectivity without intermediates, which can provide valuable detection information and understanding of enzymatic reactions in living systems. The enzymatic cascade amplification strategy has been widely applied to detect biomarkers.15–17 However, numerous studies have demonstrated that specific parameters have an impact on the effectiveness of enzymatic cascade catalysis. In particular, enzyme–enzyme distance limits enzymatic cascade catalysis, although all types of scaffolds, including metal–organic frameworks,18 metal nanoparticles,19 DNA tetrahedra,20 cellular surfaces,21 and proteins,22 have been used for enzyme loading,23 enzyme activating,24 and modulating enzyme spacing.25 For example, when the gap between two enzymes was maintained at a maximum of 6 nm, Wilner et al.26 found that the reaction rate increased 16 fold while a DNA scaffold was employed. Fu et al.27 obtained a 15-fold improvement when a glucose oxidase (GOD)–horseradish peroxidase (HRP) pair at 10 nm was co-assembled in a DNA scaffold. Hence, nanomaterial-based systems have been developed to address these issues due to their promising properties.28–30
Carbon nanotubes (CNTs), which are one-dimensional nanomaterials with a distinctive hexagonal shape, possess excellent electrical conductivity and can be used as electrode modifiers to accelerate electrode responses, reduce overpotential, and facilitate electron transfer events.31,32 However, the widespread use of CNTs has been constrained by their poor solubility in solvents and suboptimal dispersion.33,34 To achieve uniform dispersion of CNTs in solvents, chitosan (CS), a natural polymer rich in amino and hydroxyl groups, can be used to interact with the walls of CNTs based on their hydrophobic ends, while their hydrophilic ends would interact with water or other polar solvents.35,36 Due to their high surface area for loading and immobilizing enzymes as well as their high enzymatic unit activity, multiwalled carbon nanotubes–chitosan (MWCNTs–CS) composites may have potential applications in increasing the mass transit of substrates in enzymatic cascade catalysis.37–43
Herein, we developed an extremely effective enzymatic cascade reaction based on a MWCNTs–CS composite to construct an electrochemical biosensing system for detecting CTCs. In our strategy (Scheme 1), MWCNTs–CS composites were modified on the surface of a glassy carbon electrode (GCE) to obtain GCE/MWCNTs–CS. Then, GOD was loaded onto the surface of the GCE/MWCNTs–CS, and the aptamer for CTCs was modified on the GCE/MWCNTs–CS/GOD via amide bonds. In addition, anti-epithelial cell adhesion molecule (anti-EpCAM) and HRP were assembled on the surface of polystyrene (PS) to obtain anti-EpCAM/PS/HRP conjugates. The aptamer on the surface of GCE/MWCNTs–CS/GOD specifically recognizes CTCs, and then the prepared anti-EpCAM/PS/HRP was linked to the surface of CTCs by anti-EpCAM. Thus, an enzymatic cascade reaction was obtained.
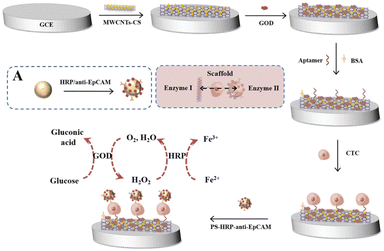 | ||
| Scheme 1 Schematic diagram of the carbon nanotubes–chitosan composite-driven highly efficient enzymatic cascade reaction for electrochemical biosensing detection of CTCs. | ||
Glucose in the electrolyte was initially oxidized by GOD to produce gluconic acid and H2O2, and then the H2O2 was further utilized by HRP to accelerate the oxidation of Fe2+ with amplified electrochemical responses. The produced H2O2 by GOD is crucial for the subsequent enzymatic cascade reaction so that the GCE/MWCNTs–CS/GOD provides a driving force for the enzymatic cascade reaction. This MWCNTs–CS composite-based electrochemical biosensing technique triggered a highly effective enzymatic cascade reaction for the detection of CTCs that exhibited a wide detection range, high sensitivity, and low detection limit.
Experimental
Materials
A glassy carbon electrode (GCE), chitosan (CS), glutaraldehyde (GA), glucose, and multiwalled carbon nanotubes (MWCNTs) were obtained from Aladdin Chemistry Co., Ltd. (Shanghai, China). Glucose oxidase (GOD, >180 U mg−1) was purchased from Shanghai Ruiyong Biological Technology Co., Ltd. (Shanghai, China). Bovine serum albumin (BSA), phosphate-buffered saline (PBS), potassium chloride, K3[Fe(CN)6], K4[Fe(CN)6]·3H2O, carboxylated polystyrene microspheres (PS–COOH), horseradish peroxidase (HRP, >300 U mg−1), and anti-epithelial cell adhesion molecule antibody (anti-EpCAM) were obtained from Abcam Co., Ltd. (Cambridge, MA, USA). Glacial acetic acid, N-(3-(dimethylamino)-propyl)-N′-ethyl carbodiimide hydrochloride (EDC), N-hydroxysulfosuccinimide (NHS), and oligonucleotides were received from Sangon Biotechnology Co. Ltd. (Shanghai, China).The aptamer sequence for MCF-7 cells: 5′-COOH–AAAAAACACTACAGAGGTTGCGTCTGTCCCACGTTG TCATGGGGGGTTGGCCTG-3′.
Apparatus
Scanning electron microscopy (SEM) images were obtained using a SUPRA 55 scanning electron microscope (Carl Zeiss, Germany). Transmission electron microscopy (TEM) images were obtained using an HT7700 transmission electron microscope (Hitachi, Tokyo, Japan). All the electrochemical measurements were carried out on a CHI 760E electrochemical workstation (Shanghai Chenhua Instrument Co., Ltd., China) with a three-electrode system composed of a GCE (3 mm in diameter) as the working electrode, a platinum electrode as the counter electrode, and a saturated Ag/AgCl electrode as the reference electrode. Electrochemical impedance spectroscopy (EIS), cyclic voltammetry (CV), and differential pulse voltammetry (DPV) were performed in 5 mM K3Fe(CN)6/K4Fe(CN)6 (0.1 M KCl) containing glucose (1 mM) as the supporting electrolyte.Preparation of GCE/MWCNT–CS/GOD
The GCE was polished with 0.3 and 0.05 μm Al2O3 powder, washed with alcohol and distilled water, and then dried at room temperature. Purified MWCNTs (2 mg) were subsequently dispersed into 200 μL CS solution (10 mg mL−1) and sonicated for 3 h, and a mixed solution of MWCNTs–CS composite was obtained. Then, the MWCNTs–CS mixture (10 μL) was dropped onto the electrode to form an MWCNT–CS film by physical adsorption at room temperature.The GOD solution (10 mg mL−1, 5 μL), BSA solution (2.5 μL), and GA solution (2.5%, v/v, 2.5 μL) were then added dropwise to the surface of the GCE in turn and air-dried at room temperature. The GOD was linked onto the surface of the MWCNTs–CS composite through electrostatic forces due to the positive charges of CS and the negative charges of GOD.
Preparation of anti-EpCAM/PS/HRP conjugates
PS–COOH (20 μL) was dispersed in 1000 μL PBS buffer solution, and then EDC (18 mg) and NHS (27 mg) were added. After sonication and subsequent incubation at 37 °C for 15 min, the carboxyl groups on the PS surface were fully activated. Then, anti-EpCAM (1 μg mL−1, 1 μL) and HRP (10 mg mL−1, 500 μL) were dispersed in the above PBS solution and gently stirred at 25 °C for 6 h. The PS–COOH was activated by EDC/NHS, and the HRP and anti-EpCAM were linked on the surface of PS–COOH by amide bonds. After being washed three times with 1 mL PBS solution and concentrated at 5000 rpm for 3 min, the unbound HRP and anti-EpCAM were eliminated. The obtained anti-EpCAM/PS/HRP mixture was stored at 4 °C for the next use.Preparation and electrochemical performance of the biosensor
The aptamer solution (10 μM, 5 μL) was activated by EDC/NHS (20 mg mL−1), dropped onto the surface of the GCE/MWCNTs–CS/GOD electrode, and then incubated for 20 h at room temperature. The aptamer was modified on the electrode by –COOH at the bottom of the aptamer and –NH2 of CS on the GCE/MWCNTs–CS/GOD. After 1% BSA was used to block non-specific sites, the GCE/MWCNTs–CS/GOD/aptamer/BSA capture electrode was obtained. Subsequently, human breast cancer cells (MCF-7, 10 μL) at different concentrations were dropped and incubated for 1 h at 37 °C to capture the cells. Then, the prepared anti-EpCAM/PS/HRP (8 μL) was dropped onto the capture electrode (GCE/MWCNTs–CS/GOD/aptamer/MCF-7 cells), and incubated for 1 h. Thus, a heterostructured scaffold for GOD and HRP in the electrochemical biosensing system was obtained. Due to a positive relationship between the DPV value and the MCF-7 cell concentration in a 5 mM K3Fe(CN)6/K4Fe(CN)6 solution (0.1 M KCl) containing glucose (1 mM) with a 50 mV pulse amplitude from −0.3 to 0.1 V, the electrochemical detection of MCF-7 cells was achieved.Preparation of CTCs and electrochemical detection of CTCs in whole blood samples
All experiments were performed in accordance with the guidelines of the “Ethics of Biomedical Research Involving Humans (National Health Commission of People's Republic of China).” The experiments were approved by the ethics committee of Yanshan University. Informed consent was obtained from all the human participants of this study. MCF-7 cells were digested by trypsin and resuspended in PBS buffer solution. The CTCs were quantified by hemocytometer. Then, whole blood samples were diluted ten times, and different concentrations of CTCs were dispersed into the whole blood samples for subsequent experimentation.The whole blood samples containing different concentrations of CTCs were dropped onto the surface of the GCE/MWCNTs–CS/GOD/aptamer/BSA capture electrode and incubated for 1 h at 37 °C to capture the cells. After that, the prepared anti-EpCAM/PS/HRP (8 μL) was dropped onto the capture electrode (GCE/MWCNTs–CS/GOD/aptamer/MCF-7 cells) and incubated for 1 h. The electrochemical detection of MCF-7 cells in whole blood samples was conducted in a 5 mM K3Fe(CN)6/K4Fe(CN)6 solution (0.1 M KCl) containing glucose (1 mM) with a 50 mV pulse amplitude from −0.3 to 0.1 V.
Results and discussion
Characterization of GCE/MWCNTs–CS/GOD
As shown in Fig. 1A, the MWCNTs are uniform tubular structures with diameters and lengths of approximately 10 nm and 10 μm, respectively. In the SEM image of the MWCNTs–CS composite (Fig. 1B), the MWCNTs were uniformly coated by CS. As shown in Fig. S1,† elemental mapping of the MWCNTs–CS composite was performed using energy-dispersive X-ray spectroscopy (EDX) to verify the uniform distribution of O and N, which also revealed the CS dispersed on the carbon nanotube surface. SEM of the further modification of GOD on the MWCNTs–CS electrode surface is shown in Fig. 1C, in which GOD is seen as dewdrops scattered on the branches of trees. UV-Vis absorption spectra are exhibited in Fig. 1D, and no absorption peak was observed for CS (curve a), MWCNTs (curve b), or the MWCNTs–CS composite (curve d). However, a 280 nm absorption peak appeared for MWCNT–CS/GOD (curve e), which corresponded to the typical protein absorption peak of GOD (curve c).44,45 These results indicated that GOD was successfully loaded onto the MWCNTs–CS composite.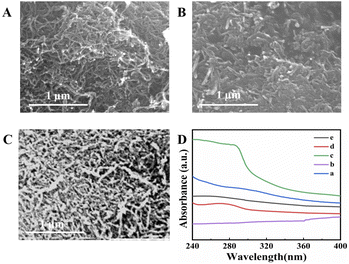 | ||
| Fig. 1 SEM images of (A) MWCNTs, (B) MWCNTs–CS composite, and (C) MWCNTs–CS/GOD. (D) UV-Vis spectra of (a) CS, (b) MWCNTs, (c) GOD, (d) MWCNTs–CS–GOD, and (e) MWCNTs–CS composite. | ||
The electrochemical effective surface area of the electrode would affect the GOD loading rate, which would further affect the catalytic efficiency of the enzymatic cascade reactions. A series of CV experiments was carried out for investigation of the electrochemical effective surface area of the GCE and GCE/MWCNTs–CS, as shown in Fig. 2. The electrochemical effective surface area of the electrode, unlike the physical surface area, was investigated by CV measurements using K3Fe(CN)6/K4Fe(CN)6 as a probe and the following Randles–Sevcik equation:46
| Ip = kn3/2cAD1/2ν1/2 |
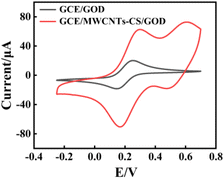 | ||
| Fig. 2 CV results for GCE/GOD and GCE/MWCNTs–CS/GOD in 0.1 M KCl solution containing 5 mM K3Fe(CN)6/K4Fe(CN)6 (scan rate of 100 mV s−1). | ||
Characterization of the anti-EpCAM/PS/HRP conjugates
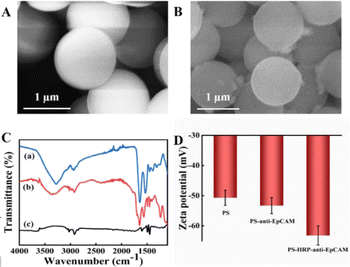
Carboxylated polystyrene microspheres (PS–COOH) with a large surface area were used as carriers for HRP and anti-EpCAM. HRP and anti-EpCAM were linked by the amino groups in anti-EpCAM and the carboxyl groups in PS. The SEM image of PS–COOH showed that they exhibited a smooth and uniform surface with a diameter of 1 μm (Fig. 3A). After being covered by HRP and anti-EpCAM, some particles and synapses appeared on the PS surface (Fig. 3B). The FT-IR spectra of PS and anti-EpCAM/PS/HRP are illustrated in Fig. 3C. The absorption peaks of HRP at 1600 cm−1 were attributed to amide groups, and the absorption peaks at 1500 cm−1 and 1300 cm−1 were assigned to the heme vibration and tertiary amide, respectively (Fig. 3C, curve b). The absorption peaks of anti-EpCAM/PS/HRP at 1654 cm−1 and 3367 cm−1 were attributed to the bending vibrations of –CONH and –NH, respectively (Fig. 3C, curve c).These results indicated that anti-EpCAM and HRP had connected on the surface of PS. The zeta potentials of PS–COOH, anti-EpCAM/PS, and anti-EpCAM/PS/HRP were investigated, as shown in Fig. 3D. The zeta potential of PS–COOH was −50.7 mV due to the negative charge of –COOH. In comparison, the zeta potentials of anti-EpCAM/PS and anti-EpCAM/PS/HRP were −52.5 mV and −63.3 mV, respectively, after being modified with negatively charged anti-EpCAM and HRP. These results indicated that anti-EpCAM and HRP were successfully loaded on PS–COOH.
Characterization of the ‘heterostructured’ scaffold for GOD and HRP
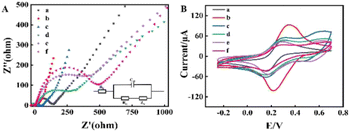
Electrochemical impedance spectroscopy (EIS) and CV were used to study the assembly progress of the heterostructured scaffold for GOD and HRP, as described in Fig. 4. The EIS consisted of two parts, a semicircular part and a linear part. The semicircular diameter of the EIS in the high-frequency region corresponded to the electron transport resistance (Ret), and the linear counterpart in the low-frequency region was related to the diffusion process. The bare GCE showed a small Ret (Fig. 4A, curve a) and an obvious current peak (Fig. 4B, curve a). The MWCNTs can promote electron transfer to the interface to a large extent due to their satisfactory conductivity, and therefore, when compared with the bare GCE, when the components of the MWCNTs–CS composite were modified on the GCE surface, a lower Ret was exhibited in the EIS of the GCE/MWCNTs–CS (Fig. 4A, curve b), and the CV peak current was significantly increased (Fig. 4B, curve b).However, electron transfer was hindered when GOD, as a poor conductor, was wrapped in the GCE/MWCNTs–CS electrode surface, resulting in an increase in the Ret (Fig. 4A, curve c) and a decrease in the peak current (Fig. 4B, curve c). Then, the immobilization of aptamer onto GCE/MWCNTs–CS/GOD via the terminal carboxyl group and the amino group of CS after activation by EDC and NHS resulted in an increase in the impedance value (Fig. 4A, curve d), indicating that electron transfer was further blocked in the modified electrode. Similarly, the peak current also decreased (Fig. 4B, curve d). Subsequently, when CTCs were captured on the surface of GCE/MWCNTs–CS/GOD/aptamer, the impedance of the system led to a continual increase (Fig. 4A, curve e), and the CV peak current decreased (Fig. 4B, curve e). The isolation between anti-EpCAM/PS/HRP conjugates and the electrode interface resulted in a significant increase in Ret (Fig. 4A, curve f) due to the effect of steric hindrance. Additionally, the CV peak current further decreased as expected (Fig. 4B, curve f), which also indicated that fabrication of the electrochemical biosensor for CTCs was feasible.
Detection performance of the electrochemical biosensor for CTCs
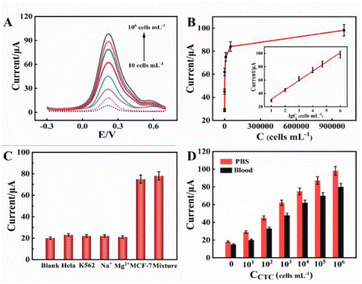
Glucose in the electrolyte was initially oxidized by GOD to produce gluconic acid and H2O2. Then, the H2O2 was further utilized by HRP to accelerate the oxidation of Fe2+ with amplified electrochemical responses. The mechanism was proved by the DPV responses of the biosensor in the absence and presence of glucose (1 mM) and K3Fe(CN)6/K4Fe(CN)6 (5 mM) in the PBS solution (Fig. S2†). The DPV response clearly increased in the presence of glucose (1 mM) in the PBS solution containing K3Fe(CN)6/K4Fe(CN)6 (5 mM). This occurred because GOD had catalyzed glucose in the electrolyte to produce gluconic acid and H2O2. Then, the H2O2 was further utilized by HRP to accelerate the oxidation of Fe2+ with amplified electrochemical responses. Moreover, compared to the absence of K3Fe(CN)6/K4Fe(CN)6, the DPV response clearly increased in the presence of K3Fe(CN)6/K4Fe(CN)6 (5 mM) in the PBS solution containing glucose (1 mM) (Fig. S3†). This further indicated that the enzymatic cascade reaction accelerated the oxidation of Fe2+, with amplified electrochemical responses. In addition, some experimental conditions were optimized to obtain the excellent performance of electrochemical biosensing detection, including the concentration of MWCNTs–CS composite, the enrichment time for DNA, the concentration of HRP, and the concentration of glucose (Fig. S4†).The change in the electrical signal resulting from the cascade reactions of GOD and HRP was proportional to the number of CTCs captured on the electrode. The DPV experiment was performed to verify the signal amplification strategy based on a dual enzymatic cascade reaction for the detection of CTCs. As shown in Fig. 5, compared with the GCE and GCE/MWCNTs–CS/GOD, the DPV peak currents in 5 mM K3Fe(CN)6/K4Fe(CN)6 (0.1 M KCl) containing glucose (1 mM) significantly increased with the increase in the CTC concentration with a 50 mV pulse amplitude from −0.3 to 0.1 V. The intensity of DPV was increased with the cell concentration (Fig. 5A), and the intensity of DPV was linear in the logarithm of cell concentration ranging from 10 cells mL−1 to 106 cells mL−1, as shown in Fig. 5B. The linear regression equation was y = 13.941![[thin space (1/6-em)]](https://www.rsc.org/images/entities/char_2009.gif) lg
lg![[thin space (1/6-em)]](https://www.rsc.org/images/entities/char_2009.gif) C cells (cells mL−1) + 17.438 with a correlation coefficient of 0.9927 (n = 3). The detection limit was calculated to 3 cells mL−1 for CTCs at 3σ.
C cells (cells mL−1) + 17.438 with a correlation coefficient of 0.9927 (n = 3). The detection limit was calculated to 3 cells mL−1 for CTCs at 3σ.
The reproducibility of the electrochemical biosensor was evaluated by measuring the electrochemical response at multiple cell concentrations. The relative standard deviations (RSDs) were 1.45%, 2.25%, 3.1%, 3.75%, 4.2%, and 4.91% at cell concentrations of 10 cells mL−1, 102 cells mL−1, 103 cells mL−1, 104 cells mL−1, 105 cells mL−1, and 106 cells mL−1, respectively (the detailed RSD values are listed in Table S1†), which indicated satisfactory repeatability.
To investigate the specificity of the designed electrochemical biosensor, a series of experiments was performed using various types of cells, including HeLa cells, K562 cells, MCF-7 cells, Na+, and Mg2+, as shown in Fig. 5C. Only MCF-7 cells elicited an obvious electrochemical response, which indicated that this electrochemical biosensor exhibited satisfactory selectivity for MCF-7 cells based on the strategy of a dual enzymatic cascade reaction.
Furthermore, we performed whole blood experiments to investigate the potential clinical application of this sensing system. As shown in Fig. 5D, the comparison graphs of PBS and 10-fold diluted whole blood samples indicate that this biosensor exhibited strong resistance to interference, and the relative standard deviations of whole blood samples were 1%, 1.65%, 2.4%, 3.1%, 3.5%, and 4% at cell concentrations of 10 cells mL−1, 102 cells mL−1, 103 cells mL−1, 104 cells mL−1, 105 cells mL−1, and 106 cells mL−1, respectively (the detailed RSD values are listed in Table S2†). Moreover, the regression analysis of DPV current versus the cell concentration in PBS and whole blood in Fig. S5† showed a linear relationship in the range of 10 cells mL−1 to 106 cells mL−1. The linear regression equation was y = 13.941![[thin space (1/6-em)]](https://www.rsc.org/images/entities/char_2009.gif) lg
lg![[thin space (1/6-em)]](https://www.rsc.org/images/entities/char_2009.gif) C cells (cells mL−1) + 17.438 with a correlation coefficient of 0.9927 and y = 5.2736
C cells (cells mL−1) + 17.438 with a correlation coefficient of 0.9927 and y = 5.2736![[thin space (1/6-em)]](https://www.rsc.org/images/entities/char_2009.gif) lg
lg![[thin space (1/6-em)]](https://www.rsc.org/images/entities/char_2009.gif) C cells (cells mL−1) + 9.6667 with a correlation coefficient (R2) of 0.9891. All the results indicated that the MWCNT–CS composite was able to drive the highly efficient enzymatic cascade reaction, and it holds promise for clinical applications of electrochemical biosensing detection of CTCs.
C cells (cells mL−1) + 9.6667 with a correlation coefficient (R2) of 0.9891. All the results indicated that the MWCNT–CS composite was able to drive the highly efficient enzymatic cascade reaction, and it holds promise for clinical applications of electrochemical biosensing detection of CTCs.
Conclusions
An MWCNTs–CS composite-driven highly efficient enzymatic cascade reaction for electrochemical biosensing detection of CTCs was developed. In this strategy, MWCNTs–CS composites were adopted to modify a GCE for loading GOD, which achieved a high electrochemical effective surface area of the electrode, high loading rate, and high electrical activity of the enzyme. As a ‘power source’, the MWCNTs–CS composites provided strong driving power for the subsequent enzymatic cascade reactions. Aptamer, CTCs, and PS microspheres with HRP and anti-EpCAM were assembled on MWCNTs–CS/GCE. GOD catalyzed the oxidation of glucose to produce gluconic acid and H2O2, while HRP catalyzed the decomposition of H2O2, allowing the reaction to proceed and further facilitating electron transfer. This resulted in a highly efficient enzymatic cascade reaction for electrochemical biosensing detection of CTCs that exhibited a wide linear concentration range (10 cells mL−1 to 106 cells mL−1) with high sensitivity, selectivity, reproducibility, and detection limit (3 cells mL−1 for CTCs at 3σ).Based on these advantages, great potential was indicated for the MWCNT–CS composite-driven highly efficient enzymatic cascade strategy for clinical electrochemical biosensing detection of CTCs. However, the stability of natural enzymes is easily affected by temperature, pH, and salt concentrations, which also affects the catalytic efficiency of the enzymatic cascade reaction in the electrochemical biosensors. Nanozymes have been discovered with high catalytic efficiency, selectivity, and stability, and they have been developed as potentially viable alternatives to natural enzymes. In our next study, we will use nanozymes to replace the natural enzymes in the enzymatic cascade reaction.
Author contributions
Min Dong: conceptualization, methodology, data curation, writing – original draft preparation. Zhihong Gao: visualization, investigation. Jian Li, Yating Zhang: supervision, investigation. Jiahui Cai: investigation. Hong Jiang, Panpan Xu: software, validation. Jidong Wang: supervision, funding acquisition, writing – review and editing.Conflicts of interest
There are no conflicts to declare.Acknowledgements
This work was supported by the National Natural Science Foundation of China (No. 62071413), the Hebei Natural Science Foundation (No. F2020203056, C2019203556), Hebei Education Department Key Project (No. ZD2020147), and Hebei Province Key Research and Development Project (213777111D).Notes and references
- F. Li, H. Xu and Y. Zhao, TrAC, Trends Anal. Chem., 2021, 145 Search PubMed
.
- N. Xia, D. Wu, H. Yu, W. Sun, X. Yi and L. Liu, Talanta, 2021, 221, 121640 CrossRef CAS PubMed
.
- C. J. Kim, L. Dong, S. R. Amend, Y. K. Cho and K. J. Pienta, Lab Chip, 2021, 21, 3263–3288 RSC
.
- L. Wu, Y. Wang, X. Xu, Y. Liu, B. Lin, M. Zhang, J. Zhang, S. Wan, C. Yang and W. Tan, Chem. Rev., 2021, 121, 12035–12105 CrossRef CAS PubMed
.
- L. Zhou, F. Ji, T. Zhang, F. Wang, Y. Li, Z. Yu, X. Jin and B. Ruan, Talanta, 2019, 197, 444–450 CrossRef CAS PubMed
.
- J. Luo, D. Liang, D. Zhao and M. Yang, Biosens. Bioelectron., 2020, 151, 111976 CrossRef CAS PubMed
.
- J. Luo, D. Liang, X. Li, L. Deng, Z. Wang and M. Yang, Mikrochim. Acta, 2020, 187, 257 CrossRef CAS PubMed
.
- P. Miao and Y. Tang, Anal. Chem., 2019, 91, 15187–15192 CrossRef CAS PubMed
.
- J. Lu, I. T. Paulsen and D. Jin, Anal. Chem., 2013, 85, 8240–8245 CrossRef CAS PubMed
.
- C. Donato, K. Buczak, A. Schmidt and N. Aceto, STAR Protoc., 2021, 2, 100480 CrossRef CAS PubMed
.
- N. Xia, D. Wu, H. Yu, W. Sun, X. Yi and L. Liu, Talanta, 2021, 221, 121640 CrossRef CAS PubMed
.
- M. C. Good, J. G. Zalatan and W. A. Lim, Science, 2011, 332, 680–686 CrossRef CAS PubMed
.
- C. J. Delebecque, A. B. Lindner, P. A. Silver and F. A. Aldaye, Science, 2011, 333, 470–474 CrossRef CAS PubMed
.
- N. A. Thornberry and Y. Lazebnik, Caspases: enemies within, Science, 1998, 281, 1312–1316 CrossRef CAS PubMed
.
- Y. C. Yan, Z. J. Qiao, X. Hai, W. L. Song and S. Bi, Biosens. Bioelectron., 2021, 174, 112827 CrossRef CAS PubMed
.
- B. J. Jeong, R. Akter, O. H. Han, C. K. Rhee and M. A. Rahman, Anal. Chem., 2013, 85, 1784–1791 CrossRef CAS PubMed
.
- K. Yan, P. Nandhakumr, A. Bhatia, N. S. Lee, Y. H. Yoon and H. Yang, Biosens. Bioelectron., 2021, 171, 112727 CrossRef CAS PubMed
.
- L. Wang, G. Liu, Y. Ren, Y. Feng, X. Zhao, Y. Zhu, M. Chen, F. Zhu, Q. Liu and X. Chen, Anal. Chem., 2020, 92, 14259–14266 CrossRef CAS PubMed
.
- H. Zhao, G. Liu, Y. Liu, X. Liu, H. Wang, H. Chen, J. Gao and Y. Jiang, ACS Appl. Mater. Interfaces, 2022, 14, 2881–2892 CrossRef CAS PubMed
.
- L. Zhao, Y. Huang, X. Qi, X. Yan, S. Wang and X. Liang, Anal. Chim. Acta, 2020, 1095, 172–178 CrossRef CAS PubMed
.
- G. A. Ellis, W. P. Klein, G. Lasarte-Aragonés, M. Thakur, S. A. Walper and I. L. Medintz, ACS Catal., 2019, 9, 10812–10869 CrossRef CAS
.
- L. F. Bugada, M. R. Smith and F. Wen, ACS Catal., 2018, 8, 7898–7906 CrossRef CAS
.
- Q. Wang, M. Chen, C. Xiong, X. Zhu, C. Chen, F. Zhou, Y. Dong, Y. Wang, J. Xu, Y. Li, J. Liu, H. Zhang, B. Ye, H. Zhou and Y. Wu, Biosens. Bioelectron., 2022, 196, 113695 CrossRef CAS PubMed
.
- J. N. Vranish, M. G. Ancona, E. Oh, K. Susumu, G. Lasarte Aragones, J. C. Breger, S. A. Walper and I. L. Medintz, ACS Nano, 2018, 12, 7911–7926 CrossRef CAS PubMed
.
- M. B. Quin, K. K. Wallin, G. Zhang and C. Schmidt-Dannert, Org. Biomol. Chem., 2017, 15, 4260–4271 RSC
.
- O. I. Wilner, Y. Weizmann, R. Gill, O. Lioubashevski, R. Freeman and I. Willner, Nat. Nanotechnol., 2009, 4, 249–254 CrossRef CAS PubMed
.
- J. Fu, M. Liu, Y. Liu, N. W. Woodbury and H. Yan, J. Am. Chem. Soc., 2012, 134, 5516–5519 CrossRef CAS PubMed
.
- M. Bilal, T. A. Nguyen and H. M. N. Iqbal, Coord. Chem. Rev., 2020, 422, 213475 CrossRef CAS
.
- J. B. Thakkar, S. Gupta and C. R. Prabha, Int. J. Biol. Macromol., 2019, 137, 895–903 CrossRef CAS PubMed
.
- S. Yin, Z. Jin and T. Miyake, Biosens. Bioelectron., 2019, 141, 111471 CrossRef CAS PubMed
.
- Q. Lv, F. Jing, Y. Huang, J. Xiao, Y. Zhang, F. Xiao, J. Xiao and S. Wang, ACS Sustainable Chem. Eng., 2018, 6, 6042–6051 CrossRef CAS
.
- Y. Wu, X. Zhao, Y. Shang, S. Chang, L. Dai and A. Cao, ACS Nano, 2021, 15, 7946–7974 CrossRef CAS PubMed
.
- V. C. Tung, J. H. Huang, I. Tevis, F. Kim, J. Kim, C. W. Chu, S. I. Stupp and J. Huang, J. Am. Chem. Soc., 2011, 133, 4940–4947 CrossRef CAS PubMed
.
- Y. Ji, Y. Y. Huang and E. M. Terentjev, Langmuir, 2011, 27, 13254–13260 CrossRef CAS PubMed
.
- O. V. Kharissova, C. M. Oliva González and B. I. Kharisov, Ind. Eng. Chem. Res., 2018, 57, 12624–12645 CrossRef CAS
.
- G. Bottari, G. de la Torre, D. M. Guldi and T. Torres, Chem. Rev., 2010, 110, 6768–6816 CrossRef CAS PubMed
.
- N. Hernandez-Ibanez, L. Garcia-Cruz, V. Montiel, C. W. Foster, C. E. Banks and J. Iniesta, Biosens. Bioelectron., 2016, 7, 1168–1174 CrossRef PubMed
.
- S. Ji, W. Liu, S. Su, C. Gan and C. Jia, Lwt, 2021, 149 Search PubMed
.
- Y. Zhou, H. Yang and H. Y. Chen, Talanta, 2008, 76, 419–423 CrossRef CAS PubMed
.
- Q. Zhou, Q. Xie, Y. Fu, Z. Su, X. Jia and S. Yao, J. Phys. Chem. B, 2007, 111, 11276–11284 CrossRef CAS PubMed
.
- B. K. Shrestha, R. Ahmad, H. M. Mousa, I. G. Kim, J. I. Kim, M. P. Neupane, C. H. Park and C. S. Kim, J. Colloid Interface Sci., 2016, 482, 39–47 CrossRef CAS PubMed
.
- Q. Zhou, Q. Xie, Y. Fu, Z. Su, X. e. Jia and S. Yao, J. Phys. Chem. B, 2007, 111, 11276–11284 CrossRef CAS PubMed
.
- M. Zhang, A. Smith and W. Gorski, Anal. Chem., 2004, 76, 5045–5050 CrossRef CAS PubMed
.
- G. Lai, J. Wu, C. Leng, H. Ju and F. Yan, Biosens. Bioelectron., 2011, 26, 3782–3787 CrossRef CAS PubMed
.
- H. Yao, N. Li, J. Z. Xu and J. J. Zhu, Chin. J. Chem., 2005, 23, 275–279 CrossRef CAS
.
- S. Upadhyay, G. R. Rao, M. K. Sharma, B. K. Bhattacharya, V. K. Rao and R. Vijayaraghavan, Biosens. Bioelectron., 2009, 25, 832–838 CrossRef CAS PubMed
.
Footnote |
| † Electronic supplementary information (ESI) available. See DOI: https://doi.org/10.1039/d3ra01160g |
| This journal is © The Royal Society of Chemistry 2023 |

