
 Open Access Article
 This Open Access Article is licensed under a Creative Commons Attribution-Non Commercial 3.0 Unported Licence
Development and optimization of natural deep eutectic solvent-based dispersive liquid–liquid microextraction coupled with UPLC-UV for simultaneous determination of parabens in personal care products: evaluation of the eco-friendliness level of the developed method
Abdulmalik M. Alqarni*a,
Ahmed Mostafa a,
Heba Shaabana,
Mohamed S. Gomaaa,
Danyah Albashrayib,
Batool Hasheeshib,
Nujud Bakhashwainb,
Atheer Aseerib,
Abdulaziz Alqarnic,
Abdulgani A. Alamrid and
Mohammad A. Alrofaidie
a,
Heba Shaabana,
Mohamed S. Gomaaa,
Danyah Albashrayib,
Batool Hasheeshib,
Nujud Bakhashwainb,
Atheer Aseerib,
Abdulaziz Alqarnic,
Abdulgani A. Alamrid and
Mohammad A. Alrofaidie
aDepartment of Pharmaceutical Chemistry, College of Clinical Pharmacy, Imam Abdulrahman Bin Faisal University, King Faisal Road, P.O. Box 1982, Dammam 31441, Saudi Arabia. E-mail: amalqarni@iau.edu.sa
bCollege of Clinical Pharmacy, Imam Abdulrahman Bin Faisal University, King Faisal Road, P.O. Box 1982, Dammam 31441, Saudi Arabia
cMedical Laboratory Department, National Guard Health Affairs, AlAhsa, Saudi Arabia
dArmed Forces Health Rehabilitation Center, Ministry of Defense for Health Services, Taif, Saudi Arabia
eDepartment of Pharmaceutical Chemistry, Faculty of Clinical Pharmacy, Al Baha University, King Faisal Road, P.O. Box 1988, Al-Baha, Saudi Arabia
First published on 28th April 2023
Abstract
Dispersive liquid–liquid microextraction (DLLME) combined with ultra-high performance liquid chromatography-diode array detector (UHPLC-DAD) method has been developed and validated for the determination of parabens in personal care products. In this study, a natural deep eutectic solvent (NADES) composed of menthol and formic acid at a molar ratio of 1![[thin space (1/6-em)]](https://www.rsc.org/images/entities/char_2009.gif) :2 was prepared and used as an extraction solvent. The influencing variables on the extraction efficiency such as extraction solvent type and volume, composition of NADES, salt addition, vortex and centrifugation time were investigated. The proposed method exhibited good linearity with determination coefficients of ≥0.9992. The relative recoveries for the studied analytes ranged from 82.19 to 102.45%. Limits of detection and limits of quantification were in the range of 0.17–0.33 ng mL−1 and 0.51–0.99 ng mL−1, respectively. To evaluate the applicability of the developed method, it was successfully applied to determine four parabens in personal care products. Additionally, the eco-friendliness level of the presented method was evaluated using Eco-Scale Assessment, Green Analytical Procedure Index and Analytical GREEnness metric. The developed method is simple, environmentally friendly and cost effective and it could be employed for determination of parabens in personal care products without harming the environment.
:2 was prepared and used as an extraction solvent. The influencing variables on the extraction efficiency such as extraction solvent type and volume, composition of NADES, salt addition, vortex and centrifugation time were investigated. The proposed method exhibited good linearity with determination coefficients of ≥0.9992. The relative recoveries for the studied analytes ranged from 82.19 to 102.45%. Limits of detection and limits of quantification were in the range of 0.17–0.33 ng mL−1 and 0.51–0.99 ng mL−1, respectively. To evaluate the applicability of the developed method, it was successfully applied to determine four parabens in personal care products. Additionally, the eco-friendliness level of the presented method was evaluated using Eco-Scale Assessment, Green Analytical Procedure Index and Analytical GREEnness metric. The developed method is simple, environmentally friendly and cost effective and it could be employed for determination of parabens in personal care products without harming the environment.
1. Introduction
Parabens, esters of p-hydroxybenzoic acid, are a family of organic compounds that are widely used as preservatives for pharmaceutical products, food and cosmetics. The most commonly used parabens are methyl paraben (MP), ethyl paraben (EP), propyl paraben (EP) and butyl paraben (EP). Because of their inexpensive cost, broad spectrum activity and chemical stability over a wide pH range, parabens are used singly or in a combination.1 Human are exposed to parabens on a daily basis from various sources and it is well documented in the literature that parabens may pose a potential risk to human health by being linked to carcinogenic and estrogenic threats.2,3 It has been found that there is an association between exposure to parabens and the incidence of health adverse effects such as hearing loss,4 inflammatory bowel disease,5 chronic diarrheal symptoms and allergen sensitization6 and endocrine disrupting effects.7 In light of this, the European Union set a maximum concentration of (0.4% w/w) for individual parabens and a limit of (0.8% w/w) for total parabens in commercial products.8A key step in the analytical processes is the selection of appropriate sample preparation technique because it reflects method accuracy and precision. Different sample preparation techniques have been introduced for the determination of parabens in different matrices including liquid–liquid extraction, dispersive liquid–liquid microextraction (DLLME), solid phase extraction and solid phase microextraction.9–12
DLLME is a sample preparation technique that is characterized by its speed, ease of use and high extraction efficiency. However, the main drawback of conventional DLLME is the use of toxic chlorinated solvents such as chloroform and carbon tetrachloride as an extractant solvents.13 Greening pharmaceutical analysis has attracted growing interest aiming at minimizing the negative environmental impact and enhancing analysts' health and safety. In this regards, more benign solvents such as ionic liquids, supercritical fluids and deep eutectic solvents (DESs) have been introduced as green alternatives in DLLME.13,14 Recently, DESs have attracted great interest in different fields as extraction solvents because their production is simpler, less toxic, more affordable and biodegradable.15–17 DESs are prepared by mixing hydrogen bond donor (HBD) and hydrogen bond acceptor (HBA) at proper molar ratios forming hydrogen bond interactions.14 DESs exhibit much lower melting point than those of either individual components.14
Several studies have been reported for the utilization of various DESs in combination with DLLME for determination of parabens in different matrices such as food,18–20 pharmaceutical samples,21 cosmetics22–25 and environmental waters.26 Most of DES-DLLME methods reported for determination of parabens in cosmetics utilized choline chloride e.g.22,24 or tetrabutylammonium chloride e.g.25 However natural deep eutectic solvents (NADES) containing natural monoterpenes such as menthol are considered proper solvents for extraction due to its low water solubility and low price,27,28 their use in determination of parabens in cosmetics is still limited. Hence, this study aimed to develop a fast, simple, cost-effective and environmentally friendly menthol-based DES-DLLME method, followed by UHPLC-DAD for simultaneous determination of parabens in cosmetic samples. Additionally, three different metrics including Analytical Eco-Scale (AES),29 Green Analytical Procedure Index (GAPI)30 and the Analytical GREEnness (AGREE) metric31 were used to assess the eco-friendliness profile of the developed method.
2. Material and methods
2.1. Chemicals, reagents and materials
Standards of four parabens including methylparaben (MP), ethylparaben (EP), propylparaben (PP) and butylparaben (BP) with purity of ≥98.0% were supplied by Sigma-Aldrich (Steinheim, Germany). Menthol, formic acid, acetic acid, octanoic acid, oleic acid, decanoic acid and dodecanoic acid were purchased from Sigma-Aldrich (Steinheim, Germany). Stock solutions of parabens were prepared in methanol at a concentration of 1000 mg L−1. Working standard solutions of different concentrations were prepared by dilution of the stock solutions in methanol and stored at −20 °C until use. Methanol, ethanol and acetonitrile were of HPLC grade and supplied from Merck (Darmstadt, Germany). Samples were filtered using 0.2 μm PolyTetraFluoroEthylene (PTFE) – Thomson SINGLE StEP eXtreme filter vials (Restek, USA). Ultrapure water (Milli-Q, ultrapure grade) was obtained by a water purification system (ELGA, High Wycombe, UK).2.2. Instrumentation
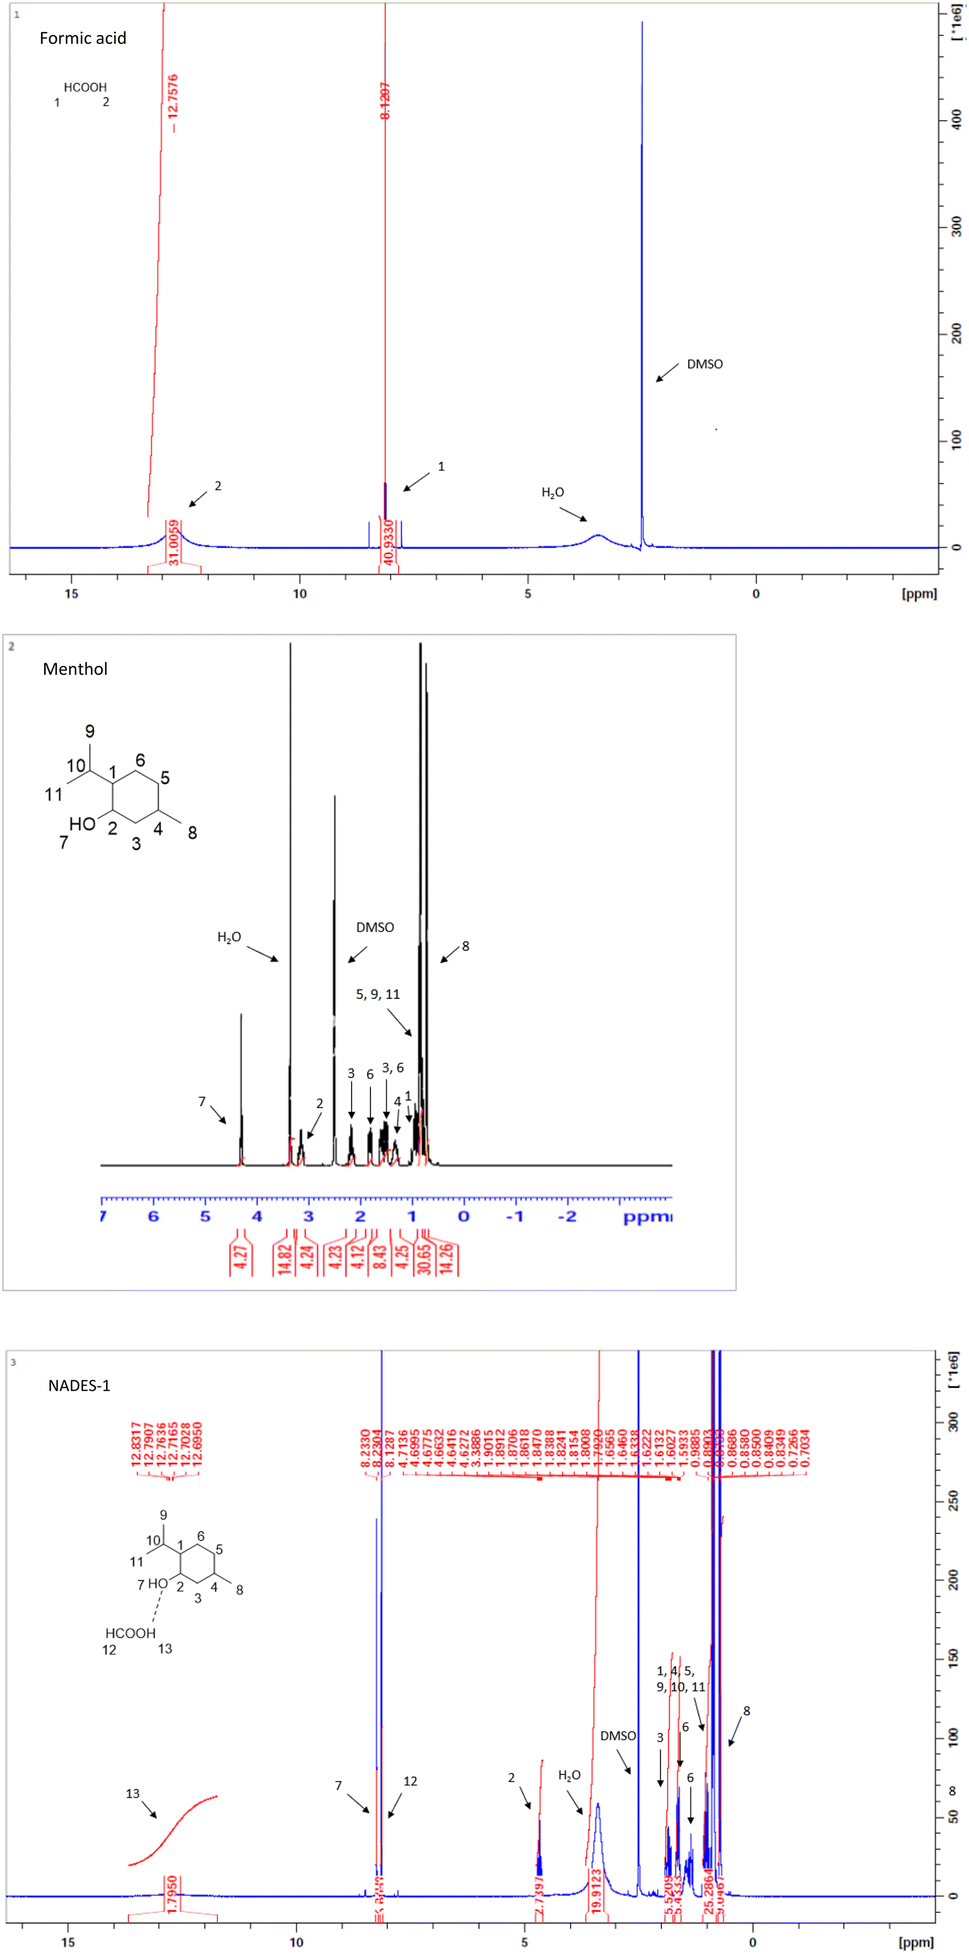
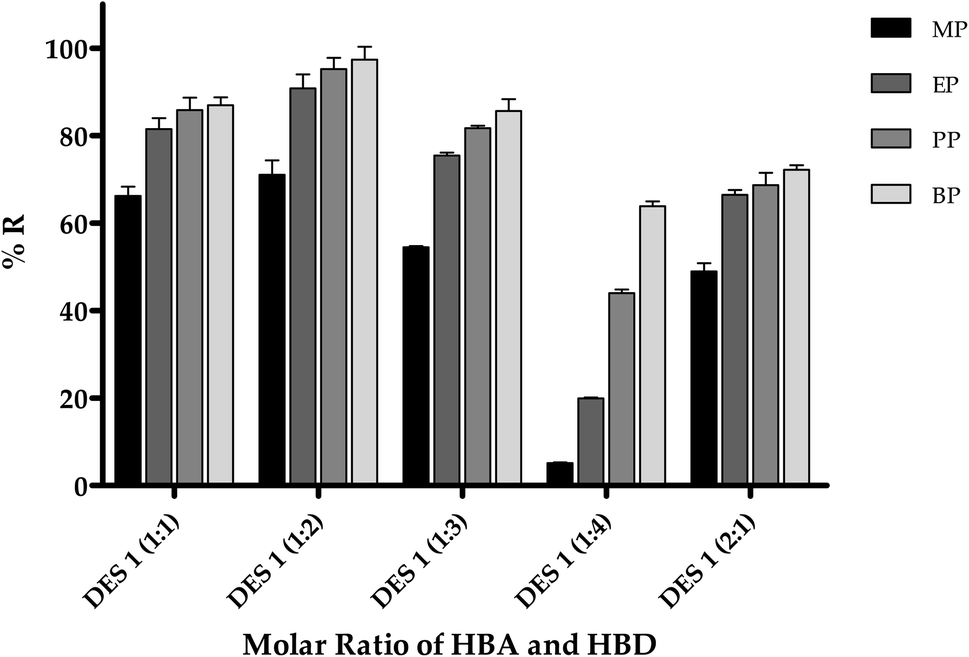
Chromatographic analysis of the investigated parabens was performed on UltiMate 3000 XRS UHPLC (Thermo Scientific Dionex, Germany) equipped with an autosampler, a dual gradient pump, a thermostated column compartment and a diode array detector (DAD). The analysis was performed on Acquity BEH C18 column (2.1 mm × 30 mm × 1.7 μm) with a VanGuard precolumn (Waters, USA). The injection volume was 5 μL and the column temperature was set at 40 °C. The flow rate was 0.6 mL min−1. The gradient elution was utilized with a mobile phase composed of ethanol (B) and water (A) as follows: 0–8 min (5 to 100%, B), 8–10 min (5%, B), followed by 0.5 min post time for equilibration of the column. The quantitative analysis of parabens were performed at the wavelength of 254 nm.For characterization of the prepared DES, the attenuated total reflection (ATR)-Fourier transform infrared (ATR-FTIR) spectra were recorded on Thermo Nicolet 50 spectrometer (USA) equipped with a DTGS detector and attenuated total reflectance (ATR) accessory. The spectra were measured from 4000 to 600 cm−1. For recording the Proton Nuclear Magnetic Resonance (1H NMR) spectra of the prepared DES, a 300 MHz Bruker Nuclear Magnetic Resonance (NMR) spectrometer (Bruker, Switzerland) was used. Dilution of samples were performed with deuterated dimethyl sulfoxide (d6-DMSO).
2.3. Sample collection and preparation
Fifteen cosmetic samples including shampoos (n = 4), hair conditions (n = 2) and creams (n = 7) antiperspirant (n = 2) were collected from local markets in the Eastern province, Saudi Arabia. Each sample was accurately weighed (0.5 g) and transferred into a 50 mL polypropylene centrifuge tube, then 2 mL of methanol was added. The mixture was vortexed for 2 min, sonicated for 5 min and subjected to centrifugation for 10 min at 3500 rpm. The supernatant aqueous phase was then collected and diluted up to 25 mL with water. The prepared samples were vortexed and filtered with 0.45 μm membrane filter before subjecting to the developed DLLME procedure.2.4. Preparation of deep eutectic solvents (DESs)
DESs were prepared by dissolving menthol as HBA and acids (formic acid, acetic acid, octanoic acid, oleic acid, decanoic acid and dodecanoic acid) as HBDs at proper molar ratio. The prepared DESs were stirred continuously for 15 min at 60 °C until clear transparent solutions formed. After cooling to room temperature, the DESs were stored in a desiccator until required for DLLME.2.5. Dispersive liquid–liquid microextraction (DLLME) procedures
Under optimum conditions, 5 mL of the sample solution was transferred into a 15 mL polypropylene centrifuge tube, then 300 mg of NaCl was added and vortexed till completely dissolved. Then, 80 μL of DES was added and vortexed for 3 min. The cloudy solution performed and centrifuged at 3500 rpm for 10 min. After removal of the lower aqueous phase, the remaining extraction phase was diluted with 120 μL methanol and then subjected to vortex and filtered using 0.2 μm of nano-filter vials before injected into the UHPLC-DAD system. Further dilution in ethanol was performed in case the paraben concentration detected in real samples exceeded the upper linearity range.Extraction recovery (ER%) and enrichment factor (EF) was used to evaluate the extraction efficiency using the following equations.
Here, VSample and VDES are the volumes of the initial sample solution and extracted DES, respectively.
3. Results and discussion
Different extraction parameters should be considered in order to optimize the DLLME method. These parameters include type and volume of the extraction solvent (DES), molar ratio of HBA/HBD, vortex time, sonication time, centrifugation time, salt addition, solution pH and addition of disperser solvents. All the experiments were performed in triplicate using 5 mL of spiked samples (2 mg L−1). Extraction recovery (%R) or enrichment factor (EF) were used to represent the extraction efficiency.3.1. Selection of the extraction solvent (DES)
An extraction solvent should have important properties such as being immiscible in water, having a high affinity for analytes, and being a liquid at room temperature.32 In this study, six hydrophobic DESs were investigated (Table 1) to choose the most appropriate natural DES. At molar ratio of (1:1), five DES mixtures with homogenous liquid retained upon cooling were selected for further extraction recovery comparison (DES 1–5). The highest extraction recovery of MP (%), EP (%) and PP (%) was achieved by DES-1 (menthol and formic acid), whereas DES-3 exhibited the highest recovery for BP (%) (Fig. 1). Other DESs (DES-2, DES-4, and DES-5) showed no significant improvement in extraction recovery for the analytes studied. As a result, the DES-1 was chosen for further extraction procedures.
| Abbreviation | HBA | HBDs | Ratio (HBA:HBD) |
Observation |
|---|---|---|---|---|
| DES-1 | Menthol | Formic acid | 11 |
Homogenous |
| DES-2 | Acetic acid | |||
| DES-3 | Octanoic acid | |||
| DES-4 | Oleic acid | |||
| DES-5 | Decanoic acid | |||
| DES-6 | Dodecanoic acid | Heterogenous |
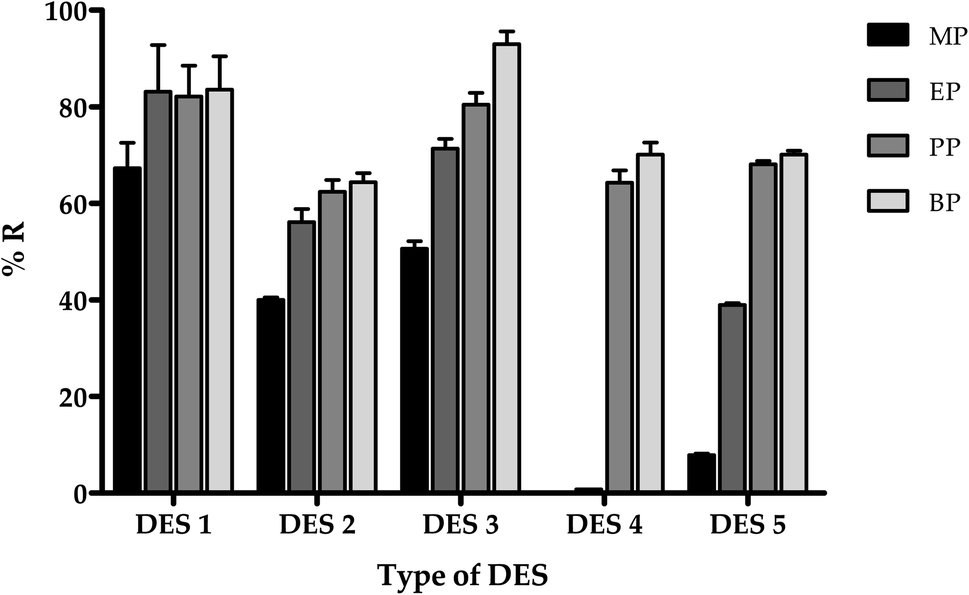 | ||
| Fig. 1 Effect of the type of DESs on the extraction recovery for the studied parabens. | ||
3.2. Characterization
The formation of DESs is driven by the intermolecular hydrogen bonding between menthol and formic acid. Hydrogen bond interactions in DES are widely explored using FTIR and H-NMR.33The FTIR spectra of DES-1, formic acid and menthol are shown in Fig. 2. The absorption peak at 1685 cm−1 in formic acid belongs to C![[double bond, length as m-dash]](https://www.rsc.org/images/entities/char_e001.gif) O and was shifted to 1716 cm−1 in DES-1 spectra. The presence of very broad band at 2945 cm−1 belongs to carboxylic –OH in formic acid. The characteristic peak of hydroxyl group in menthol at 3237 cm−1 was attributed for free hydroxyl group. The association of this –OH in hydrogen bonding with formic acid and the change in the vibration indicated the formation of DES-1.18,26
O and was shifted to 1716 cm−1 in DES-1 spectra. The presence of very broad band at 2945 cm−1 belongs to carboxylic –OH in formic acid. The characteristic peak of hydroxyl group in menthol at 3237 cm−1 was attributed for free hydroxyl group. The association of this –OH in hydrogen bonding with formic acid and the change in the vibration indicated the formation of DES-1.18,26
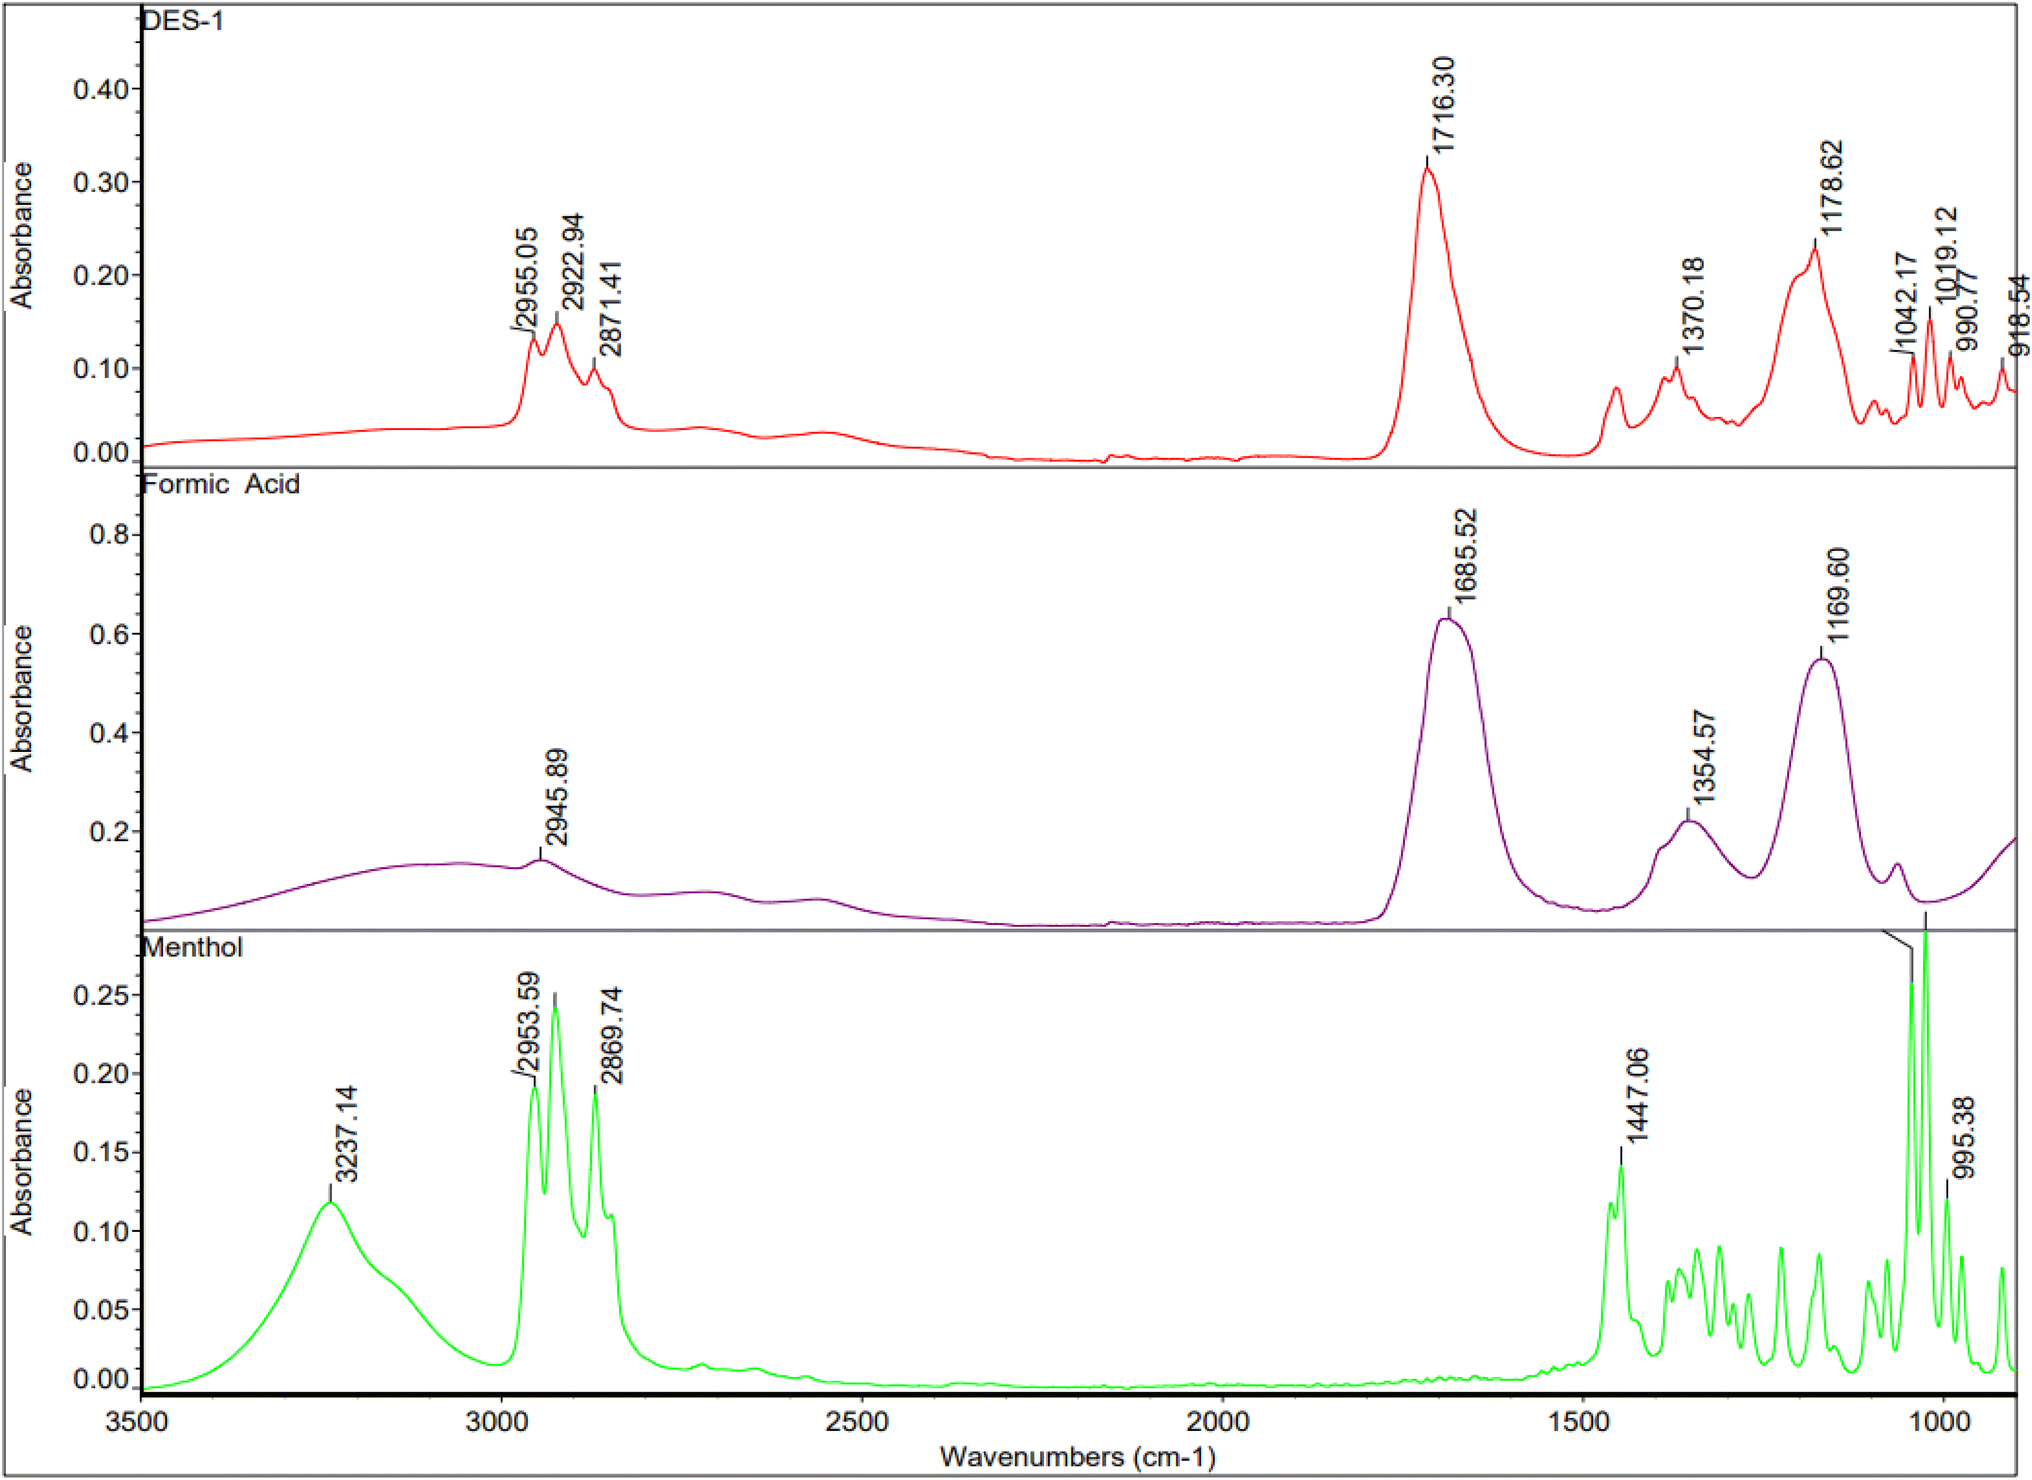 | ||
| Fig. 2 FTIR spectra of the prepared DES-1 and its individual components (menthol and formic acid). | ||
Menthol has secondary alcohol in an electron rich cyclohexane structure and is expected to be a good hydrogen bond acceptor and formic acid would act a strong hydrogen bond donor in the binary complex. 1H NMR was performed on the reference compounds alone and on their expected complex and the spectra were compared and interpreted. Fig. 3 displays the 1H NMR spectra of formic acid, menthol, and DES-1. As shown, broadness of the COOH peak of formic acid was noted in the complex spectrum which would suggest hydrogen bonding and change in the environment of the carboxylic acid proton. The alpha proton in menthol (CH–OH) appears downfield at 4.6 MHz in the complex spectrum instead of 3.1 MHz in the reference structure which is due to the hydrogen bonding of oxygen that makes it more electron withdrawing. Similarly the alcoholic proton is becoming more deshielded and is shifted to 8.2 MHz again due to the involvement of the alcohol oxygen in hydrogen bonding as hydrogen acceptor with formic acid.
 | ||
| Fig. 3 1H NMR spectra of the prepared DES-1 (3) and its individual components (1 and 2). | ||
3.3. Effect of molar ratio
Different molar ratios of the selected DES (menthol-formic acid) were investigated (Fig. 4). As shown in the figure, the extraction efficiency for all analytes showed a similar trend for all prepared DESs. For all target analytes, it was found that the ratio of 1:2 provides the highest extraction efficiency. Therefore, the ratio of 1:2 (menthol-formic acid) was chosen for further steps.
 | ||
| Fig. 4 Effect of the DES molar ratio on the extraction recovery of the studied parabens. | ||
3.4. Effect of DES volume and sample volume
After selecting the best DES and the optimal molar ratio, the effect of DES volume between 80 μL and 300 μL on the extraction recovery of analytes were assessed as shown in Fig. 5a. The optimum extraction recovery for all studied parabens was achieved by using 80 μL of DES-1. Thus, it was selected for subsequent experiments. Also, the effect of sample volume on extraction efficiency was evaluated. Different sample volumes between 2 mL to 15 mL were investigated as shown in Fig. 5b. The enrichment factors (EFs) for all analytes were found to be increased to their maximum at a volume of 5 mL and then decreased by increasing sample volume. This could be attributed to the reduction in extraction recovery with higher sample volumes. Therefore, 5 mL was used as an optimum sample volume.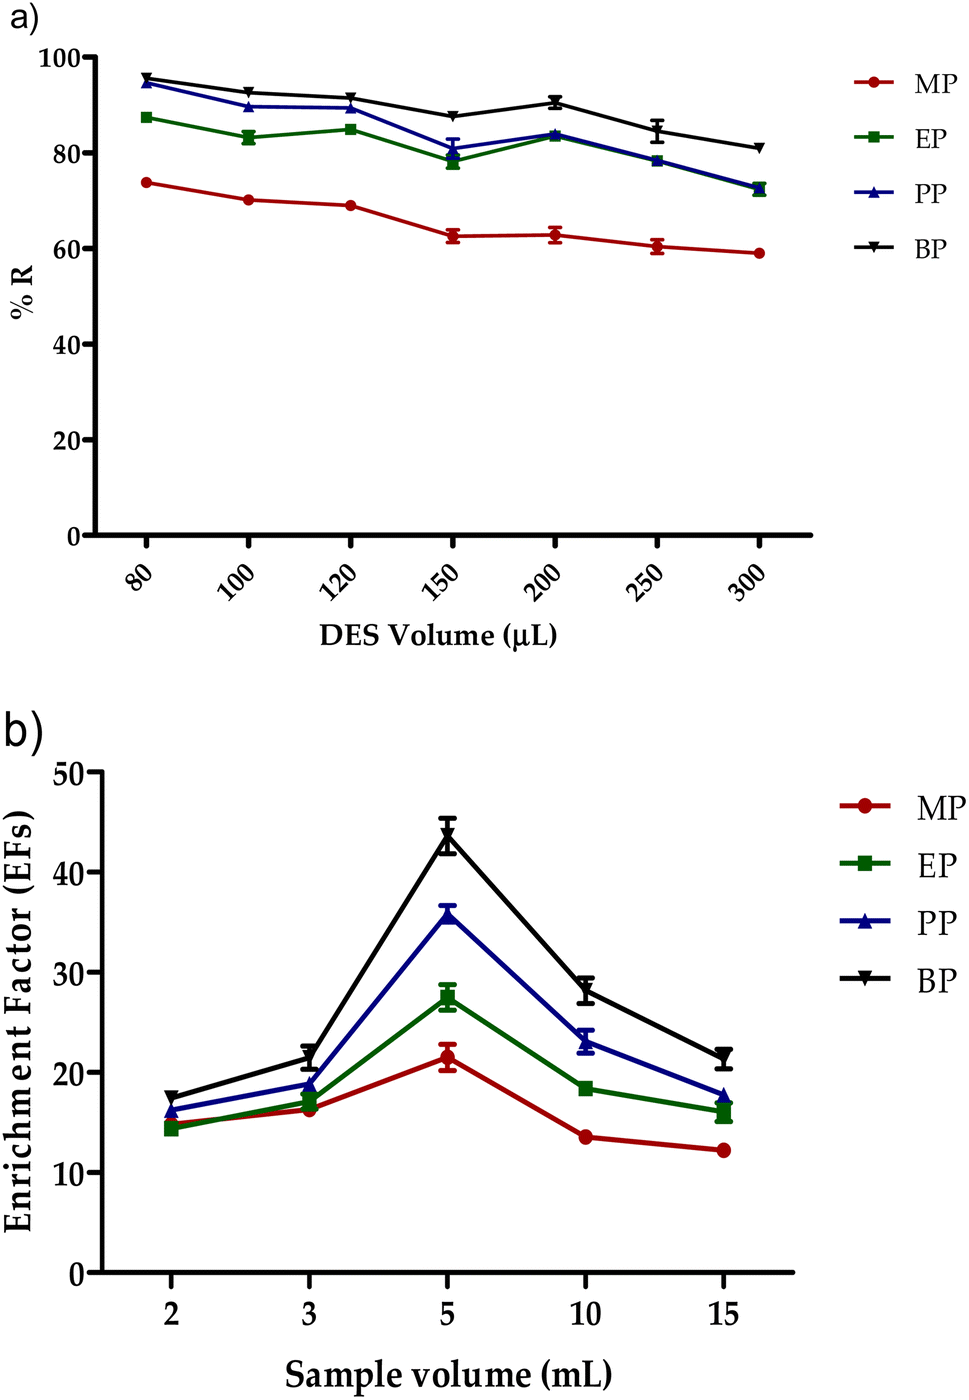 | ||
| Fig. 5 Effect of (a) DES volume and (b) sample volume on the extraction recovery of the studied parabens. | ||
3.5. Effect of pH
For the effect of pH on the extraction performance, previous studies reported that pH has a negligible effect on the extraction recovery of parabens,18,26 therefore the pH was not adjusted in this study.3.6. Effect of vortex, sonication and centrifugation time
The importance of the vortex agitation to increase partitioning of the targeted compounds from the extraction solvent into aqueous phase and enhancing the extraction performance has been reported in several DLLME studies.34–36 In this study, different vortex time from 0 to 300 s were investigated at fixed rotational speed (2800 rpm) (Fig. 6a). The results show that a significant increase in the extraction efficiency achieved at vortex time of 30 s was gradually decreased by increasing the vortex time from 60 to 120 s. The optimal vortex time was found to be at 180 s. Sonication has also been reported to increase the solvent extractability and improve the mass transfer between two phases, thus affecting the extraction efficiency.37 In this study, no significant improvement in extraction efficiency was observed by sonication (0 min–10 min) as shown in Fig. 6b. As a result, it was not used in any further experiments. | ||
| Fig. 6 Effect of (a) vortex time, (b) sonication time, (c) centrifugation time and (d) salt addition on the extraction recovery of the studied parabens. | ||
In DLLME, centrifugation could improve the two phase separation and shorten the sample preparation time. Therefore, different centrifugation times (5 to 30 min) were investigated as illustrated in Fig. 5c. The obtained results showed a significant improvement in the extraction efficiency at 10 min. By increasing the centrifugation time (>10 min), the extraction performance was kept constant. Therefore, 10 min was selected as the optimum centrifugation time.
3.7. Effect of salt addition
Salt addition has been reported to increase the ionic strength and decrease the analytes solubility in the aqueous phase, thus enhancing the extraction performance.38 To investigate the effect of the salt addition (NaCl) on the extraction efficiency of the targeted analytes, an amount of the salt between 0–10% (w/v) were used (Fig. 6d). A gradual increase in the extraction efficiency of four parabens were observed to reach a plateau over the concentration of 6–8% (w/v). Thereafter, the extraction efficiency decreased at 10% (w/v) which might be attributed to the change in the viscosity of the sample solution, hence decreasing the extraction efficiency. As a result, salt amount of 6% (w/v) was employed in this study.3.8. Effect of dispersive solvents
Dispersive solvents are commonly used in DLLME to accelerate mass transfer and improve extraction performance. In this study, different dispersive solvents including methanol, ethanol, acetonitrile and acetone were investigated. As illustrated in Fig. 7, no significant improvement in the extraction recovery of the targeted parabens was observed when dispersive solvents were used. Therefore, the experiments were performed without using any disperser solvents.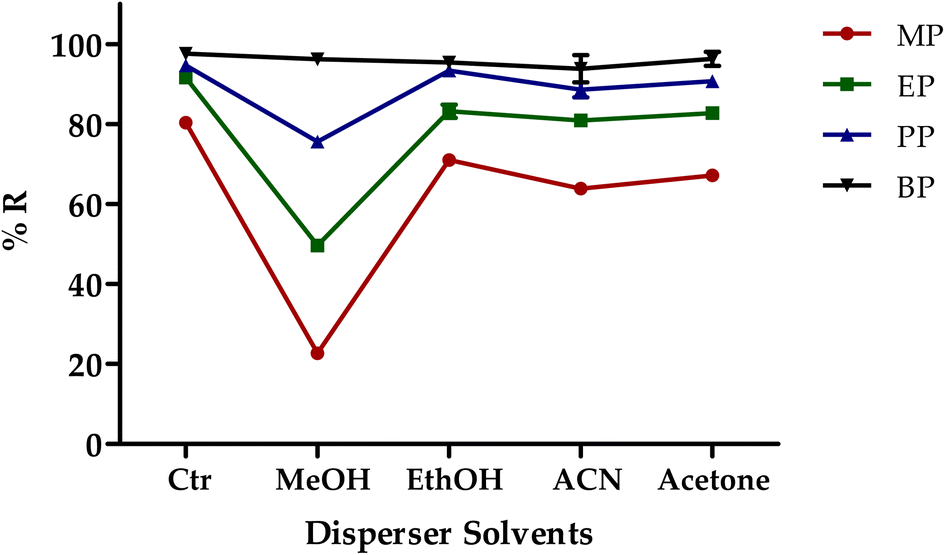 | ||
| Fig. 7 Effect of the dispersive solvents on the extraction recovery of the studied parabens. | ||
3.9. Optimization of the chromatographic separation
Taking into account the principles of green analytical chemistry, chromatographic separation was optimized to obtain the maximum separation efficiency, sensitivity and selectivity. In this regard, a short, narrow bore column packed with sub-2 μm particles was utilized to achieve rapid analysis while consuming less solvent and producing less waste. To adhere with the principles of green analytical chemistry, ethanol was used as a green biodegradable organic solvent in the mobile phase. Gradient mode was also employed to enhance resolution, peak shape, and to ensure complete elution of the hydrophobic DES. To achieve the best resolution in the shortest possible analysis time, various gradient systems were tried. Under the optimised condition, DES-1 and all studied analytes were completely eluted in 4.7 min (Fig. 8).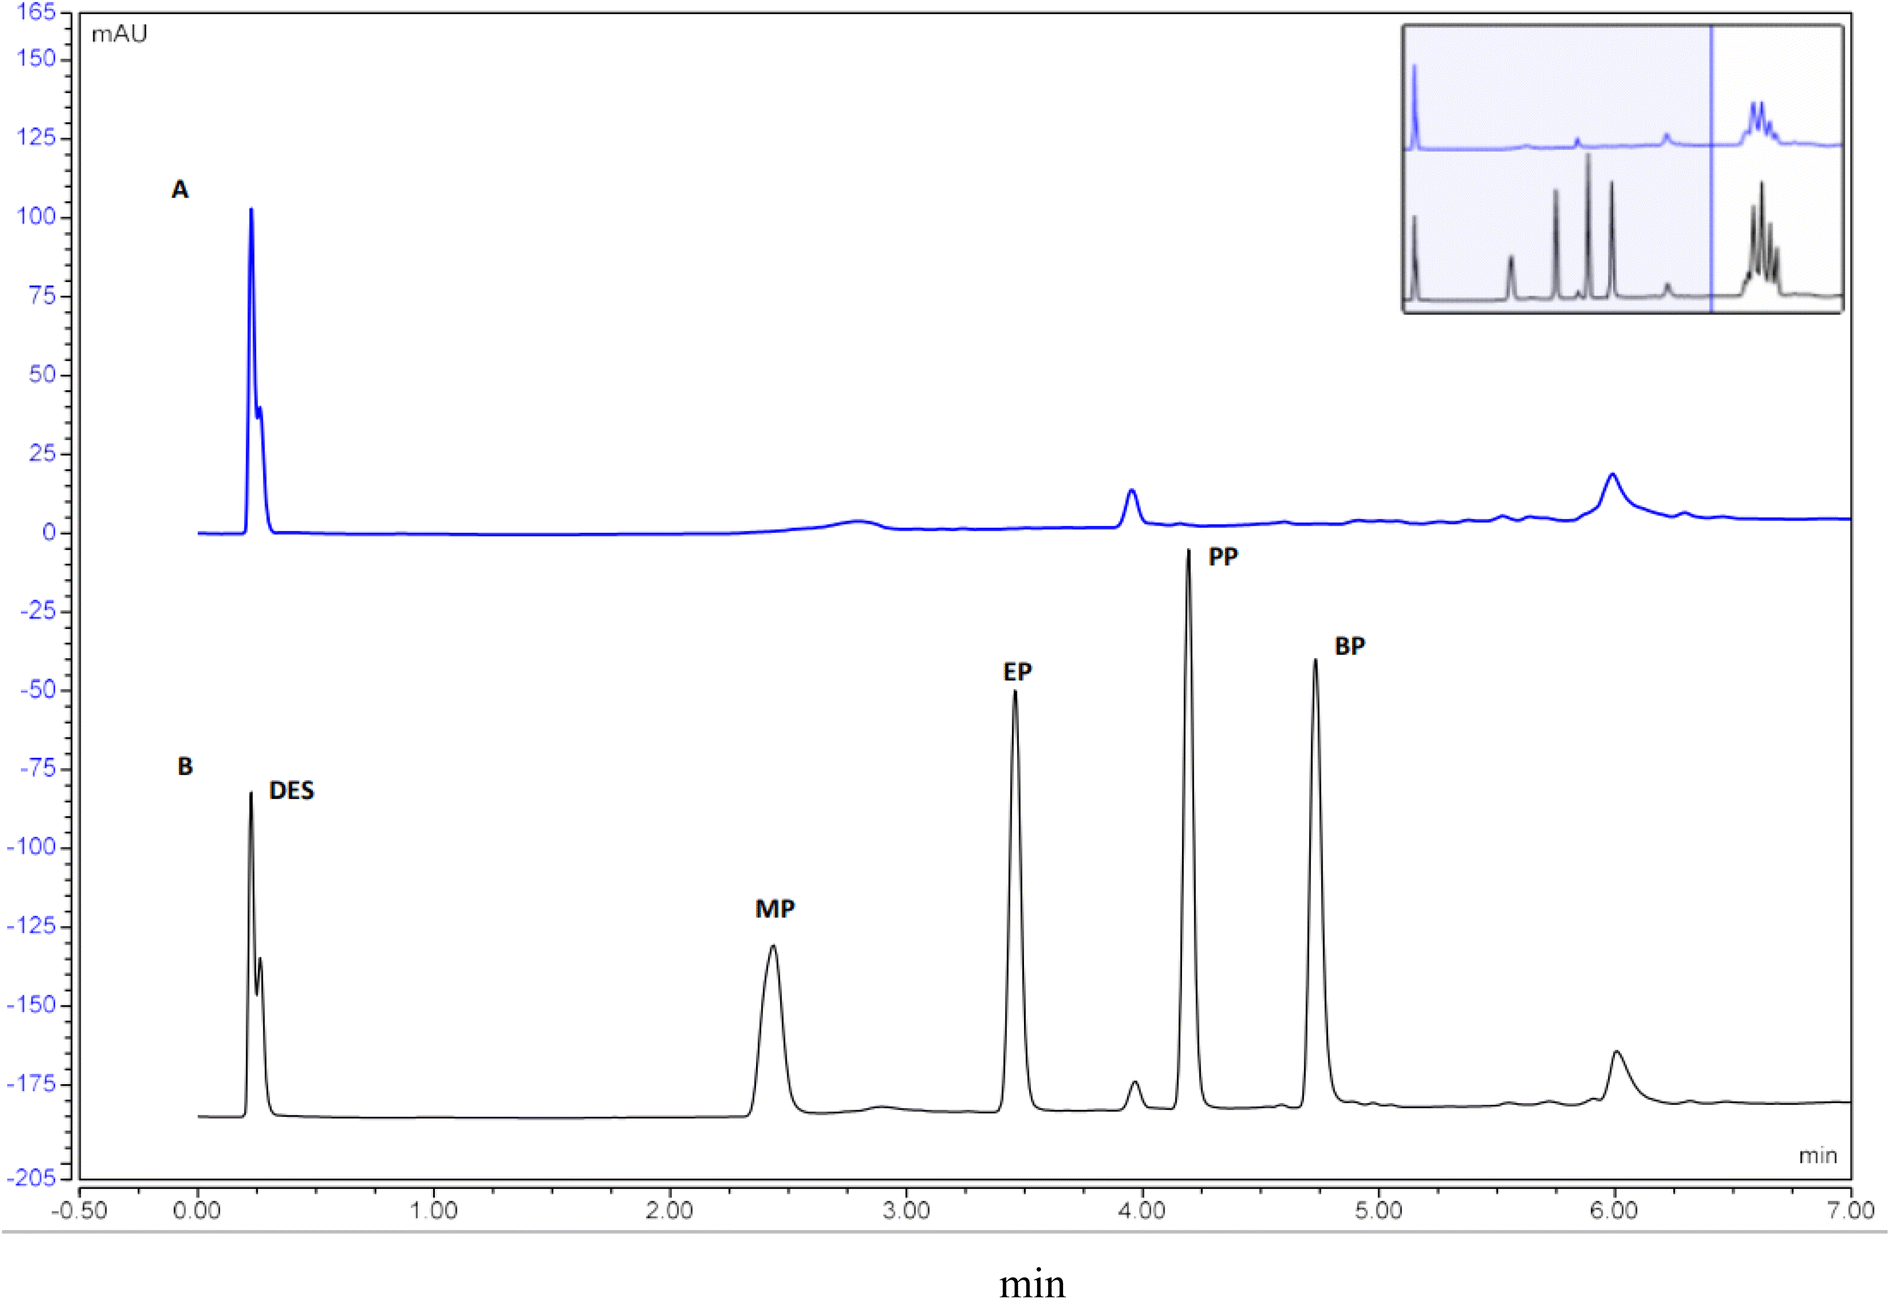 | ||
| Fig. 8 UHPLC-DAD chromatograms of (A) non-spiked sample extracted by DLLME and (B) a spiked sample extracted by DLLME. | ||
3.10. Analytical performance of the developed method
Different validation parameters were investigated to demonstrate the suitability of the developed method including linearity, specificity, limit of detection (LOD), limit of quantification (LOQ), intra-day and inter-day precision and accuracy.The UHPLC-DAD chromatograms of the spiked and un-spiked samples (Fig. 8) showed that the investigated parabens are entirely separated from other interfering components and revealed the absence of matrix interferences, reflecting a good specificity of the developed DLLME method. Calibration curves were evaluated by using the peak areas of spiked samples at five different concentration levels of MP, EP, PP and BP (n = 3). The calibration curves exhibit a good linearity over the range of 20–4000 ng mL−1 with satisfactory correlation coefficients (r2 ≥ 0.9992). The LODs, based on signal-to-noise ratio of 3 were in the range of 0.17 to 0.33 ng mL−1. The LOQs, based on signal-to-noise ratio of 10 were in the range of 0.51 to 0.99 ng mL−1.
Precision was evaluated at three concentration levels for each analyte (40 ng mL−1, 2000 ng mL−1 and 4000 ng mL−1). The enrichment factors (EFs) for all studied analytes were in the range of 52 to 62 (Table 2). The intra-day and inter-day precisions of the developed method were tested by performing three replicates of the spiked samples within a day and on three consecutive days, respectively. The relative recoveries were in the range of 82.19–102.45%. The RSDs were ≤0.43% and 3.33% for intra-day and inter-day precision, respectively which indicated good precision of the developed method. The analytical performance of the developed DES-based DLLME method is presented in Table 2.
| Analyte | Added (ng mL−1) | Linearity equation | r2 | LOD (ng mL−1) | LOQ (ng mL−1) | ER | Intra-day | Inter-day | ||
|---|---|---|---|---|---|---|---|---|---|---|
| R% | RSD% | R% | RSD% | |||||||
| MP | 40 | y = 0.0099x + 0.3693 | 0.9997 | 0.17 | 0.51 | 52 | 83.12 | 2.60 | 82.19 | 1.83 |
| 2000 | 82.57 | 0.63 | 82.35 | 1.00 | ||||||
| 4000 | 82.97 | 1.04 | 84.75 | 3.33 | ||||||
| EP | 40 | y = 0.0149x + 0.2104 | 0.9993 | 0.20 | 0.60 | 58 | 91.07 | 0.95 | 92.95 | 0.43 |
| 2000 | 92.55 | 1.13 | 91.42 | 2.23 | ||||||
| 4000 | 93.06 | 1.35 | 91.61 | 1.73 | ||||||
| PP | 40 | y = 0.0173x − 0.092 | 0.9992 | 0.22 | 0.65 | 60 | 95.73 | 1.83 | 96.84 | 1.87 |
| 2000 | 96.63 | 1.85 | 94.67 | 2.07 | ||||||
| 4000 | 95.14 | 0.57 | 95.13 | 1.30 | ||||||
| BP | 40 | y = 0.0172x + 0.1379 | 0.9993 | 0.33 | 0.99 | 62 | 102.45 | 2.19 | 99.62 | 0.93 |
| 2000 | 98.93 | 1.62 | 99.47 | 2.14 | ||||||
| 4000 | 99.11 | 0.43 | 101.13 | 1.55 | ||||||
3.11. Application to real samples
Under the optimized extraction conditions, the developed DES-based DLLME method was employed to determine the target parabens in 15 different personal care products from the local market. Parabens were found in 40% of the analyzed samples (Table 3). MP was the most frequently detected paraben with concentrations ranged from 18.3 to 702.2 mg kg−1. EP and PP were found in two samples (221.9 and 622.5 mg kg−1) and four samples (0.84 to 341.6 mg kg−1), respectively. BP was found in only one sample at a concentration of 0.17 mg kg−1. These findings are in an agreement with other previous studies reported for determination of parabens in personal care products e.g.12| Analyte | MP | EP | PP | BP | ||||
|---|---|---|---|---|---|---|---|---|
| Sample | Found (mg kg−1) | RSD | Found (mg kg−1) | RSD | Found (mg kg−1) | RSD | Found (mg kg−1) | RSD |
| a n.d.: not detected. | ||||||||
| S1 | n.d. | n.d. | n.d. | n.d. | n.d. | n.d. | n.d. | n.d. |
| S2 | 702.2 | 5.32 | 622.5 | 3.62 | n.d. | n.d. | 0.17 | 2.69 |
| S3 | n.d. | n.d. | n.d. | n.d. | n.d. | n.d. | n.d. | n.d. |
| S4 | n.d. | n.d. | n.d. | n.d. | n.d. | n.d. | n.d. | n.d. |
| S5 | 494.4 | 0.06 | n.d. | n.d. | 341.6 | 0.18 | n.d. | n.d. |
| S6 | 319.7 | 0.39 | 221.9 | 0.80 | n.d. | n.d. | n.d. | n.d. |
| S7 | n.d. | n.d. | n.d. | n.d. | n.d. | n.d. | n.d. | n.d. |
| S8 | n.d. | n.d. | <LOQ | n.d. | n.d. | n.d. | n.d. | n.d. |
| S9 | n.d. | n.d. | <LOQ | n.d. | n.d. | n.d. | n.d. | n.d. |
| S10 | n.d. | n.d. | <LOQ | n.d. | n.d. | n.d. | n.d. | n.d. |
| S11 | n.d. | n.d. | <LOQ | n.d. | <LOQ | n.d. | n.d. | n.d. |
| S12 | n.d. | n.d. | <LOQ | n.d. | 0.85 | 4.37 | n.d. | n.d. |
| S13 | 18.3 | 3.90 | n.d. | n.d. | 0.84 | 4.62 | n.d. | n.d. |
| S14 | 173.1 | 6.12 | n.d. | n.d. | 86.5 | 4.89 | n.d. | n.d. |
| S15 | n.d. | n.d. | n.d. | n.d. | n.d. | n.d. | n.d. | n.d. |
3.12. Comparison with other previous methods
A comparison with other reported DES-DLLME methods for determination of parabens was performed to assess the performance of the developed method. As illustrated in Table 4, the analytical performance of the proposed method is comparable with the reported methods in terms of linearity, accuracy and limits of detection. The main advantage of the developed method is the rapidity and simplicity. As presented in Table 4, the run times for all reported methods ranged from 10–35 min, compared to the 4.8 min achieved in this study. The proposed method is also notable for its minimal waste production and low solvent consumption. Additionally, the presented method utilized monoterpenes (e.g. menthol) for sample extraction which are low in water solubility, toxicity, and cost. Moreover, the proposed method was successfully applied for determination of parabens in cosmetic products from different types including hair care, skin care and body care products. In conclusion, the developed method outperforms other reported methods with comparable analytical performance in terms of speed and cost.| Analytes | Matrix | Separation technique | DES type and molar ration | Run time | r2 | Linearity range | LOD | R% | Ref. |
|---|---|---|---|---|---|---|---|---|---|
| MP, EP, PP, BP | Cosmetic oil | HPLC-UV | Choline chloride–ethylene glycol (1:2) |
35 min | 0.9992–0.9995 | 0.1–100 μg mL−1 | 0.049–0.061 μg mL−1 | >84% | 22 |
| MP, EP, PP, BP | Edible oil | HPLC-UV | Tetrabutylammonium chloride–water (1:5) |
10 min | >0.9986 | 1.5–500 μg L−1 | 0.2–0.4 μg L−1 | 85.1–106.8% | 20 |
| MP, EP, PP, BP | Liquid pharmaceutical samples | HPLC-UV | Choline chloride–glucose | — | 0.9934–0.9962 | 0.1–5000 ng mL−1 | 0.04–0.15 ng mL−1 | 80.95–103.12% | 21 |
| MP only | Cosmetic products | UV-vis spectrophotometry | Proline, malic acid and water (1:2:3) |
— | 0.9978 | 15–650 μg L−1 | 4.5 μg L−1 | 88.30% | 23 |
| MP, EP, PP, BP | Fruit juice samples, cosmetic and two pharmaceutical products | HPLC-UV | Menthol and polyethylene glycol (1:1) |
14 min | 0.9995–0.9999 | 1–1000 ng mL−1 | 0.3–2 ng mL−1 | 66.3–97.5% | 18 |
| MP, EP, PP, BP, benzoic acid, sorbic acid | Beverages | HPLC-UV | Tetrabutylammonium bromide and acetic acid (1:2) |
18 min | >0.9998 | 0.05–50.0 mg L−1 | 0.02 to 0.05 mg L−1 | 78.41–100.92% | 19 |
| MP, EP, PP, BP | Tap, river, lake and wastewater | HPLC-UV | Menthol and decanoic acid (2:1) |
15 min | 0.9961–0.9989 | 3–1000 ng mL−1 | 0.6–0.8 ng mL−1 | 69.1–78.5% | 26 |
| MP, EP, PP, BP | Cosmetic baby oil | HPLC-UV | Choline chloride-ethylene glycol (1:2) |
— | 0.9992–0.9995 | 0.1–100 μg mL−1 | 0.049–0.061 μg mL−1 | 82.02–101.95% | 24 |
| MP, EP, PP, BP | Toothpaste | HPLC-UV | Tetrabutylammonium chloride–ethanol (1:5) |
11 min | ≥0.9995 | 0.05–10 μg g−1 | 0.01–0.02 μg g−1 | 79.4–108.6% | 25 |
| MP, EP, PP, BP | Personal care products | HPLC-UV | Menthol–formic acid (1:2) |
4.8 min | 0.9992–0.9997 | 20–4000 ng mL−1 | 0.17 to 0.33 ng mL−1 | 82.19–102.45% | This work |
3.13. Assessment of the eco-friendliness level of the developed method
To assess the eco-friendliness level of the developed method and evaluate its effects on the environment, safety and human health, three assessment tools were utilized. These tools included Analytical Eco-Scale (AES),29 Green Analytical Procedure Index (GAPI)30 and Analytical GREEnness metric.31The AES allocates penalty points (PPs) to many parameters such as reagents (amounts and hazards), energy consumption, occupational hazard and waste generated that lower the method's greenness. These PPs are then subtracted from 100 and the remaining points are used to classify the method's level of greenness as excellent (>75), acceptable (>50) or insufficiently green (50).29 In the presented work, the total number of AES calculated penalty points was 17 and when these points were deducted from 100, the resulting points were 83 which indicated that the developed method is excellent green (>75) (Table 5). Combining two or more assessment tools play an important role in providing a clear image about the degree of eco-friendliness level of the developed method.39 Therefore, the Green Analytical Procedure Index (GAPI) was employed. The results of GAPI index are displayed as pentagrams in three different colors ranging from green to yellow to red, corresponding to method greenness levels of high, medium, and low, respectively.30 As shown in Table 5, the developed method's GAPI pictograms have seven green parts and only three red parts, indicating that the developed method has a low impact on the environment and can be applied to both qualitative and quantitative determination without endangering human health.
| Eco-scale | GAPI pictogram | AGREE pictogram | |
|---|---|---|---|
| Reagents | PPs | 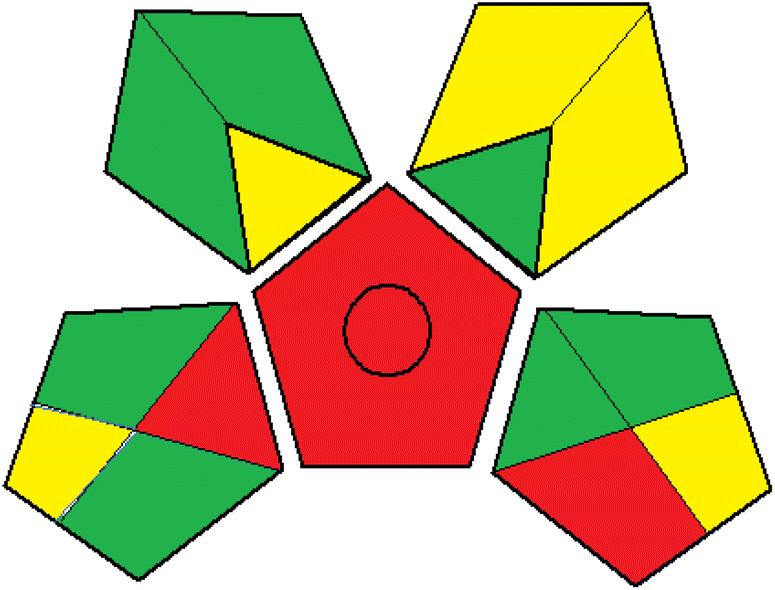 |
 |
| Ethanol | 4 | ||
| Formic acid | 6 | ||
| Menthol | 4 | ||
| NaCl | 0 | ||
| Instruments | |||
| UHPLC-DAD | 0 | ||
| Occupational hazard | 0 | ||
| Waste | 3 | ||
| Total PPs | 17 | ||
| Eco-scale | 83 |
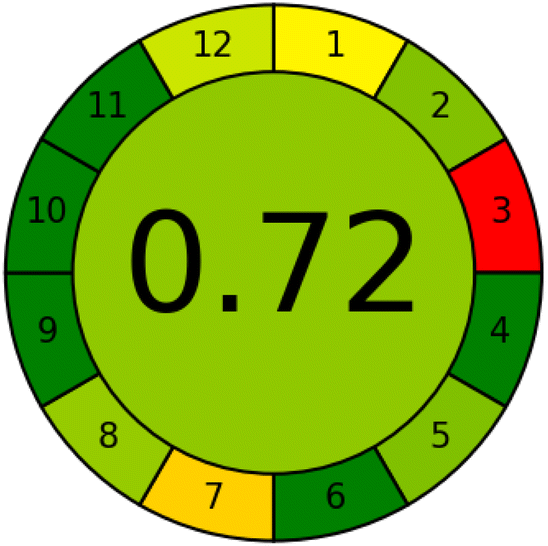
The AGREE metric was also employed to provide a thorough review of the proposed method's level of eco-friendliness utilizing a numerical scale from 0 to 1. Values close to one indicate high level of greenness.31 The proposed method's computed AGREE score of 0.72 demonstrated its high level of eco-friendliness.
4. Conclusion
In this study, a green analytical method for the simultaneous determination of four parabens in personal care products utilizing menthol-based DES-DLLME was developed and optimized. The presented method demonstrated good linearity (r2 ≥ 0.9992) and satisfactory recoveries (82.19–102.45%) with RSD ≤ 3.33%. The suggested method is environmentally friendly, quick, sensitive, and cost-effective. The method presented here could be successfully applied for simultaneous determination of parabens in personal care products without endangering human health or the environment.Author contributions
Abdulmalik M. Alqarni: conceptualization, validation, formal analysis, writing – original draft & editing, investigation, project administration, visualization, supervision. Ahmed Mostafa: validation, formal analysis, resources, writing – review & editing. Heba Shaaban: validation, Formal analysis, writing – review & editing, funding acquisition. Mohamed S. Gomaa: review & editing. Danyah Albashrayi: formal analysis. Batool Hasheeshi: formal analysis. Nujud Bakhashwain: formal analysis: Atheer Aseeri: formal analysis. Abdulaziz Alqarni: formal analysis. Abdulgani A. Alamri: visualization, formal analysis. Mohammad A. Alrofaidi: visualization, formal analysis.Conflicts of interest
The authors declare that they have no known competing financial interests or personal relationships that could have appeared to influence the work reported in this paper.Acknowledgements
This study was funded by the Deanship of Scientific Research, Imam Abdulrahman Bin Faisal University, Saudi Arabia (Grant No. 2016-218-Pharm).References
- J. A. Ocaña-González, M. Villar-Navarro, M. Ramos-Payán, R. Fernández-Torres and M. A. Bello-López, New developments in the extraction and determination of parabens in cosmetics and environmental samples. A review, Anal. Chim. Acta, 2015, 858, 1–15, DOI:10.1016/j.aca.2014.07.002.
- P. D. Darbre and P. W. Harvey, Parabens can enable hallmarks and characteristics of cancer in human breast epithelial cells: a review of the literature with reference to new exposure data and regulatory status, J. Appl. Toxicol., 2014, 34, 925–938, DOI:10.1002/jat.3027.
- A. K. Charles and P. D. Darbre, Combinations of parabens at concentrations measured in human breast tissue can increase proliferation of MCF-7 human breast cancer cells, J. Appl. Toxicol., 2013, 33, 390–398, DOI:10.1002/jat.2850.
- M. C. Li, Urinary phenols and parabens in relation to hearing loss: The National Health and Nutrition Examination Survey, J. Environ. Health Sci. Eng., 2022, 20, 331–335, DOI:10.1007/s40201-021-00779-7.
- P. S. de Silva, X. Yang, J. R. Korzenik, R. H. Goldman, K. L. Arheart and A. J. Caban-Martinez, Association of urinary phenolic compounds, inflammatory bowel disease and chronic diarrheal symptoms: Evidence from the National Health and Nutrition Examination Survey, Environ. Pollut., 2017, 229, 621–626, DOI:10.1016/j.envpol.2017.06.023.
- A. J. Spanier, T. Fausnight, T. F. Camacho and J. M. Braun, The associations of triclosan and paraben exposure with allergen sensitization and wheeze in children, Allergy Asthma Proc., 2014, 35, 475, DOI:10.2500/aap.2014.35.3803.
- J. Vitku, L. Kolatorova, L. Franekova, J. Blahos, M. Simkova, M. Duskova, T. Skodova and L. Starka, Endocrine disruptors of the bisphenol and paraben families and bone metabolism, Physiol. Res., 2018, 67, S455–S464, DOI:10.33549/physiolres.934005.
- DIRECTIVE, B.C., 2003 of 27 July 1976 on the approximation of the laws of the Member States relating to cosmetic products, https://www.legislation.gov.uk/eudr/1976/768/contents. Last accessed 2/4/2003 Search PubMed.
- Y. Bian, Y. Wang, J. Yu, S. Zheng, F. Qin and L. Zhao, Analysis of six preservatives in beverages using hydrophilic deep eutectic solvent as disperser in dispersive liquid–liquid microextraction based on the solidification of floating organic droplet, J. Pharm. Biomed. Anal., 2021, 195, 113889, DOI:10.1016/j.jpba.2021.113889.
- R. R. Pasupuleti, P. C. Tsai and V. K. Ponnusamy, Low-cost disposable Poly (ethyleneimine)-Functionalized Carbon Nanofibers Coated Cellulose Paper as efficient solid phase extraction sorbent material for the extraction of parahydroxybenzoates from environmental waters, Chemosphere, 2021, 267, 129274, DOI:10.1016/j.chemosphere.2020.129274.
- Z. B. Khesina, S. D. Iartsev, A. I. Revelsky and A. K. Buryak, Microextraction by packed sorbent optimized by statistical design of experiment as an approach to increase the sensitivity and selectivity of HPLC-UV determination of parabens in cosmetics, J. Pharm. Biomed. Anal., 2021, 195, 113843, DOI:10.1016/j.jpba.2020.113843.
- H. Shaaban, A. Mostafa, W. Alhajri, L. Almubarak and K. AlKhalifah, Development and validation of an eco-friendly SPE-HPLC-MS method for simultaneous determination of selected parabens and bisphenol A in personal care products: evaluation of the greenness profile of the developed method, J. Liq. Chromatogr. Relat. Technol., 2018, 41, 621–628, DOI:10.1080/10826076.2018.1499527.
- L. B. Santos, R. S. Assis, J. A. Barreto, M. A. Bezerra, C. G. Novaes and V. A. Lemos, Deep eutectic solvents in liquid-phase microextraction: Contribution to green chemistry, Trends Anal. Chem., 2022, 146, 116478, DOI:10.1016/j.trac.2021.116478.
- P. Makoś, E. Słupek and J. Gębicki, Hydrophobic deep eutectic solvents in microextraction techniques–a review, Microchem. J., 2020, 152, 104384, DOI:10.1016/j.microc.2019.104384.
- J. Iqbal, N. S. Shah, M. Sayed, N. Muhammad, J. A. Khan, Z. U. H. Khan, F. M. Howari, Y. Nazzal, C. Xavier, S. Arshad and A. Hussein, Deep eutectic solvent-mediated synthesis of ceria nanoparticles with the enhanced yield for photocatalytic degradation of flumequine under UV-C, J. Water Process Eng., 2020, 33, 101012, DOI:10.1016/j.jwpe.2019.101012.
- S. Chakraborty, J. H. Chormale and A. K. Bansal, Deep eutectic systems: An overview of fundamental aspects, current understanding and drug delivery applications, Int. J. Pharm., 2021, 610, 121203, DOI:10.1016/j.ijpharm.2021.121203.
- H. Vanda, Y. Dai, E. G. Wilson, R. Verpoorte and Y. H. Choi, Green solvents from ionic liquids and deep eutectic solvents to natural deep eutectic solvents, C. R. Chim., 2018, 21, 628–638, DOI:10.1016/j.crci.2018.04.002.
- D. Ge, Y. Gao, Y. Cao, E. Dai and L. Yuan, Preparation of a new polymeric deep eutectic solvent and its application in vortex-assisted liquid-liquid microextraction of parabens in foods, cosmetics and pharmaceutical products, J. Braz. Chem. Soc., 2020, 31, 2120–2128, DOI:10.21577/0103-5053.20200113.
- L. Qiao, Y. Tao, H. Qin and R. Niu, Multi-magnetic center ionic liquids for dispersive liquid-liquid microextraction coupled with in situ decomposition based back-extraction for the enrichment of parabens in beverage samples, J. Chromatogr. A, 2023, 1689, 463771, DOI:10.1016/j.chroma.2022.463771.
- J. Cao, C. Wang, L. Shi, Y. Cheng, H. Hu, B. Zeng and F. Zhao, Water based-deep eutectic solvent for ultrasound-assisted liquid–liquid microextraction of parabens in edible oil, Food Chem., 2022, 383, 132586, DOI:10.1016/j.foodchem.2022.132586.
- N. Razavi, F. Foroutan, S. Sahebian and J. Vahdati Khaki, Extraction and pre-concentration of parabens in liquid pharmaceutical samples by dispersive liquid–liquid microextraction based on deep eutectic solvents, Biomed. Chromatogr., 2023, 37, 5547, DOI:10.1002/bmc.5547.
- S. Sivrikaya, A novel vortex-assisted liquid phase microextraction method for parabens in cosmetic oil products using deep eutectic solvent, Int. J. Environ. Anal. Chem., 2019, 99, 1575–1585, DOI:10.1080/03067319.2019.1625345.
- A. Ö. Altunay and A. Elik, A novel sonication assisted dispersive liquid-liquid microextraction method for methylparaben in cosmetic samples using deep eutectic solvent, Sustainable Chem. Pharm., 2022, 29, 100781, DOI:10.1016/j.scp.2022.100781.
- S. SİVRİKAYA, A Vortex-Assisted Microextraction Based On Deep Eutectic Solvents for Determination of Four Parabens from Cosmetic Baby Oils and Optimization by Box-Behnken Design, Duzce Univ. Saglik. Bilim. Enst. Dergsi, 2020, 8, 1936–1947, DOI:10.29130/dubited.721252.
- J. Cao, L. Shi, Y. He, Y. Liu and F. Zhao, Effective extraction of parabens from toothpaste by vortex-assisted liquid-phase microextraction based on low viscosity deep eutectic solvent, Microchem. J., 2022, 179, 107590, DOI:10.1016/j.microc.2022.107590.
- D. Ge, Y. Wang, Q. Jiang and E. Dai, A deep eutectic solvent as an extraction solvent to separate and preconcentrate parabens in water samples using in situ liquid-liquid microextraction, J. Braz. Chem. Soc., 2019, 30, 1203–1210, DOI:10.21577/0103-5053.20190014.
- T. Křížek, M. Bursová, R. Horsley, M. Kuchař, P. Tůma, R. Čabala and T. Hložek, Menthol-based hydrophobic deep eutectic solvents: towards greener and efficient extraction of phytocannabinoids, J. Cleaner Prod., 2018, 193, 391–396, DOI:10.1016/j.jclepro.2018.05.080.
- M. A. Martins, E. A. Crespo, P. V. Pontes, L. P. Silva, M. Bülow, G. J. Maximo, E. A. Batista, C. Held, S. P. Pinho and J. A. Coutinho, Tunable hydrophobic eutectic solvents based on terpenes and monocarboxylic acids, ACS Sustainable Chem. Eng., 2018, 6, 8836–8846, DOI:10.1021/acssuschemeng.8b01203.
- A. Gałuszka, Z. M. Migaszewski, P. Konieczka and J. Namieśnik, Analytical eco-scale for assessing the greenness of analytical procedures, Trends Anal. Chem., 2012, 37, 61–72, DOI:10.1016/j.trac.2012.03.013.
- J. Płotka-Wasylka, A new tool for the evaluation of the analytical procedure: Green Analytical Procedure Index, Talanta, 2018, 181, 204–209, DOI:10.1016/j.talanta.2018.01.013.
- F. Pena-Pereira, W. Wojnowski and M. Tobiszewski, AGREE—Analytical GREEnness metric approach and software, Anal. Chem., 2020, 92, 10076–10082, DOI:10.1021/acs.analchem.0c01887.
- W. Deng, L. Yu, X. Li, J. Chen, X. Wang, Z. Deng and Y. Xiao, Hexafluoroisopropanol-based hydrophobic deep eutectic solvents for dispersive liquid–liquid microextraction of pyrethroids in tea beverages and fruit juices, Food Chem., 2019, 274, 891–899, DOI:10.1016/j.foodchem.2018.09.048.
- R. Xin, S. Qi, C. Zeng, F. I. Khan, B. Yang and Y. Wang, A functional natural deep eutectic solvent based on trehalose: structural and physicochemical properties, Food Chem., 2017, 217, 560–567, DOI:10.1016/j.foodchem.2016.09.012.
- A. Mostafa and H. Shaaban, Development and validation of a dispersive liquid–liquid microextraction method for the determination of phthalate esters in perfumes using gas chromatography-mass spectrometry, RSC Adv., 2018, 8, 26897–26905, 10.1039/C8RA03488E.
- H. Shaaban, A. Mostafa, A. M. Alqarni, R. Alsultan, Z. Aljarrash, W. Al-Zawad, S. Al-Kahlah and M. Amir, Dispersive liquid-liquid microextraction utilizing menthol-based deep eutectic solvent for simultaneous determination of sulfonamides residues in powdered milk-based infant formulas, J. Food Compos. Anal., 2023, 117, 105137, DOI:10.1016/j.jfca.2023.105137.
- A. Mostafa, H. Shaaban, A. M. Alqarni, M. Alghamdi, S. Alsultan, J. S. Al-Saeed, S. Alsaba, A. AlMoslem, Y. Alshehry and R. Ahmad, Vortex-assisted dispersive liquid–liquid microextraction using thymol based natural deep eutectic solvent for trace analysis of sulfonamides in water samples: assessment of the greenness profile using AGREE metric, GAPI and analytical eco-scale, Microchem. J., 2022, 183, 107976, DOI:10.1016/j.microc.2022.107976.
- S. Şahin, A. G. Pekel and İ. Toprakçı, Sonication-assisted extraction of Hibiscus sabdariffa for the polyphenols recovery: application of a specially designed deep eutectic solvent, Biomass Convers. Biorefin., 2022, 12, 4959–4969, DOI:10.1007/s13399-020-00837-4.
- R. Akramipour, N. Fattahi, M. Pirsaheb and S. Gheini, Combination of counter current salting-out homogenous liquid–liquid extraction and dispersive liquid–liquid microextraction as a novel microextraction of drugs in urine samples, J. Chromatogr. B, 2016, 1012, 162–168, DOI:10.1016/j.jchromb.2016.01.031.
- H. Shaaban, The ecological impact of liquid chromatographic methods reported for bioanalysis of COVID-19 drug, hydroxychloroquine: Insights on greenness assessment, Microchem. J., 2023, 184, 108145, DOI:10.1016/j.microc.2022.108145.
| This journal is © The Royal Society of Chemistry 2023 |