 Open Access Article
Creative Commons Attribution 3.0 Unported Licence
Conductive polythiophene/graphitic-carbon nitride nanocomposite for the detection of ethanol mixing in petrol
Ahmad Husain *a,
Sharique Ahmad*b,
Sara A. Alqarni
 c,
Samar J. Almehmadid,
Mudasir A. Yatooe,
Faiza Habibf,
Mohd Urooj Shariqg and
Mujahid Ali khanb
aDepartment of Mechanical Engineering, Indian Institute of Technology Ropar, Punjab 140001, India. E-mail: ahmadhusain2065@gmail.com; shariqueahmad14@gmail.com
bApplied Science and Humanities Section, University Polytechnic, Faculty of Engineering and Technology, Aligarh Muslim University, Aligarh, 202002, India
cDepartment of Chemistry, College of Science, University of Jeddah, Jeddah, Saudi Arabia
dDepartment of Chemistry, Faculty of Applied Science, Umm-Al-Qura University, Makkah-24230, Saudi Arabia
eDepartment of Materials, Faculty of Engineering, Imperial College London, SW7 2AZ, UK
fDepartment of Chemistry, University College London, WC1H 0AJ, UK
gDepartment of Chemistry, Faculty of Science, Aligarh Muslim University, Aligarh, 202002, India
First published on 18th April 2023
Abstract
The automobile vehicles must be operated on fuel containing no more than 10% ethanol. Use of fuel having more than 10% ethanol may cause engine malfunction, starting and running issues, and material degradation. These negative impacts could cause irreversible damage to the vehicles. Therefore, ethanol mixing in petrol should be controlled below 10% level. The current work is the first to report sensing of ethanol mixing in petrol with reference to the variation in the DC electrical conductivity of polythiophene/graphitic-carbon nitride (PTh/gC3N4) nanocomposite. The in situ chemical oxidative method of polymerization was used for synthesizing PTh and PTh/gC3N4 nanocomposite. Fourier transform infrared spectroscopy (FT-IR), X-rays diffraction (XRD), thermo-gravimetric analysis (TGA), transmittance electron microscopy (TEM) as well as scanning electron microscopy (SEM) analysis were used for confirmation of the structure along with morphology of the PTh and PTh/gC3N4 nanocomposite. The thermal stability of DC electrical conductivity of PTh and PTh/gC3N4 nanocomposite were tested under isothermal and cyclic ageing condition. The sensing response of PTh and PTh/gC3N4 nanocomposite as a function of DC electrical conductivity were recorded in petrol and ethanol atmosphere. The sensing response of PTh/g-C3N4 nanocomposite in petrol atmosphere was 6.1 times higher than that of PTh with lower detection limit to 0.005 v/v% of ethanol prepared in n-hexane.
1. Introduction
Ethanol, as a fuel produced mostly from plants like sugarcane and maize, is a desirable alternative to gasoline for reducing reliance on fossil fuels and lowering CO2 net emissions into the environment. Furthermore, ethanol has a greater octane rating than gasoline,1 indicating that ethanol–gasoline blends have a higher octane rating than regular gasoline. However, according to a recent analysis, ethanol–gasoline blends increase vehicle emissions of volatile organic compounds (VOCs), predominantly acetaldehydes compounds, which act as precursors to tropospheric ozone in urban areas.2 These outcomes have caused authorities to reconsider their previous support for the use of ethanol–gasoline mixes in major cities, where a high tropospheric ozone concentration is the primary environmental concern. Use of fuel containing more than 10% ethanol may cause materials degradation, starting and operating issues, and automobile engine malfunction. Automobiles can sustain irreparable damage as a result of these negative effects. Ethanol increases the danger of groundwater along with soil pollution, owing to a rise in tank corrosion, decreasing the interfacial tension between NAPL–water and lastly by preventing biodegradation and increasing the contaminant solubility. Besides its adverse effect, ethanol blending in petrol is used extensively all over of the world therefore selectively and rapidly detection to monitoring the percentage of ethanol in petrol is highly needed.3,4Many prospective materials have been studied for their behavior in chemical sensing throughout the years, as well as the sensing mechanisms that underlie the unique interactions of vapours, chemicals as well as gases with materials that are used in sensing applications. The development of chemical/gas/vapour sensors has recently focused heavily on carbon nanomaterials, metal oxide semiconductors, conductive polymers (CPs) and their nanocomposites.5–18 Due to its extraordinary functionalities through regulated charge transfer process, adjustable electrical conductivities, and self-resistivity changes upon exposure to various gases, conducting polymers have long been sought after as chemiresistor materials.16–21 Due to its extraordinary functionalities through regulated charge transfer process, adjustable electrical conductivities along with self-resistivity which alters when exposed to variety of gases, CPs have for a long time been used as chemiresistor.9–13 Polythiophene (PTh) being chemically, thermally and environmentally highly durable is amongst the most researched CPs. PTh and its derivatives stood out among gas sensors owing to their distinctive doping and de-doping mechanisms that produce a change in electrical conductivity when exposed to various chemicals and gases.22–33
2-Dimensional nanomaterials have captured a significant deal of attention due to its several uses in the past ten years and their extremely high surface area to volume ratio. Researchers have been fascinated by MXene, graphene, g-C3N4, and MoS2 among these materials because of their remarkable capacity as sensing materials, supercapacitors, and hydrogen evolution reactions.34–46 Taking inspiration from the aforementioned properties, here we described our efforts in developing polythiophene (PTh) and polythiophene/graphitic-carbon nitride (PTh/g-C3N4) nanocomposites for ethanol sensing in petrol. This is, too are awareness, the principal attempt which employs a sensor based on PTh/g-C3N4 nanocomposite for detecting ethanol in petrol at ambient conditions. We have also examined the sensing performance of PTh/g-C3N4 nanocomposite at different v/v% of ethanol in n-hexane.
2. Experimental
2.1. Materials
Thiophene (E. Merck), melamine (Fisher Scientific), chloroform (Fisher Scientific), anhydrous ferric chloride (CDH), methanol (E. Merck) and acetone (E. Merck) were used in their original state. Double distilled water (DDW) was used throughout the experiments.2.2. Preparation of graphitic-carbon nitride (g-C3N4)
The light-yellow g-C3N4 powder was made by heating melamine with heating rate 15 °C min−1 upto 550 °C for 3.5 h in an alumina crucible. Then the vessel containing g-C3N4 powder was cooled to room temperature for further processing.472.3. Preparation of polythiophene (PTh) and polythiophene/graphitic-carbon nitride (PTh/g-C3N4) nanocomposite
PTh and PTh/g-C3N4 nanocomposites were prepared by the in situ chemical oxidative polymerization. The first step was dissolving thiophene (2 mL) in chloroform (40 mL), followed by ultrasonication for 25 minutes. Additionally, another solution of a known amount of g-C3N4 (20%) was prepared by adding it to chloroform (60 mL) and ultrasonically sonicated for 30 minutes. The resulting solution containing the g-C3N4 sheets was then poured in the thiophene solution and this mixture was then ultrasonicated for 110 minutes. The thiophene monomers got absorbed on the g-C3N4 sheets during ultrasonication. Following this, a separate solution of 16.24 g (100 mmol) ferric chloride in chloroform (100 mL) was made by stirring for 20 minutes to obtain a homogeneous mixture. Now, for polymerizing thiophene monomers on the surface of g-C3N4 sheets, suspension of FeCl3 was added dropwise in thiophene and g-C3N4 mixture followed by constant stirring on magnetic stirrer. After 24 h of stirring, the as-prepared PTh/g-C3N4 nanocomposite was collected by Buchner suction funnel after draining of the residual in the solution and then washed numerous times using methanol, subsequently by double distilled water and lastly by acetone. Amid washing with methanol, the colour of the material changed dark brown from deep black. The nanocomposites were lastly dried in a vacuum oven at 60 °C for 24 hours. Finally, using a mortar and pestle, these items were ground into a fine powder. An analogous procedure was used to produce the pure PTh nanoparticles.2.4. Morphological and structural characterization
The characterization of PTh and PTh/g-C3N4 nanocomposites was performed by FT-IR (PerkinElmer 1725 instrument on KBr pellets), XRD (Bruker D8 diffractometer with Cu Kα radiation at 1.5418 Å), TGA {PerkinElmer (Pyris Diamond) instrument}, SEM {JEOL, JSM, 6510-LV (Japan)}, and TEM {JEM 2100, JEOL (Japan)} techniques respectively.21–25,30–33DC electrical conductivities and sensing experiments were performed by four-in-line probe instrument attached with the PID controlled oven manufactured by Scientific Equipment, Roorkee, India. The thermal stability as a function of DC electrical conductivity under isothermal and cyclic ageing environments was evaluated for all the nanocomposites. The equation which was utilized for calculating the conductivity was as follows:
σ = [ln![[thin space (1/6-em)]](https://www.rsc.org/images/entities/char_2009.gif) 2(2S/W)]/[2πS(V/I] 2(2S/W)]/[2πS(V/I]
| (1) |
3. Results and discussion
3.1. FT-IR
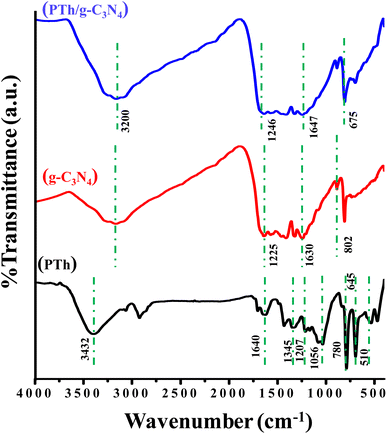
The FT-IR spectra of PTh, g-C3N4, and PTh/g-C3N4 are presented in Fig. 1. In the spectra of PTh, the wide peak at 3432 cm−1 may appear as a result of O–H stretching frequency of water molecules. The peaks at 1640 cm−1 and 1345 cm−1 could possibly be due to the C![[double bond, length as m-dash]](https://www.rsc.org/images/entities/char_e001.gif) C, and C–C stretching mode of vibration in the polythiophene rings respectively. The peaks at 1207 cm−1 and 1056 cm−1 may be because of the bending vibration in PTh. The peak around 780 cm−1 reveals the out of plane C–H bond bending in polythiophene. The peak at 645 cm−1 is because of the bending mode of vibration of the C–S bond of the thiophene ring. The C–S–C ring deformation mode is the cause of the band at 510 cm−1.22–25 In the g-C3N4 spectrum, multiple pinnacles between 1225–1630 cm−1 may be due to symmetrical C–N stretching vibration and the pinnacle at 802 cm−1 may be traced as dissymmetrical mode of stretching of C–N and C
C, and C–C stretching mode of vibration in the polythiophene rings respectively. The peaks at 1207 cm−1 and 1056 cm−1 may be because of the bending vibration in PTh. The peak around 780 cm−1 reveals the out of plane C–H bond bending in polythiophene. The peak at 645 cm−1 is because of the bending mode of vibration of the C–S bond of the thiophene ring. The C–S–C ring deformation mode is the cause of the band at 510 cm−1.22–25 In the g-C3N4 spectrum, multiple pinnacles between 1225–1630 cm−1 may be due to symmetrical C–N stretching vibration and the pinnacle at 802 cm−1 may be traced as dissymmetrical mode of stretching of C–N and C![[double bond, length as m-dash]](https://www.rsc.org/images/entities/char_e001.gif) N as well triazine units of the aromatic rings.48,49 In PTh/g-C3N4, it is found that on mixing of PTh in g-C3N4, the shoulder shifted to 1246 to 1647 cm−1, affirming that the thiophene monomer gets interacted with g-C3N4. The water molecules which may be trapped by the PTh/g-C3N4 nanocomposite and the amine groups present on g-C3N4 showing a merged peak at around 3200 cm−1. The peak seen at 675 cm−1 may be because of the C–S bending vibrations while all other characteristics peaks of polythiophene get merged with the g-C3N4.
N as well triazine units of the aromatic rings.48,49 In PTh/g-C3N4, it is found that on mixing of PTh in g-C3N4, the shoulder shifted to 1246 to 1647 cm−1, affirming that the thiophene monomer gets interacted with g-C3N4. The water molecules which may be trapped by the PTh/g-C3N4 nanocomposite and the amine groups present on g-C3N4 showing a merged peak at around 3200 cm−1. The peak seen at 675 cm−1 may be because of the C–S bending vibrations while all other characteristics peaks of polythiophene get merged with the g-C3N4.
3.2. X-Ray diffraction studies
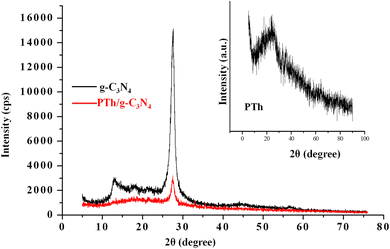
Fig. 2 depicts XRD patterns of g-C3N4, PTh and PTh/g-C3N4 nanocomposite. The appeared peaks at 2θ = 27.25° and 2θ = 12.87° in g-C3N4 spectra are in accordance with the (002) and (001) Brag reflections, originated from the 2D structure of g-C3N4.48,49 In PTh spectra a wide hump is observed at about 2θ = 16–27°, indicating an amorphous form of PTh.22–25 In case of PTh/g-C3N4 nanocomposite a broad bump around 2θ = 15–25° and a sharp peak at 2θ = 27.48° are observed, illustrating that PTh and g-C3N4 are present in the nanocomposite. The low intensities peaks in PTh/g-C3N4 nanocomposite clarifying that the amorphous PTh matrix might have shadowed the high intensity peaks of g-C3N4, which could be further understood by SEM and TEM studies of PTh/g-C3N4 nanocomposite. The shift in the diffraction peak, suggested that an interaction existed between g-C3N4 and PTh in PTh/g-C3N4 nanocomposite.3.3. Scanning electron microscopy
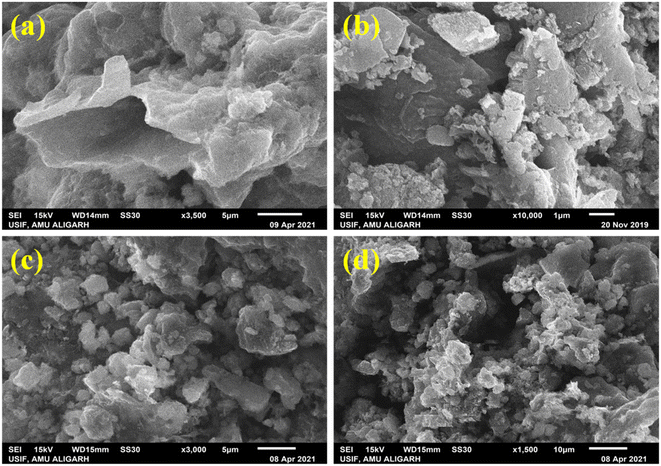
The morphologies of PTh {Fig. 3(a)}, g-C3N4 {Fig. 3(b)} and PTh/g-C3N4 {Fig. 3(c and d)} are depicted in Fig. 3 at different magnification by SEM operated at 15 kV. The SEM image of PTh is found to be some flaky and cloudy as shown in Fig. 3(a), while the g-C3N4 appeared in some sheet like form as shown in Fig. 3(b). The change in morphology of the PTh/g-C3N4 nanocomposite is evident from Fig. 3(c and d), which seems entirely unlike pure PTh due to the excellent multilayer enveloping of PTh over g-C3N4 nanosheets. For the PTh/g-C3N4 nanocomposite, PTh is well mounted on g-C3N4 nanosheets, resulting in the morphology becoming flaky and sheet-like. Absence of free g-C3N4 nanosheets are visible in the PTh/g-C3N4 nanocomposite, it is possible to conclude that PTh effectively covers g-C3N4 nanosheets.3.4. Transmission electron microscopy
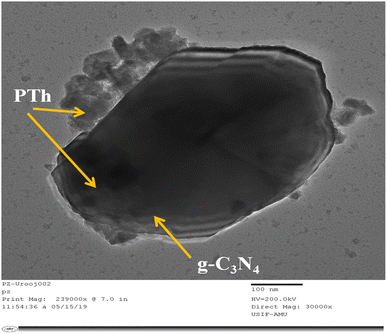
Fig. 4 displays the TEM micrograph of PTh/g-C3N4. Here in this image, it can be clearly observed that there is sheet of g-C3N4 upon which PTh has been successfully deposited and masked upon the entire surface of the g-C3N4 sheet. The monomers of thiophene polymerize over the large surface of g-C3N4 providing an effective π-conjugated system which promotes excessive transit of the charge carriers, which the reason for PTh/g-C3N4 showing higher sensing performance towards ethanol.3.5. Thermogravimetric analysis
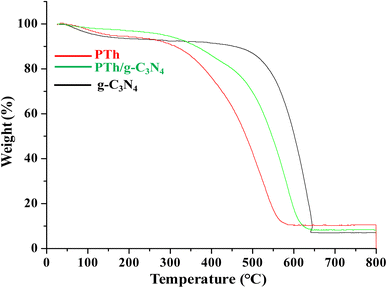
Thermo-gravimetric analysis of PTh, g-C3N4 and PTh/g-C3N4 nanocomposite is depicted in Fig. 5. In the degradation procedure of g-C3N4, the initial weight loss was found from 50 to 120 °C due to loss of water molecules. Subsequently, the oxidative thermal degradation of g-C3N4 is started at around 510 °C. While the PTh found to be least thermally stable among all of the samples. The initial loss of weight in PTh may be as a result of vaporization of water molecules followed by further degradation started around at 275 °C. In case of PTh/g-C3N4 nanocomposite, after losing of water molecules at around 80 to 105 °C, the final degradation started from 350 °C which is higher than that of PTh but lower than g-C3N4, suggesting the higher thermal stability of PTh/g-C3N4 nanocomposite than that of PTh, which may be a result of the electronic interaction taking place amid PTh and g-C3N4 nanosheets.4. Electrical conductivity studies
Fig. 6 the DC electrical conductivities of PTh, g-C3N4 and PTh/g-C3N4 nanocomposite were calculated by a 4-in-line probe method and marked as 8.326 × 10⁻⁴ S cm−1, 5.8273 × 10⁻⁵ S cm−1 and 6.4327 × 10⁻⁴ S cm−1 respectively as shown in Fig. 6(a). It was anticipated that upon interacting of lone pairs of S-atoms and π-electrons of thiophene ring in polythiophene with g-C3N4 sheets, the electrical conductivity will increase by generating more polarons on PTh as depicted in Fig. 6(b). Though, it is expected that there was a decline in electrical conductivity upon g-C3N4 in PTh may be due the insulating nature of g-C3N4. However, the fall in DC electrical conductivity was not as much and it is still found in the range of PTh, might be due to the more dominating effect of generated polarons in PTh than insulating g-C3N4 in tug of war between them. After all, despite an insignificant loss of electrical conductivity in PTh/g-C3N4 nanocomposite on incorporation of g-C3N4 in PTh, it provides a high surface area in nanocomposite by the formation of effective arrangement of the π-conjugated system of PTh on the large g-C3N4 surface area.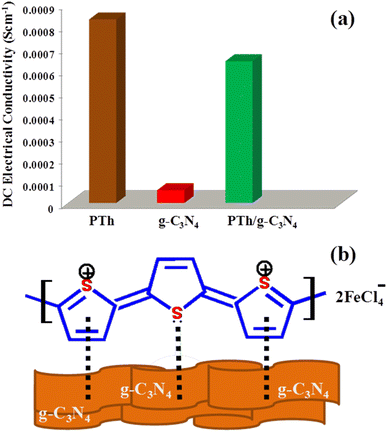 | ||
| Fig. 6 (a) Initial DC electrical conductivity of PTh, g-C3N4 and PTh/g-C3N4 nanocomposite and (b) the possible interaction between PTh and g-C3N4 sheets in PTh/g-C3N4 nanocomposite. | ||
4.1. Retention of DC electrical conductivity under isothermal ageing condition
The stability as a function of DC electrical conductivity retaining capacity under isothermal ageing conditions of the nanocomposites PTh and PTh/g-C3N4 were examined, as shown in Fig. 7.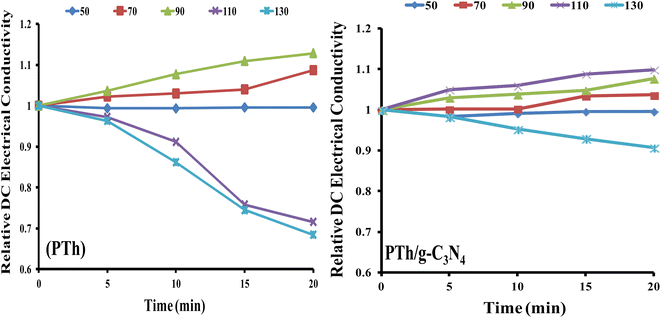 | ||
| Fig. 7 Relative DC electrical conductivity of PTh, and PTh/g-C3N4 nanocomposite under isothermal ageing environment. | ||
The equation applied for calculating the relative DC electrical conductivity (σr,t) at constant temperature was:
| σr,t = σt/σ0 | (2) |
It is clearly noticeable from Fig. 7(a) that PTh exhibited thermally stable electrical conductivity at temperatures 50 °C, 70 °C and 90 °C. At constant temperature up to 90 °C, DC electrical conductivity rises with time indicating the semiconducting nature of PTh. Whereas above 90 °C, there is a continuous fall of the DC electrical conductivity with time, which may be due to the damage of conducting channels as well as the loss of the doping agent in PTh. While for the PTh/g-C3N4, the DC electrical conductivity was found to be stable at 50 °C, 70 °C, 90 °C and 110 °C and behaves like semiconductor as displayed in Fig. 7(b). The incorporation of g-C3N4 in PTh stabilises its DC electrical conductivity even in high temperature condition (up to 110 °C) strongly suggesting presence of an electronic interaction between PTh and g-C3N4, which resists the damaging of its conducting channels and loss of the doping agent. These outcomes displayed that PTh/g-C3N4 could be an auspicious candidate in various electronic applications even at 110 °C.
4.2. Retention of DC electrical conductivity under cyclic ageing condition
PTh and PTh/g-C3N4 nanocomposite were also examined for their stability as a function of DC electrical conductivity performance under cyclic ageing conditions, as shown in Fig. 8.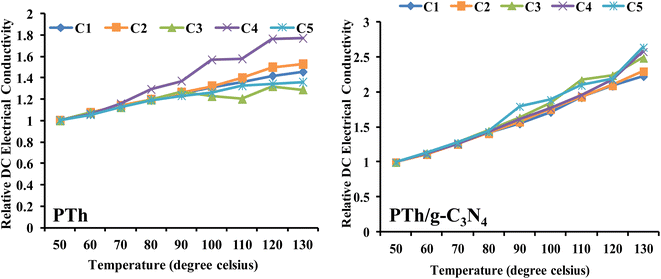 | ||
| Fig. 8 Relative DC electrical conductivity of PTh, and PTh/g-C3N4 nanocomposite under cyclic ageing environment. | ||
The equation applied for calculating the relative DC electrical conductivity (σr) was:
| σr = σT/σ50 | (3) |
The DC electrical conductivity of both the samples were recorded by four consecutive cycles with continuously rise in temperature up to 130 °C. These findings revealed that DC electrical conductivity increased steadily in each cycle and followed a same pattern in both of the samples (PTh and PTh/g-C3N4), which may be attributed to the high movability of polarons at elevated temperatures. For PTh {Fig. 8(a)}, in the third and fourth cycles, the conductivity shows different pattern might be as a result of damage of the material and loss of proper conductive channel by repeatedly heating and cooling of PTh. While PTh/g-C3N4 displayed continuous rise in conductivity with each cycle without losing its conductivity, signifying the presence of electronic interaction between PTh and g-C3N4.
5. Sensing
The electrical conductivity of CPs depends upon many factors e.g., dopants, temperature and fillers etc.17–22,50,51 In p-type doped conducting polymers, holes like polarons and bipolarons generated act as carriers of charge in the backbone of extended π-conjugated system of these CPs. The mobility of theses polarons and bipolarons charge carriers could considerably be hindered by any electronic interaction with the polymer chain. Adsorption and desorption of any analyte gas on the polymer sensor surface is the basic step in gas sensing procedure to monitor the effective electrical conductivity change of the polymer.20–25 Presence of analyte gases can be detected by simple change in electrical conductivity upon adsorption on the sensor's surface, as they interact with polarons of PTh, leading to decline in the DC electrical conductivity. Therefore, here PTh and PTh/g-C3N4 nanocomposites were tested for change in DC electrical conductivity on simple adsorption and desorption process of the analyte gas.The % sensing response (S) is calculated by the following equation:
| S = (Δσ/σi) × 100 | (4) |
5.1. Sensing response
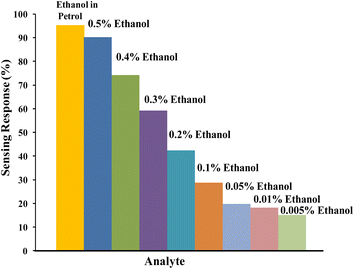
Sensing of ethanol in petrol was studied by examining the performance of relative DC electrical conductivity of PTh and PTh/g-C3N4 nanocomposite upon exposing to petrol vapours followed by ambient air as shown in Fig. 9. The PTh and PTh/g-C3N4 nanocomposite were finely grinded in powder form and then transformed into pellet form by hydraulic pressure machine. The pellets of each of the sample was attached to the four-in-line probes and placed in a sealed sensing chamber. At first PTh was exposed to petrol vapours followed by room atmosphere for a fixed time. In petrol vapour atmosphere, the DC electrical conductivity of PTh decreased exponentially for about first 90 s and then gets saturated for further change. The loss in electrical conductivity may be due to the ethanol present in petrol because as we know petrol comprises of mainly non-polar hydrocarbons with some mixing of ethanol to increase its octane rating.33 The hydrocarbon molecules in petrol being non-polar at ambient temperatures, don't interact electronically with polarons of PTh. The ethanol (C2H5OH) in petrol interacts with the polarons of PTh, disrupting the conductivity channels by impeding the movement of some polarons of PTh, causing decline in DC electrical conductivity. As PTh pellet exposed to ambient air, the relative DC electrical conductivity began to increase and came back to its initial value within 95 s and then flattened may be as a reason of complete desorption of ethanol from the PTh surface. Similarly for the PTh/g-C3N4 nanocomposite, the relative DC electrical conductivity declined by exposing the pellet of PTh/g-C3N4 nanocomposite to petrol and reverted back to its initial value within 80 s in air. The sensing response of PTh and PTh/g-C3N4 nanocomposite were found to be 15.55% and 94.73% respectively. The sensing response calculated in PTh/g-C3N4 nanocomposite was 6.1 times higher than that of PTh may be due to the high adsorption–desorption on PTh/g-C3N4 nanocomposite surface. Thus, incorporation of g-C3N4 in PTh, creating high surface area with proper advancing in conducting channels of PTh for adsorption and desorption of analyte gases. The sensing response of PTh/g-C3N4 toward ethanol in petrol as well as at different volume percentage (0.5%, 0.4%, 0.3%, 0.2%, 0.1% and 0.05%) of ethanol in n-hexane were also determined that is 95.3345%, 90.152%, 74.242%, 59.091%, 42.424%, 28.788%, 19.697%, 18.188% and 15.152% respectively as shown in Fig. 10. The sensing response towards petrol was the highest among them may due to the highest ethanol mixing in petrol. As the volume percentage of ethanol decreases, the sensing response decreases due to fewer interactions of lone pair of ethanol with polarons of PTh. As a result, one can say that considerable variation in conductivity was seen at high concentrations.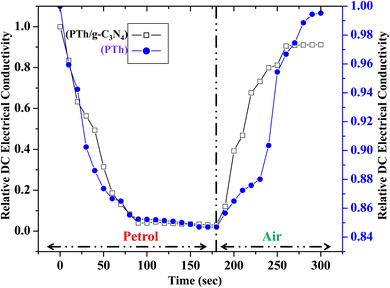 | ||
| Fig. 9 Relative DC electrical conductivity of PTh and PTh/g-C3N4 nanocomposite in petrol atmosphere. | ||
5.2. Ethanol sensing
In order to justify the PTh/g-C3N4 nanocomposite's sensing response towards ethanol in petrol, the DC electrical conductivity performance of PTh/g-C3N4 nanocomposite was also recorded for different volume percentage of ethanol in n-hexane as shown in Fig. 11. The DC electrical conductivity follows the same pattern as it is for petrol. As the volume percentage of ethanol increases, the variation in DC electrical conductivity of PTh/g-C3N4 nanocomposite increases, may be due to high interaction of ethanol with the polarons of PTh/g-C3N4 nanocomposite and gets saturated after few seconds. While in ambient air, conductivity completely reverted to its initial value by simple desorption of ethanol from PTh/g-C3N4 nanocomposite surface.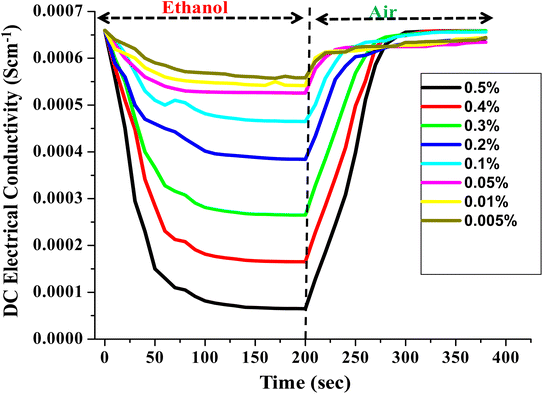 | ||
| Fig. 11 Steady-state response of DC electrical conductivity of PTh/g-C3N4 nanocomposite in different v/v% of ethanol atmosphere. | ||
5.3. Reversibility test
The PTh and PTh/g-C3N4 nanocomposite were tested for their rapid adsorption and desorption of analyte by observing the variation in relative DC electrical conductivity in environment of petrol for 30 s followed by ambient air for the next 30 s consecutively for three 60 s cycles as shown in Fig. 12. Both of the samples showed excellent reversibility with minimum loss in DC electrical conductivity in repeated three consecutive cycles. In PTh/g-C3N4 nanocomposite the variation in relative DC electrical conductivity was more superior to that of PTh, which may be due to more adsorption–desorption of analyte on PTh/g-C3N4 nanocomposite surface than that of PTh.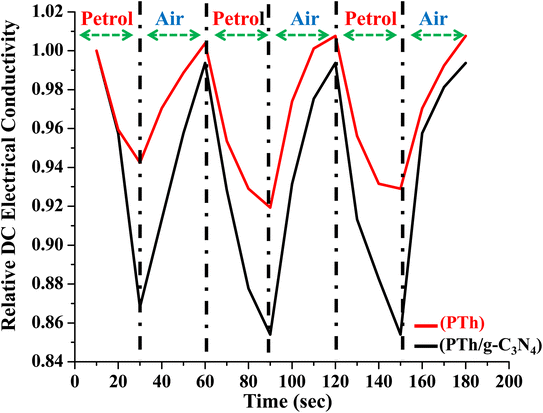 | ||
| Fig. 12 Relative DC electrical conductivity of PTh and PTh/g-C3N4 nanocomposite on alternate exposure to petrol and ambient air with respect to time. | ||
5.4. Selectivity
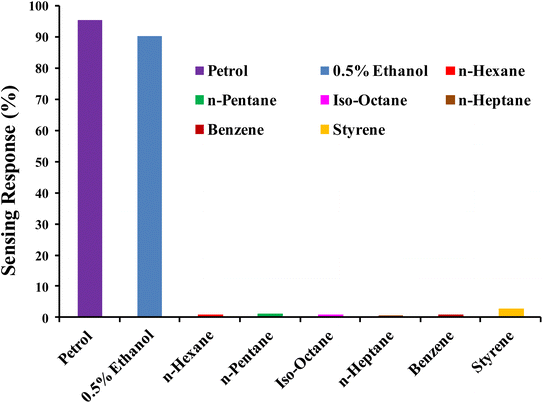
High selectivity is an essential criterion for a gas sensor in order to qualify as reliable and applicable. The PTh/g-C3N4 nanocomposite sensing response toward ethanol mixing in petrol, 0.5% ethanol in n-hexane, n-hexane, n-pentane, iso-octane, n-heptane, benzene, styrene at room temperature (27 °C) are displayed in Fig. 13. High selective response of PTh/g-C3N4 nanocomposite toward ethanol may be due its availability of lone pairs of oxygen which interacts with polarons of PTh, causing significant loss of DC electrical conductivity (high sensing response). While for the other analytes (hydrocarbons) tested, the sensing responses were negligible in comparison of ethanol may be of their non-polar nature. Thus the lower the polarity/free lone pairs of electrons in the analyte, lower the conductivity change occurred in PTh/g-C3N4 nanocomposite, makes ethanol highly selective in comparison of different hydrocarbon compounds.5.5. Sensing mechanism
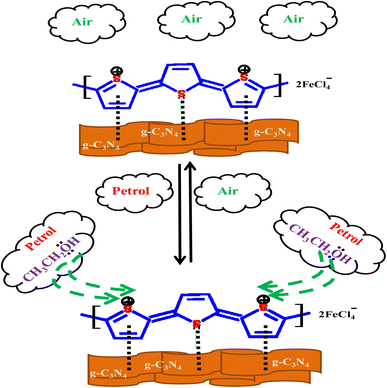
Sensing mechanism of PTh/g-C3N4 nanocomposite is explained by the DC electrical conductivity behaviour on simple adsorption and desorption mechanism of analyte at room temperature, as depicted in Scheme 1. In PTh/g-C3N4 nanocomposite, graphitic-carbon nitride get interacted with pi-bonds of thiophene rings in polythiophene and form a nanocomposite providing high surfaced platform for sensing of analytes. It is already known that petrol is comprises of majority of hydrocarbons and some ethanol mixing to raise its octane number. The hydrocarbon molecules in petrol being nonpolar at ambient temperature, do not interact with the polarons of polythiophene in PTh/g-C3N4 nanocomposite. Ethanol is predicted as the only candidate that could be accountable for the variation in the conductivity of PTh/g-C3N4 nanocomposite upon exposure to petrol vapors. In presence of petrol atmosphere, the lone pairs of ethanol interact with the polarons of PTh/g-C3N4 nanocomposite, which in turn hindered the movement of polarons, eventually declination of DC electrical conductivity with time. While in ambient air condition, the ethanol molecules and petrol gets desorbed from the sensor surface, resulting in reverting its conductivity to it's about initial values, indicating complete desorption of ethanol molecules mixed in petrol. Thus, the above mechanism indicates that polarons mobility is controlled by the simple adsorption and desorption of ethanol on PTh/g-C3N4 nanocomposite surface.6. Conclusions
In this paper, we synthesized PTh and PTh/g-C3N4 nanocomposite, characterized and studied for their stability of DC electrical conductivity and sensing response toward ethanol mixing in petrol. The stable nature of DC electrical conductivity of PTh/g-C3N4 nanocomposite under accelerated isothermal and cyclic ageing condition were demonstrated and found significantly higher than that of PTh. Also the PTh/g-C3N4 nanocomposite showed rapid response and high reversibility towards ethanol mixing in petrol and ethanol prepared in n-hexane with a detection limit of 0.005%. The sensing response in PTh/g-C3N4 nanocomposite towards ethanol mixing in petrol was 6.1 times higher than that of PTh at room temperature. In addition of excellent sensing response, this research found that PTh/g-C3N4 nanocomposite might be used as a semiconducting material in a variety of electronic and electrical devices at high temperature conditions.Conflicts of interest
The authors declare that they have no known competing financial interests or personal relationships that could have appeared to influence the work reported in this paper.Acknowledgements
Authors are thankful to USIF, AMU, Aligarh-202002 for providing SEM and TEM facilities.References
- C. Park, Y. Choi, C. Kim, S. Oh, G. Lim and Y. Moriyoshi, Performance and exhaust emission characteristics of a spark ignition engine using ethanol and ethanol-reformed gas, Fuel, 2010, 89, 2118–2125, DOI:10.1016/j.fuel.2010.03.018.
- M. A. Costagliola, L. de Simio, S. Iannaccone and M. V. Prati, Combustion efficiency and engine out emissions of a S. I. engine fueled with alcohol/gasoline blends, Appl. Energy, 2013, 111, 1162–1171, DOI:10.1016/j.apenergy.2012.09.042.
- J. Tibaquirá, J. Huertas, S. Ospina, L. Quirama and J. Niño, The Effect of Using Ethanol–Gasoline Blends on the Mechanical, Energy and Environmental Performance of In-Use Vehicles, Energies, 2018, 11, 221, DOI:10.3390/en11010221.
- R. K. Niven, Ethanol in gasoline: environmental impacts and sustainability review article, Renewable Sustainable Energy Rev., 2005, 9, 535–555, DOI:10.1016/j.rser.2004.06.003.
- M. Tonezzer, D. T. T. Le, L. V. Duy, N. D. Hoa, F. Gasperi, N. V. Duy and F. Biasioli, Electronic noses based on metal oxide nanowires: A review, Nanotechnol. Rev., 2022, 11, 897–925, DOI:10.1515/ntrev-2022-0056.
- P. H. Phuoc, C. H. Hunga, N. V. Toana, N. V. Duya, N. D. Hoaa and N. V. Hieub, One-step fabrication of SnO2 porous nanofiber gas sensors for sub-ppm H2S detection, Sens. Actuators, A, 2020, 303, 111722, DOI:10.1016/j.sna.2019.111722.
- T. V. Dang, N. D. Hoa, N. V. Duy and N. V. Hieu, Chlorine Gas Sensing Performance of On-Chip Grown ZnO, WO3, and SnO2 Nanowire Sensors, ACS Appl. Mater. Interfaces, 2016, 8, 4828–4837, DOI:10.1021/acsami.5b08638.
- D. D. Trunga, N. D. Hoaa, P. V. Tonga, N. V. Duya, T. D. Dao, H. V. Chung, T. Nagao and N. V. Hieua, Effective decoration of Pd nanoparticles on the surface of SnO2 nanowires for enhancement of CO gas-sensing performance, J. Hazard. Mater., 2014, 265, 124–132, DOI:10.1016/j.jhazmat.2013.11.054.
- C. T. Xuan, C. M. Hung, N. V. Duy, T. M. Ngoc, Q. T. M. Nguyet and N. D. Hoa, Arc-discharge deposition of SWCNTs over SnO2 nanowires for highly sensitive NO2 gas sensor, Adv. Nat. Sci.: Nanosci. Nanotechnol., 2022, 13(8pp), 035007, DOI:10.1088/2043-6262/ac87a3.
- C. Xue, Y. Zhang, B. Liu, S. Gao, H. Yang, P. Li, N. D. Hoa, Y. Xu, Z. J. Niu, X. Liao, D. Cui and H. Jin, Smartphone Case-Based Gas Sensing Platform for On-site Acetone Tracking, ACS Sens., 2022, 7, 1581–1592, DOI:10.1021/acssensors.2c00603.
- D. N. Son, C. H. Hung, D. T. T. Le, C. T. Xuan, N. V. Duy, N. Q. Dich, H. Nguyen, N. V. Hieu and N. D. Hoa, A novel design and fabrication of self-heated In2O3 nanowire gas sensor on glass for ethanol detection, Sens. Actuators, A, 2022, 345, 113769, DOI:10.1016/j.sna.2022.113769.
- T. T. H. Duong, H. H. Hau, L. T. Hong, L. A. Vu, C. M. Hung, N. V. Duy, N. V. Hieu and N. D. Hoa, PtO2-decorated MoS2 ultrathin nanostructures for enhanced NH3 gas sensing properties, Mater. Sci. Semicond. Process., 2022, 151, 106990, DOI:10.1016/j.mssp.2022.106990.
- N. Abraham, R. R. Krishnakumar, C. Unni and D. Philip, Simulation studies on the responses of ZnO–CuO/CNT nanocomposite based SAW sensor to various volatile organic chemicals, J. Sci.: Adv. Mater. Devices, 2018, 4, 125e131, DOI:10.1016/j.jsamd.2018.12.006.
- C. M. Hung, D. Thi, T. Le and N. Van Hieu, On-chip growth of semiconductor metal oxide nanowires for gas sensors: a review, J. Sci.: Adv. Mater. Devices, 2017, 2, 263e285, DOI:10.1016/j.jsamd.2017.07.009.
- K. R. Jawaher, R. Indirajith, S. Krishnan, R. Robert, S. K. K. Pasha, K. Deshmukh and S. J. Das, Hydrothermal synthesis of CeO2–SnO2 nanocomposites with highly enhanced gas sensing performance towards n-Butanol, J. Sci.: Adv. Mater. Devices, 2018, 3, 139e144, DOI:10.1016/j.jsamd.2018.03.006.
- T. T. Nguyet, L. V. Duy, Q. T. M. Nguyet, C. T. Xuan, D. T. T. Le, C. M. Hung, N. V. Duy and N. D. Hoa, Novel Synthesis of a PANI/ZnO Nanohybrid for Enhanced NO2 Gas Sensing Performance at Low Temperatures, J. Electron. Mater., 2023, 52(1), 304–319, DOI:10.1007/s11664-022-09990-0.
- S. Pandey, Highly sensitive and selective chemiresistor gas/vapor sensors based on polyaniline nanocomposite: a comprehensive review, J. Sci.: Adv. Mater. Devices, 2016, 1, 431–453, DOI:10.1016/j.jsamd.2016.10.005.
- S. J. Park, C. S. Park and H. Yoon, Chemo-electrical gas sensors based on conducting polymer hybrids, Polymers, 2017, 9, 155, DOI:10.3390/polym9050155.
- N. Van Hieu, N. Quoc, P. Dinh, T. Trung and N. Duc, Thin film polypyrrole/SWCNTs nanocomposites-based NH3 sensor operated at room temperature, Sens. Actuators, B, 2009, 140, 500e507, DOI:10.1016/j.snb.2009.04.061.
- T. Sen, S. Mishra and N. G. Shimpi, Synthesis and sensing applications of polyaniline nanocomposites: a review, RSC Adv., 2016, 6, 42196–42222, 10.1039/c6ra03049a.
- S. Ahmad, M. M. Ali Khan and F. Mohammad, Graphene/nickel oxide-based nanocomposite of polyaniline with special reference to ammonia sensing, ACS Omega, 2018, 3, 9378–9387, DOI:10.1021/acsomega.8b00825.
- A. Husain, S. Ahmad and F. Mohammad, Thermally stable and highly sensitive ethene gas sensor based on polythiophene/zirconium oxide nanocomposites, Mater. Today Commun., 2019, 20, 100574, DOI:10.1016/j.mtcomm.2019.100574.
- A. Husain, S. Ahmad and F. Mohammad, Synthesis, characterisation and ethanol sensing application of polythiophene/graphene nanocomposite, Mater. Chem. Phys., 2020, 239, 122324, DOI:10.1016/j.matchemphys.2019.122324.
- A. Husain, S. Ahmad and F. Mohammad, Electrical conductivity and ammonia sensing studies on polythiophene/MWCNTs nanocomposites, Materialia, 2020, 14, 100868, DOI:10.1016/j.mtla.2020.100868.
- A. Husain, S. Ahmad, M. U. Urooj and M. M. A. Khan, Ultra-sensitive , highly selective and completely reversible ammonia sensor based on polythiophene/SWCNT nanocomposite, Materialia, 2020, 10, 100704, DOI:10.1016/j.mtla.2020.100704.
- S. Bachhav and D. Patil, Preparation and characterization of multiwalled carbon nanotubes-polythiophene nanocomposites and its gas sensitivity study at room temperature, J. Nanostruct., 2017, 7, 247e257, DOI:10.22052/jns.2017.54171.
- S. S. Barkade, D. V Pinjari, U. T. Nakate, A. K. Singh, P. R. Gogate, J. B. Naik, S. H. Sonawane and A. B. Pandit, Process intensification ultrasound-assisted synthesis of polythiophene/SnO2 hybrid nanolatex particles for LPG sensing, Chem. Eng. Process., 2013, 74, 115e123, DOI:10.1016/j.cep.2013.09.005.
- S. Bai, J. Guo, J. Sun, P. Tang, A. Chen, R. Luo and D. Li, Enhancement of NO2 sensing performance at room temperature by graphene modified polythiophene, Ind. Eng. Chem. Res. Enhanc., 2016, 55, 5788e5794, DOI:10.1021/acs.iecr.6b00418.
- A. Tripathi, S. K. Mishra and I. Bahadur, Optical properties of regiorandom polythiophene/Al2O3 nanocomposites and their application to ammonia gas sensing, J. Mater. Sci.: Mater. Electron., 2015, 26, 7421e7430, DOI:10.1007/s10854-015-3373-9.
- A. Husain, M. U. Shariq and F. Mohammad, DC electrical conductivity and liquefied petroleum gas sensing application of polythiophene/zinc oxide nanocomposite, Materialia, 2020, 9, 100599, DOI:10.1016/j.mtla.2020.100599.
- A. Husain, S. Ahmad and F. Mohammad, Electrical conductivity and alcohol sensing studies on polythiophene/tin oxide nanocomposites, J. Sci.: Adv. Mater. Devices, 2020, 5, 84e94, DOI:10.1016/j.jsamd.2020.01.002.
- A. Husain, S. Ahmad and F. Mohammad, Polythiophene/graphene/zinc tungstate nanocomposite: synthesis, characterization, DC electrical conductivity and cigarette smoke sensing application, Polym. Polym. Compos., 2021, 29(6), 605–616, DOI:10.1177/0967391120929079.
- A. Husain, Electrical conductivity based ammonia, methanol and acetone vapour sensing studies on newly synthesized polythiophene/molybdenum oxide nanocomposite, J. Sci.: Adv. Mater. Devices, 2021, 6(4), 528–537, DOI:10.1016/j.jsamd.2021.07.002.
- W. Yuan, K. Yang, H. Peng, F. Li and F. Yin, A flexible VOCs sensor based on a 3D Mxene framework with a high sensing performance, J. Mater. Chem. A, 2018, 37, 1–10, 10.1039/C8TA06928J.
- D. H. Ho, Y. Y. Choi, S. B. Jo, J. M. Myoung and J. H. Cho, Sensing with MXenes: Progress and Prospects, Adv. Mater., 2021, 33, 2005846–2005875, DOI:10.1002/adma.202005846.
- J. H. Choi, J. Lee, M. Byeon, T. E. Hong, H. Park and C. Y. Lee, Graphene-Based Gas Sensors with High Sensitivity and Minimal Sensor-to-Sensor Variation, ACS Appl. Nano Mater., 2020, 3(3), 2257–2265, DOI:10.1021/acsanm.9b02378.
- S. Zulaikha, N. Demon, A. I. Kamisan, N. Abdullah, S. A. M. Noor, O. K. Khim, N. A. M. Kasim, M. Z. A. Yahya, N. Azlian, A. Manaf, A. F. M. Azmi and N. A. Halim, Graphene-based Materials in Gas Sensor Applications: A Review, Sens. Mater., 2020, 32, 759–777, DOI:10.18494/SAM.2020.2492.
- K. S. Pasupuleti, D. J. Nam, N. hyun Bak, M. Reddeppa, J. E. Oh, S. G. Kim, H. D. Choe and M. D. Kim, Highly sensitive g-C3N4 nanosheets as a potential candidate for the effective detection of NO2 gas via langasite-based surface acoustic wave gas sensor, J. Mater. Chem. C, 2022, 10, 160–170, 10.1039/d1tc04904f.
- Y. Xua, W. Lei, J. Su, J. J. Hu, X. Yu, T. Zhou, Y. Yang, D. Mandler and Q. Hao, A high-performance electrochemical sensor based on g-C3N4-E-PEDOT for the determination of acetaminophen, Electrochim. Acta, 2018, 259, 994–1003, DOI:10.1016/j.electacta.2017.11.034.
- T. Pham, G. Li, E. Bekyarova, M. E. Itkis and A. Mulchandani, MoS2-Based Optoelectronic Gas Sensor with Sub-parts-per-billion Limit of NO2 Gas Detection, ACS Nano, 2019, 13(3), 3196–3325, DOI:10.1021/acsnano.8b08778.
- S. Ahmad, I. Khan, A. Husain, A. Khan and A. M. Asiri, Electrical Conductivity Based Ammonia Sensing Properties of Polypyrrole/MoS2 Nanocomposite, Polymers, 2020, 12, 3047, DOI:10.3390/polym12123047.
- Y. Wang, Y. Liu, C. Wang, H. Liu, J. Zhang and J. Lin, Significantly enhanced ultrathin NiCo-based MOF nanosheet electrodes hybrided with Ti3C2Tx MXene for high performance asymmetric supercapacitors, Eng. Sci., 2020, 9, 50–59, DOI:10.30919/es8d903.
- B. Song, T. Wang, L. Wang, H. Liu, X. Mai and X. Wang, Interfacially reinforced carbon fiber/epoxy composite laminates via in situ synthesized graphitic carbon nitride (g-C3N4), Composites, Part B, 2019, 158, 259–268, DOI:10.1016/j.compositesb.2018.09.081.
- B. Song, T. Wang, H. Sun, H. Liu, X. Mai and X. Wang, Graphitic carbon nitride (g-C3N4) interfacially strengthened carbon fiber epoxy composites, Compos. Sci. Technol., 2018, 167, 515–521, DOI:10.1016/j.compscitech.2018.08.031.
- B. Lin, Z. Lin, S. Chen, M. Yu, W. Li and Q. Gao, Surface intercalated spherical MoS2xSe2(1−x) nanocatalysts for highly efficient and durable hydrogen evolution reactions, Dalton Trans., 2019, 48(23), 8279–8287, 10.1039/C9DT01218D.
- A. Husain, S. Ahmad, S. P. Ansari, M. O. Ansari and M. M. A. Khan, DC electrical conductivity retention and acetone/acetaldehyde sensing on polythiophene/molybdenum disulphide composites, Polym. Polym. Compos., 2021, 29(9), S422–S431, DOI:10.1177/09673911211002781.
- M. Danish and M. Muneer, Novel ZnSQDs-SnO2/g-C3N4 nanocomposite with enhanced photocatalytic performance for the degradation of different organic pollutants in aqueous suspension under visible light, J. Phys. Chem. Solids, 2021, 149, 109785, DOI:10.1016/j.jpcs.2020.109785.
- R. Peymanfar, A. Mohammadi and S. Javanshir, Preparation of graphite-like carbon nitride/polythiophene nanocomposite and investigation of its optical and microwave absorbing characteristics, Compos. Commun., 2020, 21, 100421, DOI:10.1016/j.coco.2020.100421.
- S. Yan, Z. Li and Z. Zou, Photodegradation performance of g-C3N4 fabricated by directly heating melamine, Langmuir, 2009, 25, 10397–10401, DOI:10.1021/la900923z.
- A. Husain, S. A. A. Zahrani, A. A. Otaibi, I. Khan, M. M. A. Khan, A. M. Alosaimi, A. Khan, M. A. Hussein, A. M. Asiri and M. Jawaid, Fabrication of reproducible and selective ammonia vapor sensor-pellet of polypyrrole/cerium oxide nanocomposite for prompt detection at room temperature, Polymers, 2021, 13(11), 1829, DOI:10.3390/polym13111829.
- A. Husain and D. K. Mahajan, Effect of multi-walled carbon nanotubes on DC electrical conductivity and acetone vapour sensing properties of polypyrrole, Carbon Trends, 2022, 9, 100193, DOI:10.1016/j.cartre.2022.100193.
- M. O. Ansari and F. Mohammad, Thermal stability and electrical properties of dodecyl–benzene–sulfonic-acid doped nanocomposites of polyaniline and multi-walled carbon nanotubes, Composites, Part B, 2012, 43, 3541e3548, DOI:10.1016/j.compositesb.2011.11.031.
- M. Omaish, S. Kumar, J. Whan and F. Mohammad, Thermal stability in terms of DC electrical conductivity retention and the efficacy of mixing technique in the preparation of nanocomposites of graphene/polyaniline over the carbon nanotubes/polyaniline, Composites, Part B, 2013, 47, 155e161, DOI:10.1016/j.compositesb.2012.10.042.
| This journal is © The Royal Society of Chemistry 2023 |

