 Open Access Article
Low-temperature selective catalytic reduction of NO with NH3 over an FeOx/β-MnO2 composite
Bo Duabc,
Yuting Huabc,
Ting Chengabc,
Zhaozhong Jiangabc,
Zhenzhen Wangabc and
Chengzhu Zhu *abcd
*abcd
aSchool of Resource and Environmental Engineering, Hefei University of Technology, Hefei 230009, P. R. China. E-mail: czzhu@hfut.edu.cn; Fax: +86 551 62901649; Tel: +86 551 62901523
bInstitute of Atmospheric Environment & Pollution Control, Hefei University of Technology, Hefei 230009, P. R. China
cKey Laboratory of Nanominerals and Pollution Control of Anhui Higher Education Institutes, Hefei University of Technology, Hefei 230009, P. R. China
dLow Temperature Denitration Engineering Research Center of Anhui Province, Hefei 230001, P. R. China
First published on 22nd February 2023
Abstract
A series of Fe-modified β-MnO2 (FeOx/β-MnO2) composite catalysts were prepared by an impregnation method with β-MnO2 and ferro nitrate as raw materials. The structures and properties of the composites were systematically characterized and analyzed by X-ray diffraction, N2 adsorption–desorption, high-resolution electron microscopy, temperature-programmed reduction of H2, temperature-programmed desorption of NH3, and FTIR infrared spectroscopy. The deNOx activity, water resistance, and sulfur resistance of the composite catalysts were evaluated in a thermally fixed catalytic reaction system. The results indicated that the FeOx/β-MnO2 composite (Fe/Mn molar ratio of 0.3 and calcination temperature of 450 °C) had higher catalytic activity and a wider reaction temperature window compared with β-MnO2. The water resistance and sulfur resistance of the catalyst were enhanced. It reached 100% NO conversion efficiency with an initial NO concentration of 500 ppm, a gas hourly space velocity of 45![[thin space (1/6-em)]](https://www.rsc.org/images/entities/char_2009.gif) 000 h−1, and a reaction temperature of 175–325 °C. The appropriate Fe/Mn molar ratio sample had a synergistic effect, affecting the morphology, redox properties, and acidic sites, and helped to improve the low-temperature NH3-SCR activity of the composite catalyst.
000 h−1, and a reaction temperature of 175–325 °C. The appropriate Fe/Mn molar ratio sample had a synergistic effect, affecting the morphology, redox properties, and acidic sites, and helped to improve the low-temperature NH3-SCR activity of the composite catalyst.
1. Introduction
Excessive emissions of nitrogen oxides cause a series of environmental problems, such as the greenhouse effect,1 acid rain,2 photochemical smog,3 etc. Furthermore, nitrogen oxides could enter the human body through inhalation, skin contact, and ingestion,4 thus causing harm to humans.5–7 Countries worldwide have set increasingly stringent emission standards to reduce NOx emissions.8–10 Many technologies have been developed to reduce NOx emissions, among which selective catalytic reduction (SCR) with NH3 as the reducing agent was the most mature and effective method, especially for stationary sources of NOx emissions. However, the application of this technology was limited due to most NH3-SCR catalysts afforded activity merely at a high exhaust temperature.11,12At present, the V2O5–WO3/TiO2 catalyst has been widely used in flue gas denitrification systems of thermal power plants. It had a narrow activation temperature window and was typically used in flue gases above 320 °C to ensure high NOx removal activity.13,14 Whereas its denitrification activity was inhibited while the flue gas temperature was lower. In addition, vanadium-containing catalysts were biotoxicity and prone to secondary contamination after deactivation or aging.15 And it was listed on the China National List of Hazardous Chemicals in 2016.16
More recently, Mn-based catalysts attracted wide attention because of their outstanding NH3-SCR activity.17 Kapteijn et al.18 found that MnO2 had a higher SCR activity than other MnOx. Meng et al.19 found β-MnO2 was the most catalytically active of the three crystalline types of MnO2. Yang et al.20 reported that β-MnO2 had a good NH3-SCR activity at 120 °C to 350 °C. However, it was weakly resistant to SO2 and reacted with SO2 to produce MnSO4 to lose NH3-SCR activity,21 and need further strengthened in breadth and depth.
FeOx had been explored for NH3-SCR reaction because of its environmentally friendly properties, satisfactory N2 selectivity, and excellent tolerance of SO2 at high temperatures.22–24 Xie et al.25 used Fe2O3-modified MnO2/attapulgite (Mn–ATP) for NH3-SCR and found that Fe2O3 modification could enhance the N2 selectivity and resistance to H2O/SO2 of the catalyst. Qiu et al.26 prepared S–MnFeCoCe/Ti/Si catalysts by Fe modification, which maintained high NOx conversion at 50 ppm SO2 and 10 vol% H2O. They also found that the presence of interactions between Mn oxide and Fe oxide enhanced the durability of the catalyst to sulfur and water.
In this study, using β-MnO2 as a carrier and FeOx as modified additives, the FeOx/β-MnO2 composite catalyst was synthesized by impregnation method. The denitrification activity of composite for SCR of NOx with NH3 was systematically investigated. And the composite was characterized by X-ray diffraction, high-resolution electron microscope, temperature-programmed reduction of H2 (H2-TPR), temperature-programmed desorption of NH3 (NH3-TPD), and FTIR infrared spectroscopy, etc. techniques to explain the advantages of deNOx activity, water resistance, and sulfur resistance of the modified composite.
2. Experimental sections
2.1 Catalysts preparation
Synthetic β-MnO2 was synthesized by the hydrothermal synthesis method.27 MnSO4 and an equal amount of (NH4)2S2O8 were dissolved in deionized water, then transferred into a Teflon-lined stainless steel autoclave, and reacted at 120 °C for 12 h. After the reaction was completed, the black solid product obtained by filtering was washed with derived ions to remove the possible ions in the final product. Finally, the product was dried in air at 120 °C.The proportion of ferric nitrate and >60 mesh β-MnO2 powders were dissolved in deionized water in turn and stirred for 1 h to form a uniform solution. The solution was heated to the slurry in a heating furnace and then transferred to a 100 °C oven for drying to obtain the precursors of FeOx/β-MnO2 composites.
The FeOx/β-MnO2 precursors were calcined at different temperatures for 2 h to obtain the catalysts. Based on the preparation conditions, they were noted as FeOx(n)/β-MnO2(z), where n represented the molar ratios of Fe and Mn and z represented the calcination temperatures. After cooling to room temperature, the catalyst was crushed and sieved, and 40–60 meshes of catalyst were selected for the NH3-SCR activity test.
2.2 Catalysts characterization
The crystal structures of the catalysts were determined by the X-ray diffraction meter (XRD, D/Max-RB, Rigaku), Cu Kα radiation source, tube voltage 40 kV, tube current 80 mA, step length 0.02° s−1, scanning range 10°–75°. The specific surface area and pore structure of the catalysts were determined by an automatic specific surface area analyzer (BET, NOVA3000e, Quantachrome, USA). The surface morphology of the samples was observed by high-resolution field emission scanning electron microscopy (SEM, Hitachi Regulus 8230, Japan). X-ray photoelectron spectrometer (XPS, Thermo ESCALAB250Xi, USA) was used to determine valence and element content (Al-Kα radiation, 1486.6 eV, and the C 1s line at 284.8 eV as the standard). H2-TPR and NH3-TPD were detected by the Autocue II 2920 chemisorbent of Mick Instrument Corporation in the United States. The surface functional groups of the catalysts were analyzed by Fourier transform infrared spectroscopy (FTIR, Bruker Vertex-70, Germany).2.3 Catalytic performance test
The experiment of selective catalytic reduction of NO from ammonia gas was carried out using a thermostat bed catalytic reaction system. The system consisted of a flue gas mixing system, a catalytic fixed bed and a flue gas analysis system. The catalytic fixed bed was a cylindrical reactor with a Cr18Ni9Ti stainless steel shell on the outer layer and quartz cotton on the inner layer. The catalyst activity test was carried out on the catalytic fixed bed (quartz tube fixed bed with a diameter of 6 mm), and the catalytic reaction temperature was adjusted through the ceramic fiber tube heater, thermocouple, and temperature-programmed control device.The gas distribution system had five gas branches, which were supplied by gas cylinders. The mass flow controller (Sevenstar, D07-7C, Beijing) was used to control the flow of each branch. The total gas flow was 300 mL min−1. The simulated flue gas consisted of 0.05% NO, 0.05% NH3, 3 vol% O2, 10 vol% H2O (when used), and 200/300 ppm SO2 (when used), Ar as the balance gas. The water vapor was generated by the peristaltic pump together the heating tape and then passed into the gas line. The GHSV of 35![[thin space (1/6-em)]](https://www.rsc.org/images/entities/char_2009.gif) 000 h−1 was selected.
000 h−1 was selected.
The catalytic activity of the catalyst was measured by NO conversion (ηNO), and the NO concentration in the feed gas and tail gas was detected by flue gas analyzer (Madur GA-12plus, Austria).
 | (1) |
3. Results and discussion
3.1 Catalytic performances
![[thin space (1/6-em)]](https://www.rsc.org/images/entities/char_2009.gif) 000 h−1
000 h−1
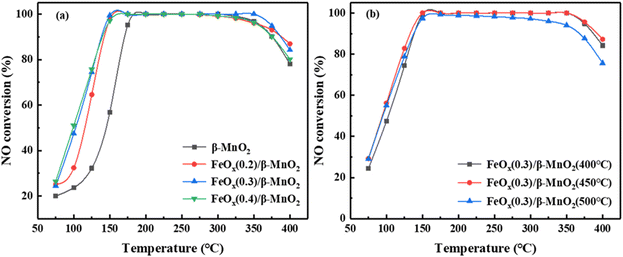
The calcination temperature could affect the SCR activity of the catalyst, and the catalytic activity of MnO2 could be different at different calcination temperatures.33 Fig. 1b showed the influence of different calcination temperatures on the NO conversion of FeOx(0.3)/β-MnO2(z) composite catalysts. When the calcination temperatures were 400 °C and 450 °C, the activity of the catalyst in the low-temperature section was very similar, but FeOx(0.3)/β-MnO2(450 °C) was slightly superior in the high-temperature section. When the calcination temperature was 500 °C, the low-temperature SCR activity of FeOx(0.3)/β-MnO2(500 °C) was inferior to that of the composite catalysts calcined at other temperatures. This phenomenon tallied well with the activity test results of the catalysts prepared at different calcination temperatures.34 In addition, along the reaction temperature increased from 325 °C to 400 °C, the activity of the FeOx(0.3)/β-MnO2(450 °C) composite catalyst decreased. It might be due to the Mn oxides and Fe oxides could reduce the activation energy of NH3 oxidation reaction and promoted the oxidation of NH3 to reduce the concentration of NH3 in flue gas.12,15 The reactions (2–4) could generate a certain amount of NO and a new pollutant N2O, which could affect the denitrification effect of the catalyst.7
| 4NH3 + 3O2 → 2N2 + 6H2O | (2) |
| 4NH3 + 4O2 → 2N2O + 6H2O | (3) |
| 4NH3 + 5O2 → 4NO + 6H2O | (4) |
Compared with other Mn-based and Fe-based catalysts from literature (Table 1), the prepared FeOx(0.3)/β-MnO2(450 °C) composite could maintain a high NO conversion over a wide temperature range and had a good industrial application prospect.
| Catalyst | Calcination | Reaction condition | NO conversion | Ref. |
|---|---|---|---|---|
| FeOx/β-MnO2 | Impregnation | [NO] = [NH3] = 500 ppm, 3% O2 in Ar, GHSV = 35![[thin space (1/6-em)]](https://www.rsc.org/images/entities/char_2009.gif) 000 h−1 000 h−1 |
∼100% (175–325 °C) | This work |
| MnOx/α-Fe2O3 | Impregnation | [NO] = [NH3] = 500 ppm, 5% O2 in Ar, GHSV = 72![[thin space (1/6-em)]](https://www.rsc.org/images/entities/char_2009.gif) 000 h−1 000 h−1 |
>90% (200–350 °C) | 8 |
| Fe–Mn/TiO2(xPr) | Impregnation | [NO] = [NH3] = 1000 ppm, 7% O2 in N2, GHSV = 30![[thin space (1/6-em)]](https://www.rsc.org/images/entities/char_2009.gif) 000 h−1 000 h−1 |
>95% (140–220 °C) | 10 |
| Fe–Mn/Ce1Al2 | Co-precipitation | [NO] = [NH3] = 500 ppm, 5% O2 in Ar, GHSV = 30![[thin space (1/6-em)]](https://www.rsc.org/images/entities/char_2009.gif) 000 h−1 000 h−1 |
>90% (75–250 °C) | 29 |
| CeO2–Fe2O3/Al2O3 | Microwave hydrothermal | [NO] = [NH3] = 500 ppm, 5% O2 in N2, GHSV = 6000 h−1 | >90% (200–300 °C) | 30 |
| Fe0.8Mg0.2Oz | Co-precipitation | [NO] = [NH3] = 1000 ppm, 3.5% O2 in N2, GHSV = 6000 h−1 | >90% (250–350 °C) | 31 |
| Mn–Ce/Febeta | Incipient wetness co-impregnation | [NO] = 380 ppm, [NH3] = 330 ppm, 10% O2 in N2, GHSV = 36![[thin space (1/6-em)]](https://www.rsc.org/images/entities/char_2009.gif) 000 h−1 000 h−1 |
>80% (180–500 °C) | 32 |
![[thin space (1/6-em)]](https://www.rsc.org/images/entities/char_2009.gif) 000 h−1 to 45
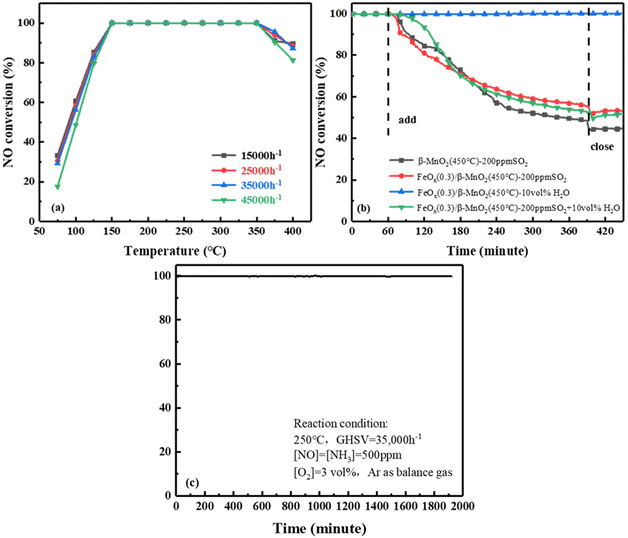
000 h−1 to 45![[thin space (1/6-em)]](https://www.rsc.org/images/entities/char_2009.gif) 000 h−1, the NO conversion rate of FeOx(0.3)/β-MnO2(450 °C) still reached 100% at 175 °C to 325 °C. When the reaction temperature was below 175 °C, the NO conversion decreased slightly as the GHSV was increased. The deNOx efficiency of the catalyst decreased at temperatures above 325 °C under different GHSV, but the overall rule was not shown. From the above experiments, it was revealed that FeOx(0.3)/β-MnO2(450 °C) catalyst had a certain tolerance to higher GHSV and lower reaction temperature, which was more favorable in practice.
000 h−1, the NO conversion rate of FeOx(0.3)/β-MnO2(450 °C) still reached 100% at 175 °C to 325 °C. When the reaction temperature was below 175 °C, the NO conversion decreased slightly as the GHSV was increased. The deNOx efficiency of the catalyst decreased at temperatures above 325 °C under different GHSV, but the overall rule was not shown. From the above experiments, it was revealed that FeOx(0.3)/β-MnO2(450 °C) catalyst had a certain tolerance to higher GHSV and lower reaction temperature, which was more favorable in practice.
![[thin space (1/6-em)]](https://www.rsc.org/images/entities/char_2009.gif) 000 h−1. When 200 ppm SO2 was passed to β-MnO2, the NOx conversion efficiency of β-MnO2 dropped to 48% within 5.5 h and then stabilized at 44%. Compared with the performance of β-MnO2(450 °C), the NO conversion rate of FeOx(0.3)/β-MnO2(450 °C) was reduced from 100% to 55% and stabilized at 53%. NO conversion without resume when SO2 introduction was turned off, this might be due to the deposition of ammonium sulfate/bisulfate on the catalyst surface and the blocking of the active sites of the NH3-SCR reaction.36 The NO conversion rate on the catalyst was maintained at 100% when 10 vol% H2O was passed into simulated gases, indicating that the catalyst had strong tolerance to H2O.37 When 200 ppm SO2 and 10 vol% H2O were simultaneously introduced into simulated gases, the NO conversion of the catalyst decreases to 52% and stabilized at 48%. Compared with 200 ppm SO2 alone, the NO conversion rate had only a 5% decrease after 5.5 h. It indicated that SO2 had a large effect on SCR activity and H2O had a negligible effect, the coexistence of SO2 and H2O could have a certain synergistic effect on SCR activity. Therefore, compared with β-MnO2, the doping of Fe effectively improved the SO2 resistance of the catalyst.38,39
000 h−1. When 200 ppm SO2 was passed to β-MnO2, the NOx conversion efficiency of β-MnO2 dropped to 48% within 5.5 h and then stabilized at 44%. Compared with the performance of β-MnO2(450 °C), the NO conversion rate of FeOx(0.3)/β-MnO2(450 °C) was reduced from 100% to 55% and stabilized at 53%. NO conversion without resume when SO2 introduction was turned off, this might be due to the deposition of ammonium sulfate/bisulfate on the catalyst surface and the blocking of the active sites of the NH3-SCR reaction.36 The NO conversion rate on the catalyst was maintained at 100% when 10 vol% H2O was passed into simulated gases, indicating that the catalyst had strong tolerance to H2O.37 When 200 ppm SO2 and 10 vol% H2O were simultaneously introduced into simulated gases, the NO conversion of the catalyst decreases to 52% and stabilized at 48%. Compared with 200 ppm SO2 alone, the NO conversion rate had only a 5% decrease after 5.5 h. It indicated that SO2 had a large effect on SCR activity and H2O had a negligible effect, the coexistence of SO2 and H2O could have a certain synergistic effect on SCR activity. Therefore, compared with β-MnO2, the doping of Fe effectively improved the SO2 resistance of the catalyst.38,39![[thin space (1/6-em)]](https://www.rsc.org/images/entities/char_2009.gif) 000 h−1, 500 ppm NO, 500 ppm NH3, 3 vol% O2, and Ar as balanced gas. As shown in Fig. 2c, the FeOx(0.3)/β-MnO2(450 °C) catalyst was consistently kept at 100% NOx conversion efficiency within 32 h. The results showed that FeOx(0.3)/β-MnO2(450 °C) catalyst had stable SCR performance and relatively high service life, which had certain practical application value.
000 h−1, 500 ppm NO, 500 ppm NH3, 3 vol% O2, and Ar as balanced gas. As shown in Fig. 2c, the FeOx(0.3)/β-MnO2(450 °C) catalyst was consistently kept at 100% NOx conversion efficiency within 32 h. The results showed that FeOx(0.3)/β-MnO2(450 °C) catalyst had stable SCR performance and relatively high service life, which had certain practical application value.3.2 Catalysts characterization
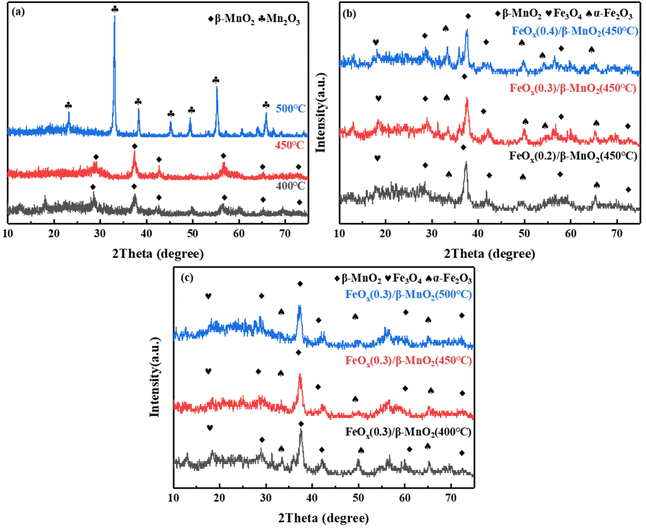 | ||
| Fig. 3 XRD patterns of (a) β-MnO2 at different calcination temperatures; (b) FeOx(n)/β-MnO2(450 °C) with different molar ratios of Fe/Mn; (c) FeOx(0.3)/β-MnO2 at different calcination temperatures. | ||
Ferric nitrate decomposes to FeOx at high temperatures, and its main components were α-Fe2O3 and Fe3O4 (Fig. 3b), the diffraction peaks of 2θ = 35.36° and 49.47° were attributed to Fe2O3, while 2θ = 18.29° was diffraction peak of Fe3O4.43 With the increase of the Fe/Mn molar ratio, the peak intensity of β-MnO2 decreased gradually. It indicated that the dispersion of β-MnO2 increased with increasing Fe loading and it combined more fully with FeOx, and favored by the formation of a large number of small particles of the active fraction, which promoted the fast SCR reaction.44 However, with the increase of Fe content, the diffraction peak of α-Fe2O3 increased relatively while that of Fe3O4 decreased. It could be due to the transformation of part of Fe3O4 to Fe2O3. The co-existence of Fe2+ and Fe3+ could form an imbalance unsaturated chemical bonds, which could increase the amount of chemisorbed oxygen on the surface and improve the catalytic performance of the catalyst.45 Combined with Fig. 1a and 3b, an appropriate Fe doping could produce tiny active particles and improve the catalytic activity, while excessive Fe doping was conducive to the formation of oxide masses, thus hindering the SCR reaction.46
The XRD diagrams of FeOx(0.3)/MnO2 at different calcination temperatures was shown in Fig. 3c. With the increasing of calcination temperature, the reflection peak intensity of MnO2 increased and then decreased, while the reflection peak intensity of FeOx gradually weakened. The intensity of the reflection peak of β-MnO2 was the largest when the calcination temperature was 450 °C. The intensity of FeOx reflection peak decreased, its dispersion increased and crystallinity became smaller, which was favorable to improve the catalytic performance.47 The peak at 2θ = 23.16° could be the reflection peak of Fe–Mn–Ox formed by the reaction.48 The formation of Fe–Mn–Ox complexes was beneficial to improve the deNOx performance of the catalyst.49 The efficiency of compound catalytic denitrification decreased at 500 °C due to the conversion of MnO2 to Mn2O3, which was not favorable for deNOx reaction.50
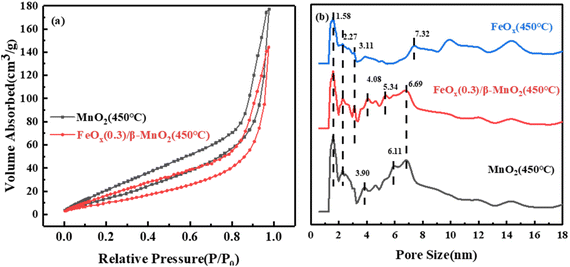
| Sample | Surface area/m2 g−1 | Total pore volume/10−2 cm3 g−1 | Average pore radius/nm |
|---|---|---|---|
| β-MnO2(450 °C) | 67.934 | 27.41 | 81.69 |
| FeOx(0.3)/β-MnO2(450 °C) | 45.905 | 22.31 | 97.22 |
| FeOx(450 °C) | 23.788 | 19.89 | 167.26 |
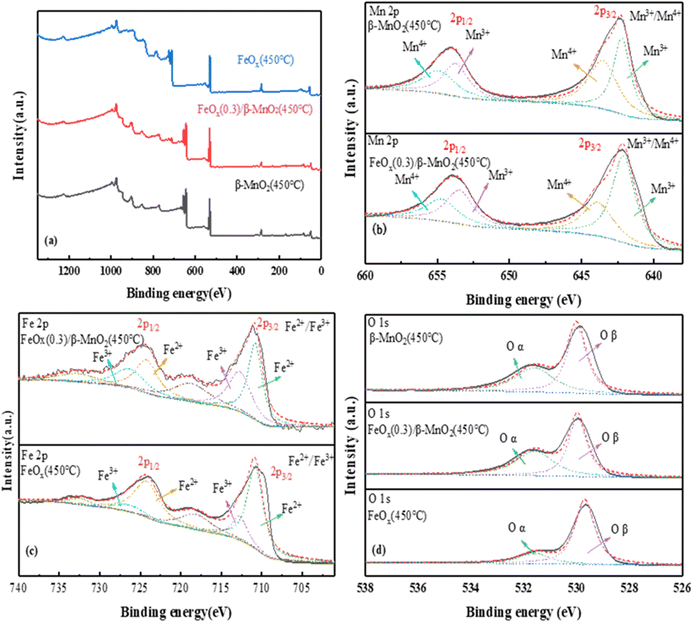 | ||
| Fig. 6 XPS spectra of (a) total spectrum, (b) Mn 2p, (c) Fe 2p, (d) O 1s of MnO2(450 °C), FeOx(0.3)/β-MnO2(450 °C), FeOx(450 °C). | ||
The photoelectron spectrum of Fe 2p in the catalyst was shown in Fig. 6c. The four main peaks were Fe3+ (710 eV and 724 eV) and Fe2+ (712.7 eV and 726.3 eV); the weak peak at 718 eV was probably a satellite peak of Fe 2p3/2 and the weak peak at 732.7 eV a satellite peak of Fe 2p1/2.60 The binding energies of 710.8 eV and 712.7 eV of Fe 2p3/2 and 724.2 eV and 726.3 eV of Fe 2p1/2 were attributed to Fe3+.61 The peak had a certain shift after the introduction of Fe, which may be the reaction of a small amount of Mn2+ with Fe3+ in the catalyst. The main reactions were: Fe3+ + Mn2+ → Fe2+ + Mn3+, Fe3+ + Mn3+ → Fe2+ + Mn4+. Mn3+ and Mn4+ had a great impact on the deNOx performance of the catalyst. Moreover, the higher the content of Mn3+ and Mn4+, the better the redox performance for the conversion of NO.45,62
O 1s of the catalyst (Fig. 6d) showed a single peak of low binding energy 529.87–530.12 eV corresponded to lattice oxygen (Oβ),63 the high binding energy of 531.55–531.73 eV was the oxygen (Oα) (Oα, mainly O2−, O22−).64 The Oα had higher electron mobility and better catalytic activity.65 Compared with the two raw materials, FeOx(0.3)/β-MnO2(450 °C) had the highest Oα content, indicating that it had better redox performance and higher activity. The addition of Fe increased lattice oxygen, improved oxygen vacancies, and enhanced the activity of surface oxygen, thereby contributed to NOx and the formation of nitrate/nitrite products. Thus, it could conducive to fast SCR reaction and improved the denitrification effect in low-temperature environments.
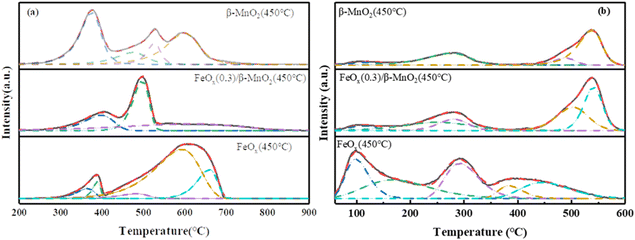 | ||
| Fig. 7 (a) H2-TPR and (b) NH3-TPD profiles of β-MnO2(450 °C), FeOx(0.3)/β-MnO2(450 °C), FeOx(450 °C). | ||
The reduction peak of MnO2 at 340–720 °C was mainly MnO2 → Mn2O3 → Mn3O4 → MnO, a series of Mn oxide transformations66 (Fig. 7a). The reduction peak of the FeOx sample at 388 °C corresponded to the reduction of Fe2O3 to Fe3O4, and the wide reduction peak at 450–850 °C was assigned to the process of Fe3O4 → FeO → Fe.67 The maximum peak area of the FeOx(0.3)/β-MnO2 sample was obtained at 488 °C, which indicated that the consumption of H2 of the catalyst sample was the largest at 488 °C. The main reaction at this temperature was the conversion of Mn oxide, which was the conversion of MnO2 to Mn2O3. FeOx(0.3)/β-MnO2 compared to the β-MnO2 sample had an earlier reduction peak position, lower reduction temperature, and larger peak value, which indicated that the addition of FeOx led to a stronger redox capacity of the catalyst.68 There were overlapping reduction peaks of Fe2O3 → Fe3O4 and MnO2 → Mn2O3 at about 375 °C. There were reduction peaks of Fe2O3 → Fe3O4 and MnO2 → Mn2O3 overlapping at about 375 °C. The reduction peaks at 450–600 °C were mainly Mn3O4 → MnO and Fe3O4 → FeO.28 The addition of FeOx made β-MnO2 have a stronger redox capacity, improved the oxygen storage capacity of the catalyst, and enhanced the activity of the catalyst.
The adsorption of NH3 at the acid site was a key step in the NH3-SCR reaction, the strength and density of the acid site closely affected the denitrification performance of the catalyst.69 The NH3-TPD spectral diagram of the sample (Fig. 7b) showed that the desorption peak around 110 °C was attributed to the physical adsorption of NH3.8 The desorption peaks at 160–220 °C and 200–350 °C could belong to NH4+ binding at the weak Brønsted acid site and NH4+ binding at strong the Brønsted acid site,70 respectively. 410–600 °C could be attributed to the adsorption of NH3 by strong Lewis acid site.71 The desorption peak of β-MnO2 samples was small in the range of 160–350 °C, and the absorption peak of FeOx(0.3)/β-MnO2 samples increased in the range of 150–350 °C, indicating that the doping of FeOx increased the Brønsted acid site on the catalyst surface. Brønsted acid sites could affect the low-temperature denitrification efficiency of the catalyst, and increased amount of Brønsted acid sites could enhance the adsorption of NH3, thus improving the low-temperature denitrification efficiency, which was consistent with the results of denitrification experiments.72 In addition, doping Fe oxide also expanded the desorption peak area of the sample, which increased the acid site on the sample surface and improved the adsorption capacity of the catalyst for NH3.73
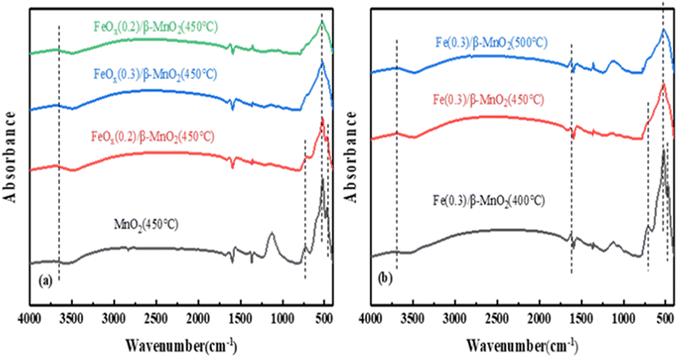 | ||
| Fig. 8 FTIR spectra of (a) FeOx/β-MnO2(450 °C) at different Fe/Mn molar ratios and (b) FeOx(0.3)/β-MnO2 at different calcination temperatures. | ||
Based on the above characterization analysis, the denitration mechanism of the catalyst could be Langmuir–Hinshelwood mechanism.78 The doping of Fe increased Brønsted acid sites on the catalyst surface, improved the redox ability,79 and improved the deNOx performance of the composite catalyst.
4. Conclusion
FeOx/β-MnO2 composite catalyst were prepared with impregnation method by using β-MnO2 as the carrier and FeOx in mixed valence state as the modified additive. The results showed that the FeOx/β-MnO2 composite catalyst with Fe/Mn molar ratio of 0.3 and calcination temperature of 450 °C had an excellent low-temperature activity, a superior resistance to H2O and good resistance to SO2 compared with β-MnO2. When NO initial concentration of 500 ppm, a gas hourly space velocity of 45![[thin space (1/6-em)]](https://www.rsc.org/images/entities/char_2009.gif) 000 h−1, and a reaction temperature of 175–325 °C, NO conversion efficiency could reach 100%. Adding an appropriate amount of FeOx could improve the valence distribution of Mn and Fe, increased the number of acid sites, and enhanced the redox ability of the composite catalyst.
000 h−1, and a reaction temperature of 175–325 °C, NO conversion efficiency could reach 100%. Adding an appropriate amount of FeOx could improve the valence distribution of Mn and Fe, increased the number of acid sites, and enhanced the redox ability of the composite catalyst.
Author contributions
Bo Du: investigation, conceptualization, methodology, data curation, formal analysis, visualization, writing – original draft. Yuting Hu: investigation, data curation, Ting Cheng: methodology, formal analysis. Zhaozhong Jiang: investigation, visualization. Zhenzhen Wang: validation, methodology. Chengzhu Zhu: supervision, methodology, conceptualization, validation, resources, writing – review & editing, project administration.Conflicts of interest
The authors declared that they have no conflicts of interest to this work.Acknowledgements
The authors thank for the financial support from Hefei Key Generic Technology Research and Development Projects (2021GJ064) and the Major Science and Technology Projects of Anhui Province of China (201903b06020016) for the support of this study.References
- Z. Si, D. Weng, X. Wu, G. Li and J. Li, Sci. Technol. Rev., 2009, 27, 87–95 CAS.
- A. M. Mocioiu, D. I. Baila, C. I. Codrea and O. C. Mocioiu, Inorganics, 2022, 10, 10040044 Search PubMed.
- Y. J. Zhang, M. M. Cheng, J. Gao and J. L. Li, J. Environ. Sci., 2023, 123, 545–559 CrossRef.
- R. Balasubramanian, X. Gao, S. R. Hatakeyama, J. H. Hwang and C. J. Tsai, Aerosol Air Qual. Res., 2017, 17, 351–355 CrossRef.
- H. Q. Wang, J. T. Zhou, X. Li, Q. Ling, H. Y. Wei, L. Gao, Y. He, M. Zhu, X. Xiao, Y. J. Liu, S. Li, C. L. Chen, G. T. Duan, Z. M. Peng, P. L. Zhou, Y. F. Duan, J. B. Wang, T. Z. Yu, Y. X. Yang, J. G. Wang, Z. Zhou, H. Q. Gui and Y. J. Ding, J. Environ. Sci., 2023, 123, 367–386 CrossRef.
- H. Y. Liang, X. Zhou, Y. Q. Zhu, D. W. Li, D. R. Jing, X. L. Su, P. H. Pan, H. Liu and Y. Zhang, Environ. Res., 2023, 218, 114996 CrossRef CAS.
- X. F. Wang, Y. Xu, M. Y. Qin, Z. Zhao, X. F. Fan and Q. B. Li, J. Colloid Interface Sci., 2022, 622, 1–10 CrossRef CAS.
- H. M. Zhou, L. L. Qian, T. Cheng, B. Du, F. J. Xia and C. Z. Zhu, J. Chem., 2022, 2022, 5049161 Search PubMed.
- Y. Wu, S. J. Zhang, J. M. Hao, H. Liu, X. M. Wu, J. N. Hu, M. P. Walsh, T. J. Wallington, K. M. Zhang and S. Stevanovic, Sci. Total Environ., 2017, 574, 332–349 CrossRef CAS.
- X. X. Hou, H. P. Chen, Y. H. Liang, X. Yang and Y. L. Wei, Catal. Lett., 2020, 150, 1041–1048 CrossRef CAS.
- A. A. S. Goncalves, F. Ciesielczyk, B. Samojeden and M. Jaroniec, J. Hazard. Mater., 2021, 401, 123413 CrossRef CAS.
- Z. W. Shi, Q. G. Peng, J. Q. E, B. Xie, J. Wei, R. X. Yin and G. Fu, Fuel, 2023, 331, 125885 CrossRef CAS.
- W. J. Liu, Y. F. Long, S. N. Liu, Y. Y. Zhou, X. Tong, Y. J. Yin, X. Y. Li, K. Hu and J. J. Hu, J. Taiwan Inst. Chem. Eng., 2022, 138, 104472 CrossRef CAS.
- Z. W. Zheng, X. S. Du, X. Wang, Y. G. Liu, K. L. Chen, P. Lu, V. Rac and V. Rakic, Fuel, 2023, 333, 126443 CrossRef CAS.
- X. F. Wang, Z. Zhao, Y. Xu and Q. B. Li, Appl. Surf. Sci., 2021, 569, 151047 CrossRef CAS.
- H. J. Chen, R. Wang, Y. L. Yang, X. L. Shi, S. Y. Lu and Z. G. Chen, Prog. Nat. Sci.: Mater. Int., 2021, 31, 858–864 CrossRef CAS.
- G. Y. Xu, X. L. Guo, X. X. Cheng, J. Yu and B. Z. Fang, Nanoscale, 2021, 13, 7052–7080 RSC.
- F. Kapteijn, L. Singoredjo, A. Andreini and J. Moulijn, Appl. Catal., B, 1994, 3, 173–189 CrossRef CAS.
- H. Meng, X. Wu, C. Ci, Q. Zhang and Z. Li, Prog. React. Kinet. Mech., 2018, 43, 219–228 CrossRef CAS.
- R. Yang, S. Peng, B. Lan, M. Sun, Z. Zhou, C. Sun, Z. Gao, G. Xing and L. Yu, Small, 2021, 17, 2102408 CrossRef CAS.
- C. M. Li, X. L. Zhang, Y. J. Li, L. X. Sun, L. Huangfu, J. L. Li, S. Q. Gao and J. Yu, Fuel, 2023, 334, 126590 CrossRef CAS.
- L. J. Jiang, Y. Liang, W. Z. Liu, H. L. Wu, T. Aldahri, D. S. Carrero and Q. C. Liu, J. Environ. Chem. Eng., 2021, 9, 106360 CrossRef CAS.
- S. Y. Xu, L. T. Yin, H. M. Wang, L. Y. Gao, X. Y. Tian, J. J. Chen, Q. L. Zhang and P. Ning, Sep. Purif. Technol., 2022, 300, 121824 CrossRef CAS.
- V. Zabihi, M. H. Eikani, M. Ardjmand, S. M. Latifi and A. Salehirad, Environ. Sci. Pollut. Res., 2021, 28, 39159–39167 CrossRef CAS.
- A. Xie, Y. Tao, X. Jin, P. Gu, X. Huang, X. Zhou, S. Luo, C. Yao and X. Li, New J. Chem., 2019, 43, 2490–2500 RSC.
- L. Qiu, D. K. Li, H. L. Li, Z. Y. Ren, Z. Y. Zhu, F. Ouyang and M. X. Guo, Chemosphere, 2022, 302, 134740 CrossRef CAS.
- X. Wang and Y. Li, J. Am. Chem. Soc., 2002, 124, 2880–2881 CrossRef CAS.
- T. Wang, Z. T. Wan, X. C. Yang, X. Y. Zhang, X. X. Niu and B. M. Sun, Fuel Process. Technol., 2018, 169, 112–121 CrossRef CAS.
- L. L. Li, J. W. Ji, W. Tan, W. Song, X. Wang, X. Q. Wei, K. Guo, W. Y. Zhang, C. J. Tang and L. Dong, J. Rare Earths, 2022, 40, 1454–1461 CrossRef CAS.
- K. Zhang, J. J. Wang, P. F. Guan, N. Li, Z. J. Gong, R. Zhao, H. J. Luo and W. F. Wu, Mater. Res. Bull., 2020, 128, 110871 CrossRef CAS.
- L. T. Xu, S. L. Niu, C. M. Lu, Q. Zhang and J. Li, Fuel, 2018, 219, 248–258 CrossRef CAS.
- A. I. Mytareva, D. A. Bokarev, D. S. Krivoruchenko, G. N. Baeva, A. Y. Belyankin and A. Y. Stakheev, Top. Catal., 2019, 62, 86–92 CrossRef CAS.
- Y. Jiang, G. Cheng, R. N. Yang, H. F. Liu, M. Sun, L. Yu and Z. F. Hao, J. Solid State Chem., 2019, 272, 173–181 CrossRef CAS.
- X. N. Huang, Y. F. Duan, J. L. Meng, X. Wu, W. M. Zhao, P. Hu, C. Zhu, H. Q. Wei and Y. G. Ma, Asia-Pac. J. Chem. Eng., 2021, 16, e2587 CAS.
- K. J. Lee, P. A. Kumar, M. S. Maqbool, K. N. Rao, K. H. Song and H. P. Ha, Appl. Catal., B, 2013, 142, 705–717 CrossRef.
- S. P. Ding, F. D. Liu, X. Y. Shi, K. Liu, Z. H. Lian, L. J. Xie and H. He, ACS Appl. Mater. Interfaces, 2015, 7, 9497–9506 CrossRef CAS.
- C. Z. Wang, Y. G. Zhao, C. Zhang, X. Yan and P. Cao, Res. Chem. Intermed., 2018, 44, 3135–3150 CrossRef CAS.
- G. S. Qi and R. T. Yang, Appl. Catal., B, 2003, 44, 217–225 CrossRef CAS.
- Y. F. Liu, B. Z. Zhu, J. Y. Chen, Y. L. Sun and M. G. Xu, J. Mater. Sci., 2022, 57, 18468–18485 CrossRef CAS.
- Z. H. Ji, D. Dong, H. L. Guo, Y. M. Chai, Y. P. Li, Y. Q. Liu and C. G. Liu, Mater. Chem. Phys., 2012, 136, 831–836 CrossRef CAS.
- P. M. Kharade, S. B. Kulkarni and D. J. Salunkhe, Chin. J. Phys., 2017, 55, 1684–1689 CrossRef CAS.
- A. C. Zhang, Z. H. Zhang, J. J. Chen, W. Sheng, L. S. Sun and J. Xiang, Fuel Process. Technol., 2015, 135, 25–33 CrossRef CAS.
- C. Yang, J. Yang, Q. R. Jiao, Y. M. Tian, Q. C. Liu, S. Ren and J. L. Li, San Diego, CA, 2020.
- R. P. Velez, I. Ellmers, H. M. Huang, U. Bentrup, V. Schunemann, W. Grunert and A. Bruckner, J. Catal., 2014, 316, 103–111 CrossRef.
- X. L. Tang, C. Z. Wang, F. Y. Gao, Y. L. Ma, H. H. Yi, S. Z. Zhao and Y. S. Zhou, J. Environ. Chem. Eng., 2020, 8, 104399 CrossRef CAS.
- M. Schwidder, S. Heikens, A. De Toni, S. Geisler, M. Berndt, A. Bruckner and W. Grunert, J. Catal., 2008, 259, 96–103 CrossRef CAS.
- J. H. Kwak, R. G. Tonkyn, D. H. Kim, J. Szanyi and C. H. F. Peden, J. Catal., 2010, 275, 187–190 CrossRef CAS.
- A. Cetin, A. M. Onal and E. N. Esenturk, J. Mater. Res., 2019, 34, 3231–3239 CrossRef CAS.
- F. T. Xia, Z. X. Song, X. Liu, X. Liu, Y. H. Yang, Q. L. Zhang and J. H. Peng, Res. Chem. Intermed., 2018, 44, 2703–2717 CrossRef CAS.
- D. H. Wang, H. Li, N. Dong and S. E. Hui, J. Environ. Eng., 2021, 147, 04021039 CrossRef CAS.
- S. Z. Xie, L. L. Li, L. J. Jin, Y. H. Wu, H. Liu, Q. J. Qin, X. L. Wei, J. X. Liu, L. H. Dong and B. Li, Appl. Surf. Sci., 2020, 515, 146014 CrossRef CAS.
- L. Xu, S. Niu, C. Lu, Q. Zhang and J. Li, Fuel, 2018, 219, 248–258 CrossRef CAS.
- S. Yin, B. Zhu, Y. Sun, Z. Zi, Q. Fang, G. Li, C. Chen, T. Xu and J. Li, Asia-Pac. J. Chem. Eng., 2018, 13, e2231 CrossRef.
- Y. Tian and J. Z. Wu, AIChE J., 2018, 64, 286–293 CrossRef CAS.
- M. Thommes, K. Kaneko, A. V. Neimark, J. P. Olivier, F. Rodriguez-Reinoso, J. Rouquerol and K. S. W. Sing, Pure Appl. Chem., 2015, 87, 1051–1069 CrossRef CAS.
- Z. Q. Gong, S. L. Niu, Y. J. Zhang and C. M. Lu, Mater. Res. Bull., 2020, 123, 110693 CrossRef CAS.
- A. K. Worku, D. W. Ayele and N. G. Habtu, Mater. Today Adv., 2021, 9, 100116 CrossRef CAS.
- S. J. Yang, C. Z. Wang, J. H. Li, N. Q. Yan, L. Ma and H. Z. Chang, Appl. Catal., B, 2011, 110, 71–80 CrossRef CAS.
- L. H. Wei, X. Y. Li, J. C. Mu, X. Y. Wang, S. Y. Fan, Z. F. Yin, M. O. Tad and S. M. Liu, ACS Sustainable Chem. Eng., 2020, 8, 17727–17739 CrossRef CAS.
- J. X. Sun, H. Chen, H. Wu, C. S. Zhou and H. M. Yang, Can. J. Chem. Eng., 2019, 97, 2498–2504 CrossRef CAS.
- W. Ahn, M. G. Park, D. U. Lee, M. H. Seo, G. P. Jiang, Z. P. Cano, F. M. Hassan and Z. W. Chen, Adv. Funct. Mater., 2018, 28, 1802129 CrossRef.
- Z. J. Zhou, X. W. Liu, C. P. Li, Y. D. Yang, J. Xu and M. H. Xu, Fuel, 2020, 277, 118230 CrossRef CAS.
- M. Y. Qiu, S. H. Zhan, H. B. Yu, D. D. Zhu and S. Q. Wang, Nanoscale, 2015, 7, 2568–2577 RSC.
- X. M. Zhou, X. Y. Huang, A. J. Xie, S. P. Luo, C. Yao, X. Z. Li and S. X. Zuo, Chem. Eng. J., 2017, 326, 1074–1085 CrossRef CAS.
- D. H. Wang, Q. Yao, C. H. Mou, S. E. Hui and Y. Q. Niu, Fuel, 2019, 254, 115719 CrossRef CAS.
- X. B. Wang, J. Zhou, T. Zhao, K. T. Gui, J. Wang and H. R. Thomas, J. Environ. Sci., 2020, 88, 237–247 CrossRef CAS.
- N. S. Portillo-Velez and R. Zanella, Chem. Eng. J., 2020, 385, 123848 CrossRef CAS.
- X. Fang, Y. J. Liu, L. Z. Chen and Y. Cheng, Chem. Eng. J., 2020, 399, 125798 CrossRef CAS.
- X. Wu, H. Meng, Y. L. Du, J. N. Liu, B. H. Hou and X. M. Xie, J. Catal., 2020, 384, 72–87 CrossRef CAS.
- M. Hosseinpour, M. Akizuki, A. Yoko, Y. Oshima and M. Soltani, Microporous Mesoporous Mater., 2020, 292, 109708 CrossRef CAS.
- S. Yan, G. Ying, S. Wei and W. Yajuan, Trans. Tianjin Univ., 2017, 23, 35–42 CrossRef.
- S. G. Zhang, C. Zhang, Q. Wang and W. S. Ahn, Ind. Eng. Chem. Res., 2019, 58, 22857–22865 CrossRef CAS.
- T. Wang, X. Y. Zhang, J. Liu, H. Z. Liu, Y. H. Guo and B. M. Sun, Fuel Process. Technol., 2018, 178, 53–61 CrossRef CAS.
- M. N. Uddin, G. C. Saha, M. A. Hasanath, M. T. Rahman and M. M. Rashid, Advances in Civil Engineering: Select Proceedings of ICACE 2020. Lecture Notes in Civil Engineering, edn 184, 2022, pp. 45–54, DOI:10.1007/978-981-16-5547-0_5.
- A. Rai and A. K. Thakur, Ceram. Int., 2017, 43, 13828–13838 CrossRef CAS.
- S. Rada, A. Dehelean, M. Culea and E. Cule, Spectrochim. Acta, Part A, 2011, 79, 320–324 CrossRef CAS.
- G. S. Qi, J. E. Gatt and R. T. Yang, J. Catal., 2004, 226, 120–128 CrossRef CAS.
- C. G. Zhang, T. H. Chen, H. B. Liu, D. Chen, B. Xu and C. S. Qing, Appl. Surf. Sci., 2018, 457, 1116–1125 CrossRef CAS.
- B. Z. Zhu, Q. L. Fang, Y. L. Sun, S. L. Yin, G. B. Li, Z. H. Zi, T. T. Ge, Z. C. Zhu, M. X. Zhang and J. X. Li, J. Mater. Sci., 2018, 53, 11500–11511 CrossRef CAS.
| This journal is © The Royal Society of Chemistry 2023 |

