
 Open Access Article
 This Open Access Article is licensed under a Creative Commons Attribution-Non Commercial 3.0 Unported Licence
Tetracycline degradation mechanism of peroxymonosulfate activated by oxygen-doped carbon nitride†
Liquan Wangab,
Ruyi Lia,
Yimin Zhang *ab,
Yuexiang Gaoa,
Xian Xiaob,
Zhiwei Zhanga,
Ting Chena and
Yuan Zhao*b
*ab,
Yuexiang Gaoa,
Xian Xiaob,
Zhiwei Zhanga,
Ting Chena and
Yuan Zhao*b
aNanjing Institute of Environmental Sciences, Ministry of Ecology and Environment, Nanjing 210042, China. E-mail: zhangymzym@163.com; Tel: +86 13951930765
bSchool of Environmental Science and Engineering, Changzhou University, Changzhou 213164, China. E-mail: zhaoyuan@cczu.edu.cn; Tel: +86 15961238081
First published on 22nd February 2023
Abstract
In this study, oxygen-doped carbon nitride (O–C3N4) was prepared by thermal polymerization and was applied to activate peroxymonosulfate (PMS) for tetracycline (TC) degradation. Experiments were performed to comprehensively evaluate the degradation performance and mechanism. The oxygen atom replaced the nitrogen atom of the triazine structure, which improves the specific surface area of the catalyst, enriches the pore structure and achieves higher electron transport capacity. The characterization results showed that 0.4 O–C3N4 had the best physicochemical properties, and the degradation experiments showed that the 0.4 O–C3N4/PMS system had a higher TC removal rate in 120 min (89.94%) than the unmodified graphitic-phase C3N4/PMS system (52.04%). Cycling experiments showed that O–C3N4 has good reusability and structural stability. Free radical quenching experiments showed that the O–C3N4/PMS system had free radical and non-radical pathways for TC degradation and that the main active species was singlet oxygen (1O2). Intermediate product analysis showed that TC was mineralized to H2O and CO2 mainly by the ring opening, deamination, and demethylation reactions. The results of this study show that the 0.4 O–C3N4/PMS system is simple to prepare and is efficient at removing TC from contaminated water.
1. Introduction
Tetracycline (TC) is a widely prescribed antibiotic because of its low cost and broad-spectrum antimicrobial effect.1,2 However, it is difficult for humans and animals to digest and absorb, thus it is eventually excreted into water bodies in urine and feces. The long-term accumulation of antibiotics in water bodies can cause pathogenic microorganisms to build resistance to them, which poses a serious threat to human health.3 Therefore, TC degradation from water bodies is a significant issue. An approach that has received increasing research attention is the advanced oxidation of persulfates based on sulfate radicals (SO4˙−) and hydroxyl radicals (·OH).4–6 Compared to ·OH (oxidation–reduction potential (OPR): 1.8–2.7 eV), SO4˙− (OPR: 2.5–3.1 eV) has a higher oxidation capacity, greater oxidation selectivity, and applicability to a wider pH range.7 Therefore, researchers generally agree that SO4˙− is more likely to substitute for ·OH than vice versa.8 Peroxysulfates include peroxymonosulfate (PMS) and peroxydisulfate (PDS), of which PMS is preferred for advanced oxidation due to its asymmetric molecular structure and easy decomposition.9 Common ways to activate persulfates to produce radicals such as SO4˙− and ·OH include heat, alkali, UV radiation, and transition metals. However, these methods have disadvantages that limit their applicability, such as excessive energy input, high processing costs, and ion precipitation.8,10–12 Therefore, a low-cost and high-efficiency catalyst for activating persulfates is urgently needed.Graphitic-phase carbon nitride (g-C3N4) is a widely used nonmetallic polymer because of its low synthetic costs and high chemical stability.13–15 However, the thick lamellar structure and small specific area of g-C3N4 make it non-ideal for activating PMS.15,16 The catalytic performance of carbon-based materials can be improved by nitrogen doping17 because the nitrogen atom has one more valence electron than the carbon atom, which makes it more electronegative. However, the longevity of nitrogen-doped carbon-based materials needs to be improved.18 In turn, oxygen is more electronegative than nitrogen, and recent studies have shown that the electronic structure of g-C3N4 can be doped with oxygen atoms to improve its catalytic properties.18,19 In particular, PMS activated by oxygen-doped carbon nitride (O–C3N4) has been shown to achieve efficient degradation of bisphenol A18 and sulfamethoxazole (SMX).20 These studies suggest that doping g-C3N4 with oxygen atoms can significantly improve its catalytic performance for PMS. However, the activation mechanism and degradation pathway of organic pollutants need further investigation.
The objective of this study was to evaluate O–C3N4 as a low-cost and high-efficiency catalyst for TC degradation by activated PMS. The catalyst dosage, PMS dosage, pH, reaction temperature (T), and initial TC concentration were evaluated for their effects on the TC degradation performance of the O–C3N4/PMS system. The results were analyzed to clarify the TC degradation mechanism of the O–C3N4/PMS system and possible degradation pathways.
2. Materials and methods
2.1 Chemical reagents
TC and p-benzoquinone (99% BQ) were purchased from Shanghai Maclean Biochemical Technology Company. Potassium peroxymonosulfate compound salt (≥42% PMS) was purchased from Shanghai Aladdin Biochemical Technology Company. Other reagents such as urea, oxalic acid dihydrate, sodium hydroxide, sulfuric acid, sodium chloride, sodium carbonate, sodium bicarbonate, tert-butyl alcohol (TBA), methanol (MeOH), p-benzoquinone (BQ), furfuryl alcohol (FFA), and ethanol were all purchased analytically pure from Sinopharm Chemical Reagent Co. The water used in the experiments was deionized water.2.2 Synthesis of catalysts
As reported in the literature,18 O–C3N4 was prepared by high-temperature thermal polymerization using oxalic acid dihydrate as the oxygen source and urea as the g-C3N4 precursor. Specifically, a certain mass of oxalic acid dihydrate and 10 g of urea were placed in an onyx mortar and were ground for 10 min to make the mixture homogeneous. Then, the ground mixture was transferred to a ceramic crucible with a lid and was heated up to 550 °C at 4 °C min−1 in a muffle furnace for 4 h. After the reaction was completed, the product was cooled to room temperature and was calcined by grinding in an onyx mortar to a powder. This resulted in xO–C3N4 catalysts, where x is the mass ratio of oxalic acid dihydrate to urea (x = 0, 0.1, 0.2, 0.4, 0.8). Note that not adding oxalic acid dehydrate (i.e., x = 0) resulted in g-C3N4.2.3 Tetracycline degradation experiments
TC degradation experiments were performed in a 250 mL beaker containing 100 mL of solution and a magnetic stirrer under the conditions of T = 26.0 ± 0.5 °C and initial pH = 5.7. At the beginning of the experiment, 4 mM PMS and 0.2 g L−1 of a catalyst were added sequentially. Samples were taken at set time intervals (t = 10, 20, 40, 60, 90, and 120 min) by using a 5 mL disposable syringe and were immediately filtered through a 0.22 μm syringe membrane. Then, their absorbance at a wavelength of 357 nm was measured. To investigate the effects of the pH, T, catalyst dosage, PMS dosage, initial TC concentration, and common inorganic ions (i.e., chloride ion, bicarbonate ion, and carbonate ion) on TC degradation, the experimental conditions were adjusted. The initial pH was adjusted by using 0.1 M NaOH and H2SO4, and the other influencing factors were adjusted as appropriate. To ensure the reproducibility of the catalyst synthetic process, the beakers were rinsed with deionized water after each experiment. The rinsing solution and experimental solution were collected. Then, the catalysts were centrifuged and collected by vacuum filtration, after which they were dried in an oven for subsequent experiments. All experiments were set up in triplicate.2.4 Characterization methods
The morphology of the catalysts was characterized by scanning electron microscopy (SEM, Hitachi SU8010). The crystal structure of the catalysts was analyzed by X-ray diffraction (XRD, Smartlab 9). The adsorption–desorption isotherm curve of the catalysts was measured by automatic specific surface area adsorption (BET, ASAP2460), which was used to analyze the specific surface area, total pore volume, and pore size distribution. The surface functional groups of the catalysts were characterized by Fourier transform infrared spectroscopy (FT-IR, Thermo Scientific Nicolet iS5). The elemental composition, electronic valence, and relative content of the catalysts were analyzed by X-ray photoelectron spectroscopy (XPS, Thermo Scientific K-Alpha). The absorbance of contaminants in the system was measured by using an ultraviolet-visible spectrophotometer (UV2700, Shimadzu). The total organic carbon (TOC) in the solution was measured by using a TOC analyzer (TOL-L, Shimadzu) to evaluate the mineralization of the reaction system. The active species in the reaction system were identified by using an electron paramagnetic resonance spectrometer (EPR, A300). The intermediate products of TC degradation in the reaction system were characterized by using liquid chromatography-mass spectrometry (LC-MS, Agilent 1100 + thermos TSQ Quantum Ultra AM).The TC removal rate of the reaction system was calculated by
| Removal rate% = (C0 − Ct)/C0 × 100% | (1) |
| ln(Ct/C0) = −kt | (2) |
3. Results and discussion
3.1 Characterization of materials
The SEM and energy dispersive spectroscopy results showed that the unmodified g-C3N4 had an obvious lamellar structure (Fig. 1(a)) and smooth surface at a 300 nm resolution (Fig. 1(c)). O–C3N4 showed a porous structure and local agglomeration (Fig. 1(b)) with an obviously porous surface at a 300 nm resolution (Fig. 1(d)). This was consistent with previously reported findings.18 As presented in Fig. 1 and ESI Table 1,† the main elements of g-C3N4 and O–C3N4 were C, N, and O. O–C3N4 had significantly higher oxygen content than g-C3N4, which tentatively proved that the oxygen doping was successful.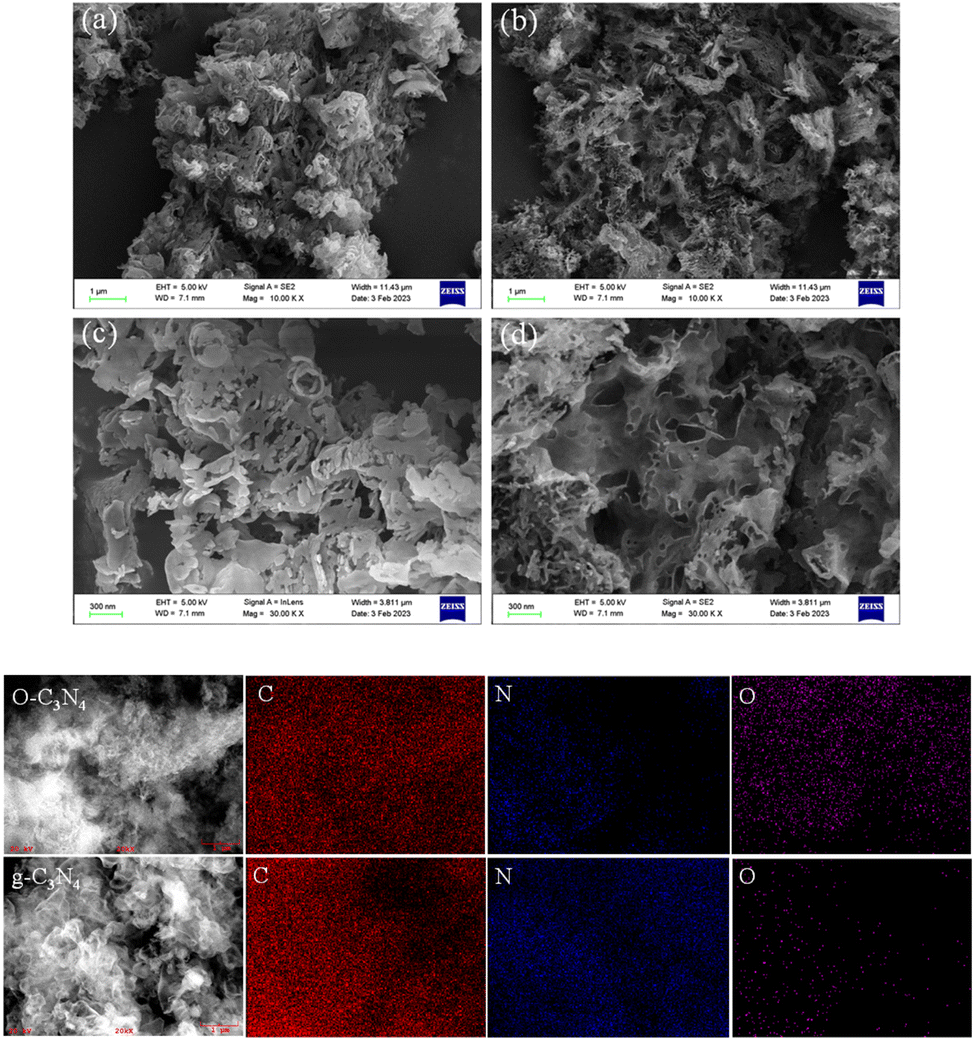 | ||
| Fig. 1 SEM images and mapping of g-C3N4 and O–C3N4. ((a) and (c) g-C3N4 (b) and (d) O–C3N4). | ||
Fig. 2(a) showed the XRD characterization of the crystal structure, which indicated that the two diffraction peaks at 13.2° and 27.5° for g-C3N4 can be attributed to the (100) and (002) crystal planes, respectively.21 In contrast, the diffraction peaks of O–C3N4 at the (100) and (002) crystal planes were broader with decreased intensity, which may be caused by the oxygen doping stacking filled monolayers.19 According to Scherrer's formula, the decrease in the diffraction angle at the (002) crystal plane indicated an increase in the interlayer distance for O–C3N4. The changes in the diffraction peaks of g-C3N4 and O–C3N4 showed that oxygen doping changed the g-C3N4 morphology, which was consistent with the SEM results.
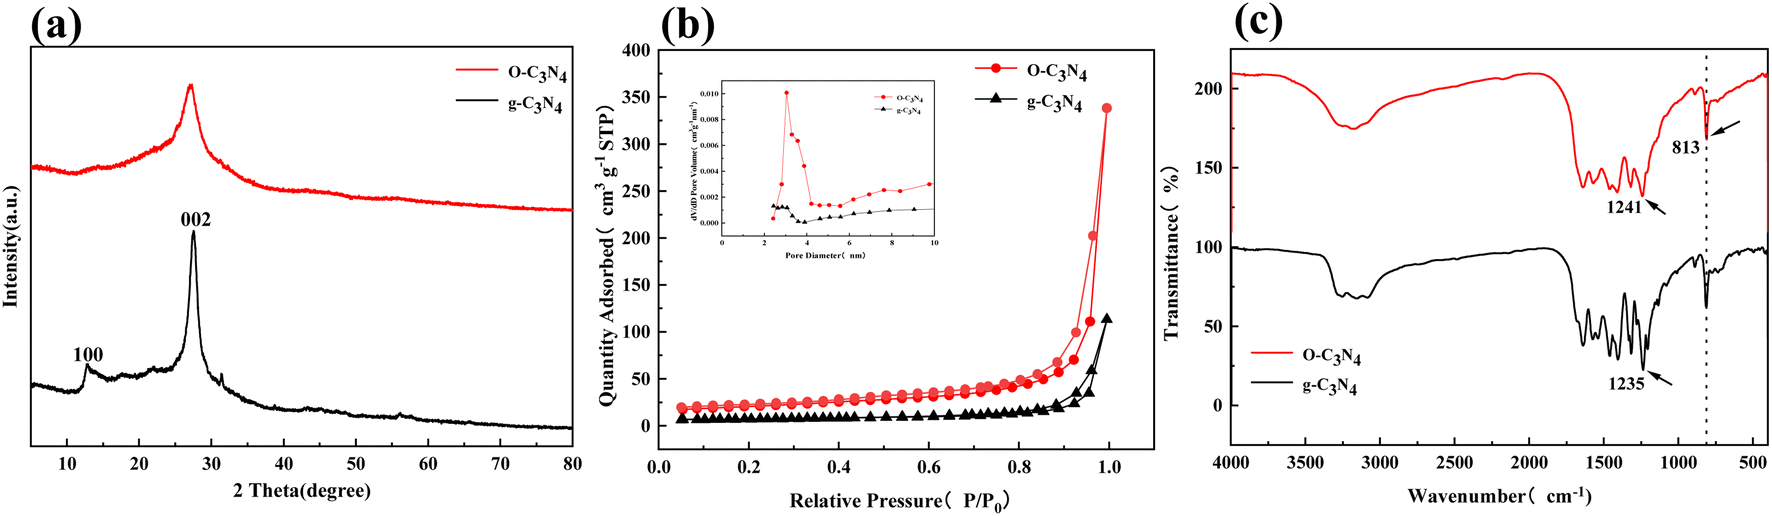 | ||
| Fig. 2 XRD, N2 adsorption–desorption curves, FT-IR results for g-C3N4 and O–C3N4. (a) XRD, (b) BET, (c) FT-IR. | ||
Fig. 2(b) presented the nitrogen adsorption–desorption isotherms of O–C3N4 and g-C3N4 and the corresponding pore size distribution (inset). O–C3N4 had a typical class IV curve, and the adsorption and desorption curves did not overlap, which indicates the presence of mesopores. This was confirmed by the pore size distribution. Table 1 indicated that O–C3N4 had a significantly greater specific surface area and pore volume than g-C3N4, with both parameters showing a threefold increase. This indicated that more TC and PMS can be efficiently delivered to the active sites of O–C3N4.
| Sample name | BET surface area (m2 g−1) | Average pore size (nm) | Pore volume (cm3 g−1) |
|---|---|---|---|
| O–C3N4 | 69.0007 | 13.2931 | 0.1588 |
| g-C3N4 | 23.3917 | 15.9946 | 0.0473 |
Fig. 2(c) showed the FT-IR results, which were used to identify functional groups on the catalyst surfaces. The FT-IR spectra of O–C3N4 and g-C3N4 revealed similar characteristic peaks, which indicated that the oxygen doping did not change the skeletal structure of g-C3N4. The characteristic peak of g-C3N4 at a wavenumber of 813 cm−1 can be attributed to the triazine structural unit.22 The characteristic peak at the same wavenumber for O–C3N4 can be attributed to the weakened interaction caused by oxygen atoms substituting for nitrogen atoms.23 The peak of g-C3N4 at 1235 cm−1 can be attributed to the C–N bond. The same peak for O–C3N4 was shifted to a higher wavenumber of 1241 cm−1 because of the higher electronegativity of oxygen,18 which generated a partial conversion of the C–N bond to a C–O bond. The oxygen doping did not bring about significant peaks of the –OH and –C–O functional groups for O–C3N4 compared to g-C3N4. This indicated that the oxygen doping did not cause surface oxygen to form on the g-C3N4 surface,20 which further suggested that the oxygen doping inserted oxygen atoms into the carbon skeleton of g-C3N4.
The XPS results showed that O–C3N4 and g-C3N4 comprise the elements of carbon, nitrogen, and oxygen (ESI Fig. 1†). In particular, O–C3N4 comprised 43.24% carbon, 53.67% nitrogen, and 3.09% oxygen, and g-C3N4 comprised 42.33% carbon, 56.18% nitrogen, and 1.19% oxygen. The carbon percentage did not change significantly before and after modification while the nitrogen percentage decreased and the oxygen percentage increased. This implied that the oxygen atoms successfully modified g-C3N4 by replacing nitrogen atoms during the thermal polymerization, which was consistent with the FT-IR results.
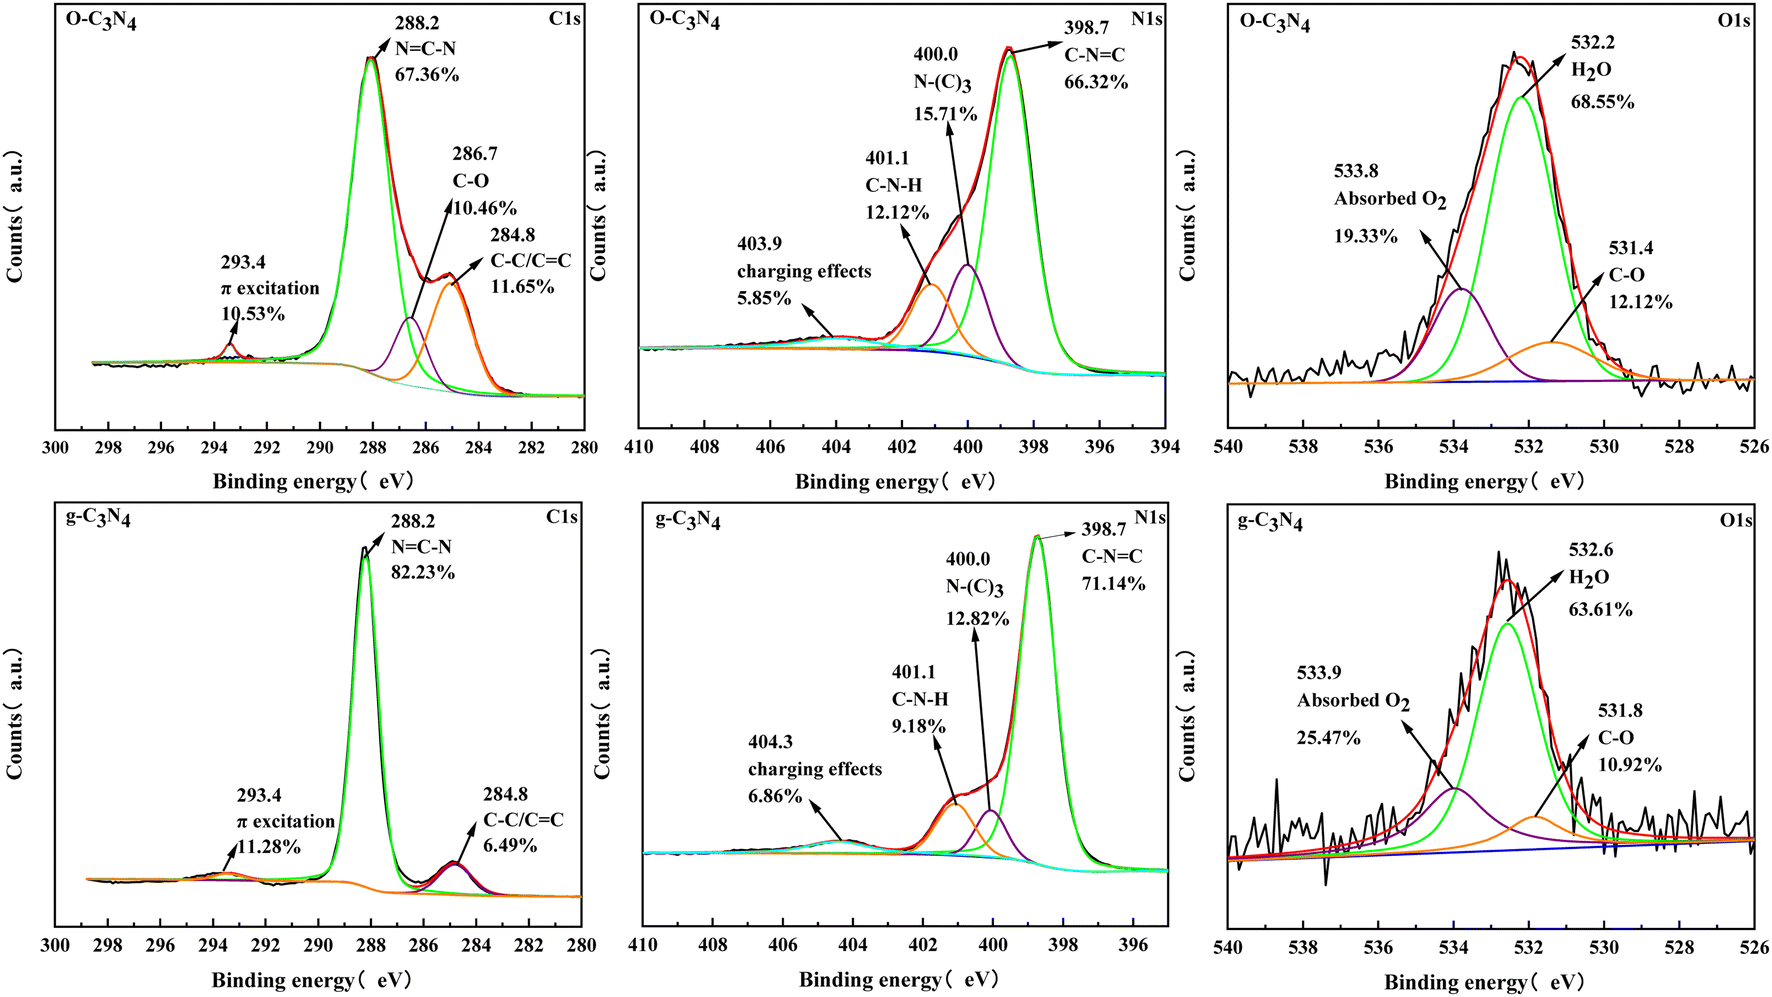
Fig. 3 showed the high-resolution spectra of C1s, N1s, and O1s. Three peak positions appeared in the C1s spectrum for g-C3N4, which correspond to π-electron excitation, N![[double bond, length as m-dash]](https://www.rsc.org/images/entities/char_e001.gif) C–N, and C–C/CC. Meanwhile, a new peak position (286.7 eV) appeared in the C1s spectrum for O–C3N4, which corresponds to C–O.24 The N1s spectra presented four peak positions corresponding to the charged effect of the heptazine ring, C–N–H, N–(C)3, and C–NC.25 The C–NC percentage was lower in O–C3N4 (66.32%) than in g-C3N4 (71.14%). The O1s spectra showed three peak positions corresponding to surface-adsorbed oxygen molecules, water molecules, and C–O.26 The XPS results showed that C–O appeared after modification, which indicated that oxygen atoms replaced nitrogen atoms during thermal polymerization.
C–N, and C–C/CC. Meanwhile, a new peak position (286.7 eV) appeared in the C1s spectrum for O–C3N4, which corresponds to C–O.24 The N1s spectra presented four peak positions corresponding to the charged effect of the heptazine ring, C–N–H, N–(C)3, and C–NC.25 The C–NC percentage was lower in O–C3N4 (66.32%) than in g-C3N4 (71.14%). The O1s spectra showed three peak positions corresponding to surface-adsorbed oxygen molecules, water molecules, and C–O.26 The XPS results showed that C–O appeared after modification, which indicated that oxygen atoms replaced nitrogen atoms during thermal polymerization.
 | ||
| Fig. 3 XPS spectra of g-C3N4 and O–C3N4. | ||
In addition, the EPR of O–C3N4 was significantly higher than that of g-C3N4 (ESI Fig. 2†), indicating a higher concentration of unpaired electrons in O–C3N4.18 The EIS spectra of g-C3N4 and O–C3N4 were shown in ESI Fig. 3.† Since the arc radius of O–C3N4 was significantly lower than that of g-C3N4, O–C3N4 has higher electron transfer capacity.27
In summary, oxygen doping caused oxygen atoms to enter the g-C3N4 triazine ring structure and replace the nitrogen atoms. This indicated that the thermal polymerization successfully modified g-C3N4 without destroying the structure. The modification by oxygen doping improved the catalytic performance by increasing the specific surface area, pore structure, and electron transport between sites to different degrees.
3.2 Degradation experiments
The TC degradation by g-C3N4 and xO–C3N4 without PMS was evaluated. The results showed that g-C3N4 and xO–C3N4 did not adsorb TC (ESI Fig. 4†). Thus, the subsequent experiments can ignore the adsorption effect of the catalyst on TC degradation.Fig. 4(a) showed that the PMS alone had a final TC removal rate of 44.43%. This may be because TC has some reducing properties, and a spontaneous redox reaction can occur between PMS and TC28 that can remove some TC. However, PMS alone did not provide a sufficient TC degradation performance. The unmodified g-C3N4/PMS system had a TC removal rate of 52.04%. The 0.1 O–C3N4/PMS, 0.2 O–C3N4/PMS, 0.4 O–C3N4/PMS, and 0.8 O–C3N4/PMS systems had TC removal rates of 64.56%, 67.88%, 89.84%, and 73.90%, respectively. These results indicated that pristine g-C3N4 had a limited activation effect on PMS while O–C3N4 had a stronger activation effect on PMS. The activation effect of the modified g-C3N4 increased with the oxygen content, but 0.8 O–C3N4 had a lower activation effect than 0.4 O–C3N4. This may be because of g-C3N4 fragmenting during calcination owing to excessive oxygen doping.19 ESI Table 2† and Fig. 4(b) indicated that the reaction rate constant increased and then decreased as the doping amount was increased. The reaction rate constant of 0.4 O–C3N4 was nearly four times that of pristine g-C3N4, which was consistent with the TC degradation results (Fig. 4(a)). Thus, all subsequent TC degradation experiments were performed by using 0.4 O–C3N4 as the modified catalyst (abbreviated as O–C3N4).
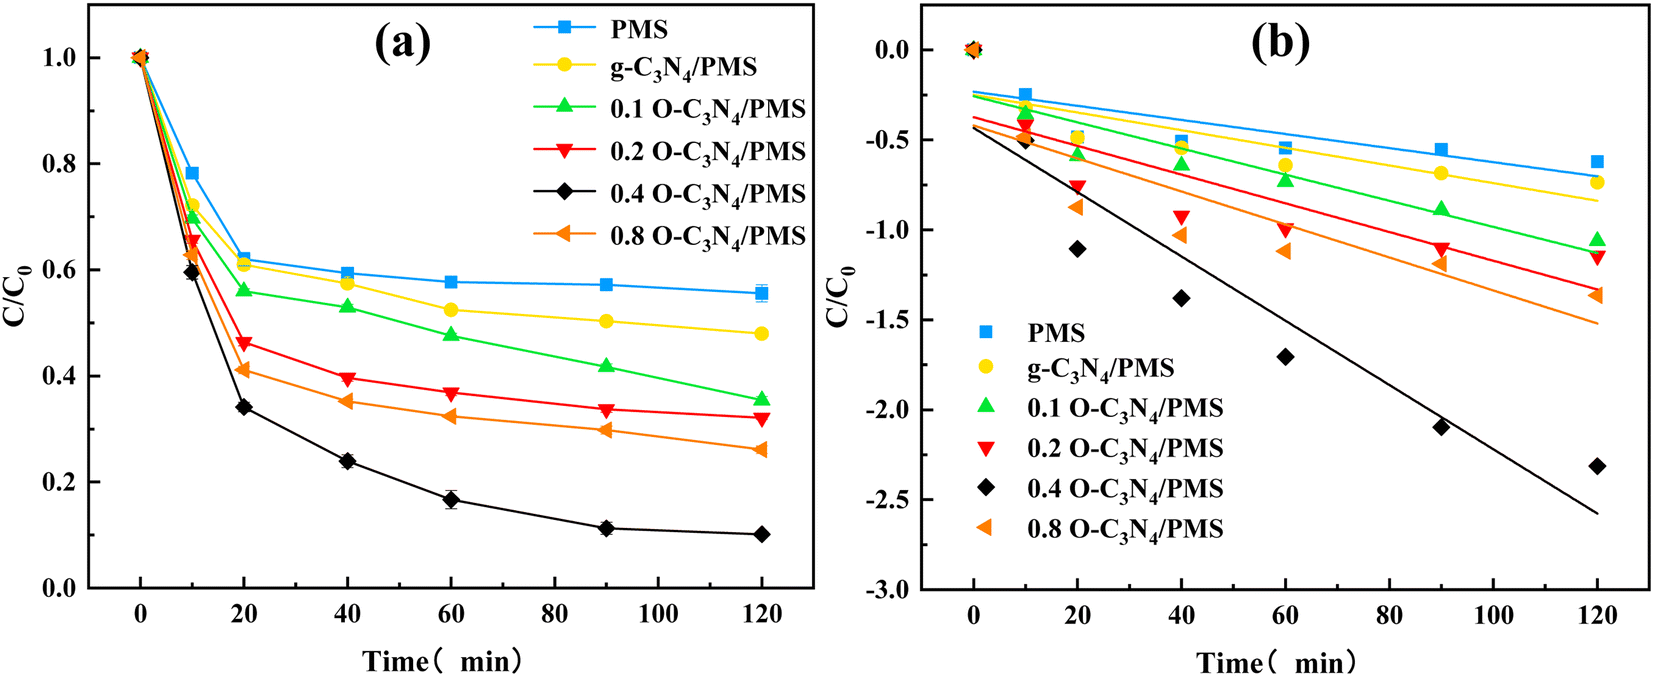 | ||
| Fig. 4 TC degradation and quasi-level kinetics of different reaction systems. Experimental conditions: [catalyst] = 0.2 g L−1, [PMS] = 4 mM, [TC] = 20 mg L−1, [pH] = 5.7, [T] = 26 °C. (a) Degradation of TC in various systems, (b) pseudo-first-order kinetics of TC degradation. | ||
Next, the effects of different influencing factors on the TC degradation performance were considered. Fig. 5(a) presented the effect of the catalyst dosage. Increasing the catalyst dosage improved the final TC removal rate and furtherly enhanced the reaction rate. Increasing the catalyst dosage provided more active sites, which improved the PMS activation efficiency and promoted TC degradation. The redox reaction was more intense in the first 10 min, while a large amount of free radicals was generated at this time. However, increasing the catalyst dosage decreased the reaction rate at 20–40 min, which may be caused by excess active reduction sites in O–C3N4 competing with TC for free radicals.29
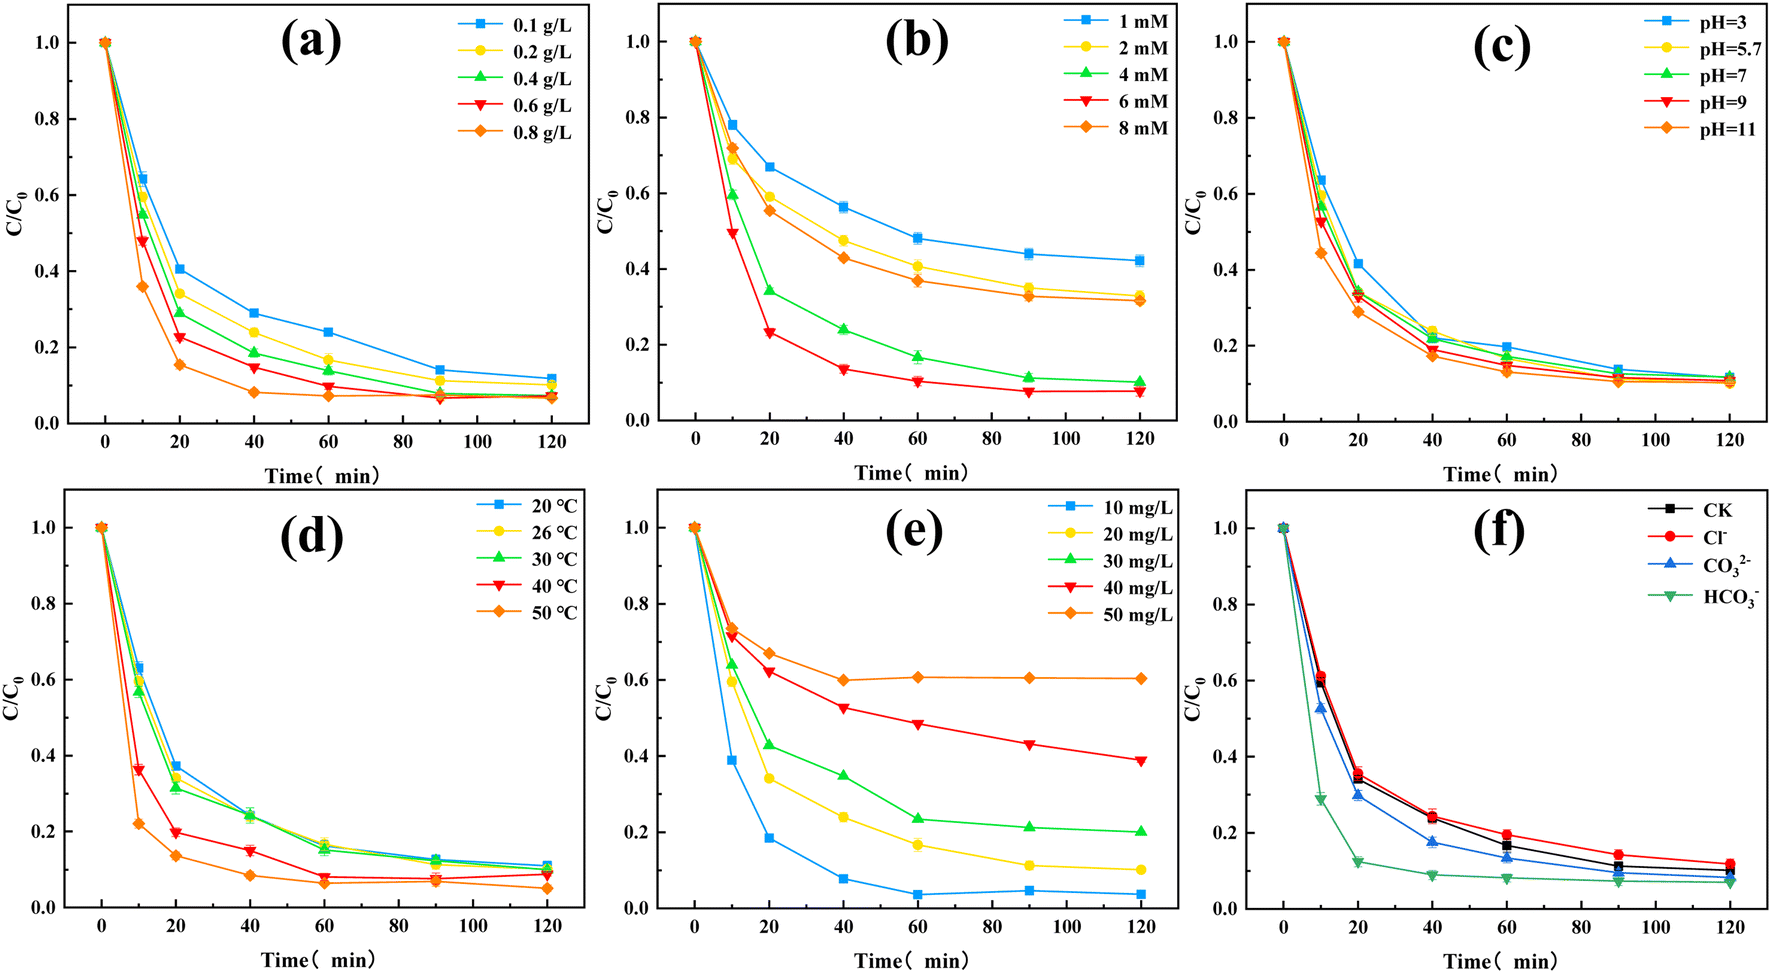 | ||
| Fig. 5 Effects of different factors on TC degradation: (a) [O–C3N4] = 0.1–0.8 g L−1, (b) [PMS] = 1–4 mM, (c) [pH] = 3–11, (d) [T] = 20–50 °C, (e) [TC] = 10–50 mg L−1, and (f) [NaCl] = [Na2CO3] = [NaHCO3] = 2 mM. Unless otherwise stated, the fixed experimental conditions were [O–C3N4] = 0.2 g L−1, [PMS] = 4 mM, [TC] = 20 mg L−1, [pH] = 5.7, and [T] = 26 °C. | ||
Fig. 5(b) showed the effect of PMS dosage on the TC degradation performance. The final TC removal rates of the O–C3N4/PMS system with PMS dosages of 1, 2, 4, 6, and 8 mM were 57.83%, 67.09%, 89.84%, 92.29%, and 68.38%, respectively. The TC removal rate gradually increased as the PMS dosage was added, as a result of more PMS generating more free radicals, which was beneficial to TC degradation. However, increasing the PMS dosage to 8 mM inhibited the TC degradation. The addition of excessive PMS resulted in a free radical quenching reaction,29 which reduced the TC removal rate.
Fig. 5(c) revealed the effect of the initial pH on the TC degradation performance. The final TC removal rates of the O–C3N4/PMS system with pH value of 3, 5.7, 7, 9, and 11 were 88.37%, 89.84%, 88.27%, 89.20%, and 89.65%, respectively. Changing the initial pH did not affect the final TC removal rate, which indicated that the synthesized catalyst (i.e., O–C3N4) had good stability and wide applicability. The pKa of PMS was reported as 9.4,8 which indicated that H2SO5 is the main form of PMS present in the O–C3N4/PMS system when the pH was less than 9.4. This also explained the higher TC removal rate at pH = 11.
Fig. 5(d) presented the effect of T on the TC degradation performance. The TC degradation was accelerated with increasing T. This may be because increasing T promoted the decomposition of PMS and acted synergistically with the activation of PMS by O–C3N4, which accelerates the TC degradation. In addition, increasing T promotes TC degradation by increasing the thermal motion of molecules.30 Increasing T also enhanced the final TC removal rate, which may be attributed to the instability of TC.
Fig. 5(e) referred the effect of the initial TC concentration on the TC degradation performance. At initial TC concentrations of 10, 20, 30, 40, and 50 mg L−1, the final TC removal rates were 96.30%, 89.84%, 79.93%, 61.06%, and 39.66%, respectively. This indicated that the removal rate of TC decreased gradually with the increase of the initial concentration of TC at the range of 10–50 mg L−1 under the premise that other factors in the O–C3N4/PMS system remain unchanged. This may be because the free radicals or active species in the system were fixed to the catalyst and PMS dosages. Increasing the initial TC concentration required a larger amount of active species for TC degradation, which lowered the final TC removal rate. In addition, the intermediates of TC may compete with each other on the catalyst surface, which would inhibit TC degradation.
Fig. 5(f) showed the effect of common inorganic ions on the TC degradation performance. The common inorganic anions did not affect the final TC removal rate. When the same amounts of Cl−, CO32−, and HCO3− were added to the system, HCO3− was found to accelerate the TC degradation. The aqueous solution of HCO3− was weakly basic, so injecting HCO3− into the system increased the pH. This accelerated the TC degradation, which was consistent with the results in Fig. 5(c). Previous studies31 reported that Cl− and HCO3− can remove SO4˙− and OH in water, which can decrease the degradation of organic pollutants:
| Cl− + SO4˙− → Cl· + SO42− | (3) |
| HCO3− + SO4˙− → CO3− + SO42− + H+ | (4) |
However, the results of the present study were quite different, which indirectly implies that the O–C3N4/PMS system may have a non-radical degradation pathway.
The main oxidants used in advanced oxidation techniques based on SO4˙− were PMS and PDS. To investigate the generality of O–C3N4 as a persulfate catalyst, sodium persulfate (PDS-Na) and potassium persulfate (PDS-Ka) were used as control groups. ESI Fig. 5† showed that the final TC removal rates of the O–C3N4/PDS-Na and O–C3N4/PDS-Ka systems were 8.36% and 6.13%, respectively, which were considerably less than that of the O–C3N4/PMS system (89.84%). This may be because of the asymmetric molecular structure and easy decomposition of PMS.29 In contrast, PDS has a symmetric molecular structure, which made it difficult to be activated by O–C3N4.32
To test the effectiveness of the O–C3N4/PMS system in real water bodies, it was applied to four different water environments: deionized water, tap water, river water from a university campus in Changzhou that receives domestic wastewater from the cafeteria and dormitory, and water from Lake Ge. The final TC removal rates were 89.84%, 88.47%, 85.95%, and 86.27%, respectively (ESI Fig. 6†). This indicated that the synthesized catalyst had wide practical applicability.
Five cycle experiments were performed to evaluate the reusability of O–C3N4 as a PMS catalyst for TC degradation. Fig. 6 showed that the final TC removal rates after one, two, three, four, and five cycles were 89.84%, 87.66%, 84.75%, 82.79%, and 79.72%, respectively. This showed that the catalytic activity of O–C3N4 slightly decreased over five cycles, which may be attributed to some organic intermediates adsorbing onto the catalyst surface and occupying active cites. However, it still showed good reusability. In addition, the crystal structure of the catalyst did not change significantly before and after the reaction (ESI Fig. 7†), which indicated good structural stability.
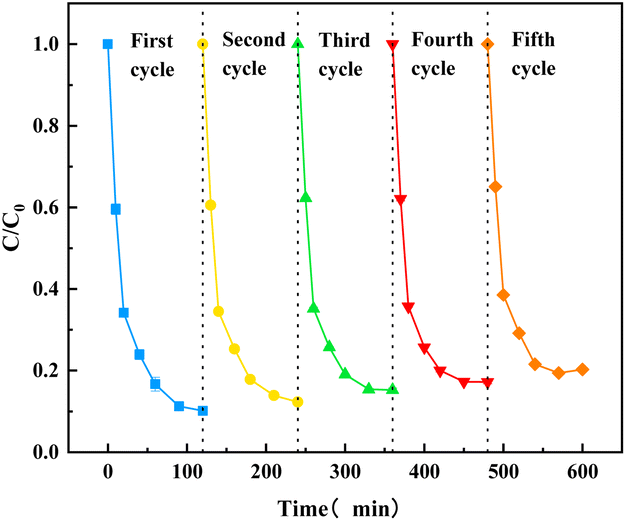 | ||
| Fig. 6 Stability of the catalyst. | ||
3.3 Analysis of the degradation mechanism
The TC degradation mechanism was investigated by free radical quenching experiments. MeOH was generally used as a quencher for SO4˙− and ·OH, and TBA can be used as a quencher for ·OH.33 O2− and 1O2 can be quenched by BQ and FFA reagents, respectively.34 Fig. 7(a) showed that adding MeOH, TBA, BQ, and FFA resulted in final TC removal rates of 72.54%, 76.49%, 66.41%, and 39.11%, respectively. Compared with the TC removal rate with no quenchers (89.84%), adding MeOH and TBA did not have a significant inhibitory effect. Adding BQ had a greater inhibitory effect than adding MeOH and TBA, and adding FFA greatly inhibited the TC degradation performance of the system. This led to the preliminary conclusion that 1O2 is the main active species (reactive oxygen species (ROS)) in the O–C3N4/PMS system. To verify the free radical and non-free radical pathways of the O–C3N4/PMS system, EPR was used for ROS identification. Specifically, 5,5-dimethyl-1-pyrroline-N-oxide (DMPO) was used as the ·OH, SO4˙−, and O2− spin trapping agent in aqueous and methanolic media. Meanwhile, 2,2,6,6-tetramethyl-4-piperidinyl (TEMP) was used as the single linear oxygen spin trapping agent in aqueous solution. Fig. 7(b–d) showed the EPR plots of ROS. A peak intensity ratio of 1![[thin space (1/6-em)]](https://www.rsc.org/images/entities/char_2009.gif) :2:2:1 characteristic peaks can be clearly observed, which meant that the O–C3N4/PMS system was producing ·OH.35 A DMPO-SO4 adduct signal was also captured, which indicated the production of SO4˙−. The DMPO-O2 adduct signal was also observed (Fig. 7(c)), which referred to the production of O2−. In addition, an equal-strength three-wire signal was observed with TEMP as the spin capture agent (Fig. 7(d)), indicating that 1O2 was produced in the O–C3N4/PMS system. These results support the previous speculation (see Section 3.2) that the O–C3N4/PMS system has both free radical and non-free radical degradation pathways. The EPR results (Fig. 7(b–d)) confirmed that the O–C3N4/PMS system generated multiple radical and non-radical types of ROS and that the major ROS was 1O2. In addition, the ROS signals captured with both DMPO and TEMP spin traps gradually increased in the first 10 min of the reaction, which indicated that the O–C3N4/PMS system produced a large amount of ROS during this time. This was consistent with the previous TC degradation results shown in Fig. 4 and 5.
:2:2:1 characteristic peaks can be clearly observed, which meant that the O–C3N4/PMS system was producing ·OH.35 A DMPO-SO4 adduct signal was also captured, which indicated the production of SO4˙−. The DMPO-O2 adduct signal was also observed (Fig. 7(c)), which referred to the production of O2−. In addition, an equal-strength three-wire signal was observed with TEMP as the spin capture agent (Fig. 7(d)), indicating that 1O2 was produced in the O–C3N4/PMS system. These results support the previous speculation (see Section 3.2) that the O–C3N4/PMS system has both free radical and non-free radical degradation pathways. The EPR results (Fig. 7(b–d)) confirmed that the O–C3N4/PMS system generated multiple radical and non-radical types of ROS and that the major ROS was 1O2. In addition, the ROS signals captured with both DMPO and TEMP spin traps gradually increased in the first 10 min of the reaction, which indicated that the O–C3N4/PMS system produced a large amount of ROS during this time. This was consistent with the previous TC degradation results shown in Fig. 4 and 5.
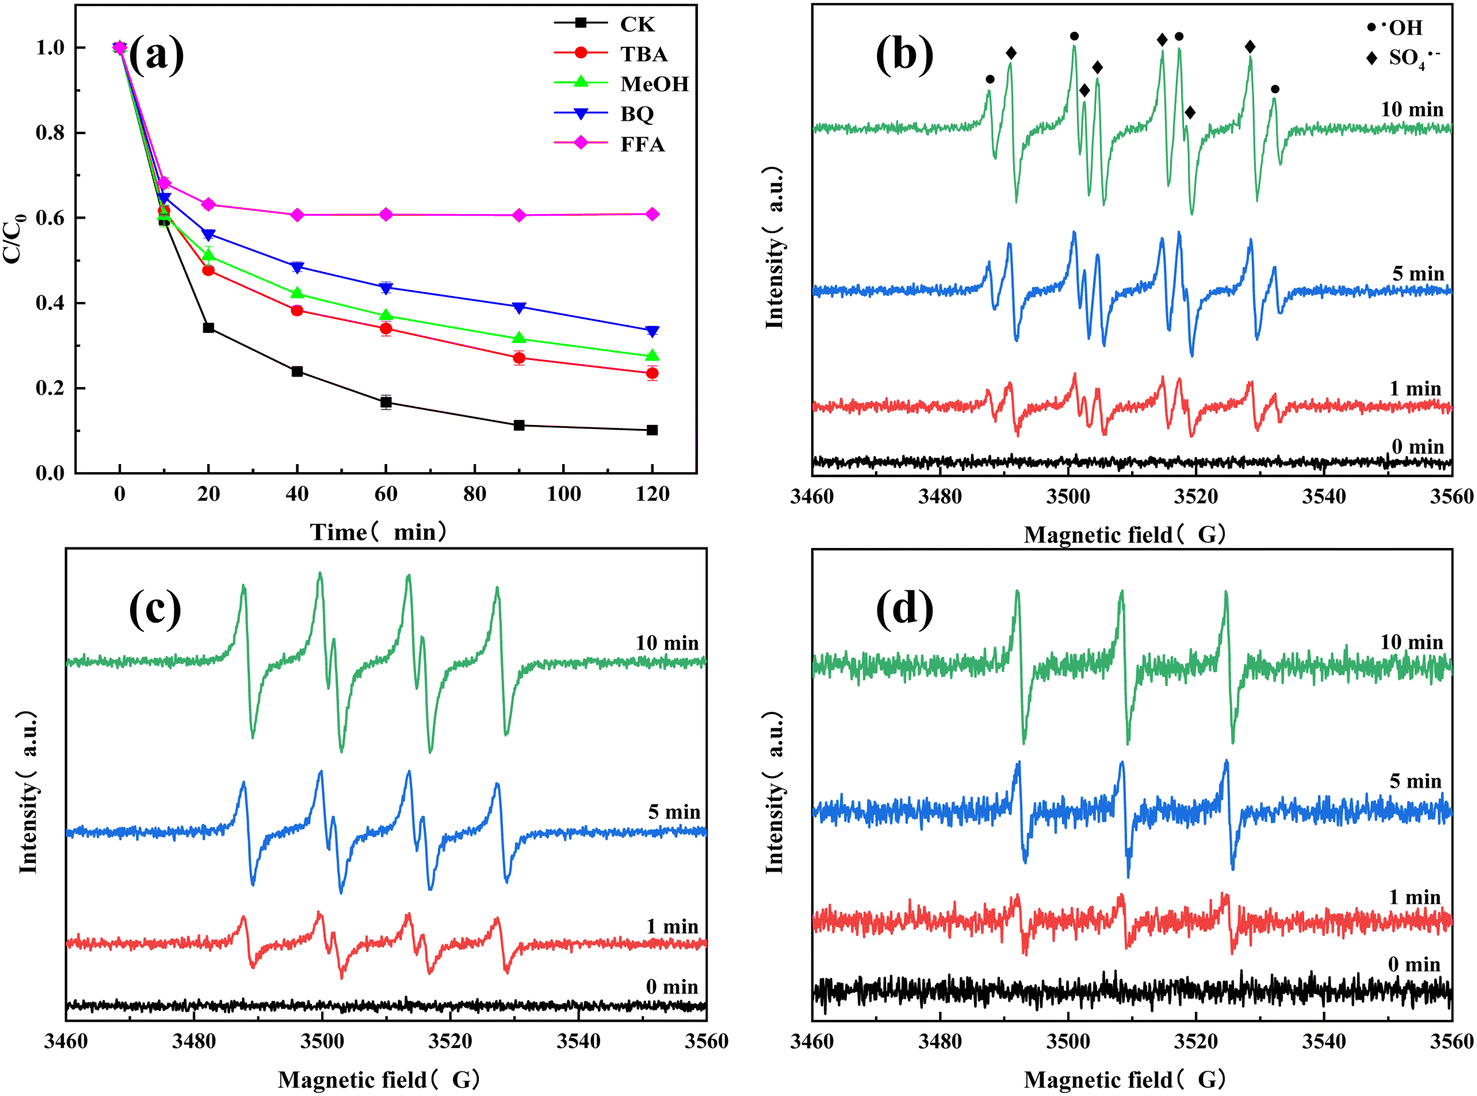 | ||
| Fig. 7 (a) Effects of active species quenching on TC degradation. EPR spectrograms: (b) ·OH/SO4˙−, (c) O2−, and (d) 1O2. Experimental conditions: [O–C3N4] = 0.2 g L−1 [PMS] = 4 mM [TC] = 20 mg L−1 [pH] = 5.7 [T] = 26 °C. | ||
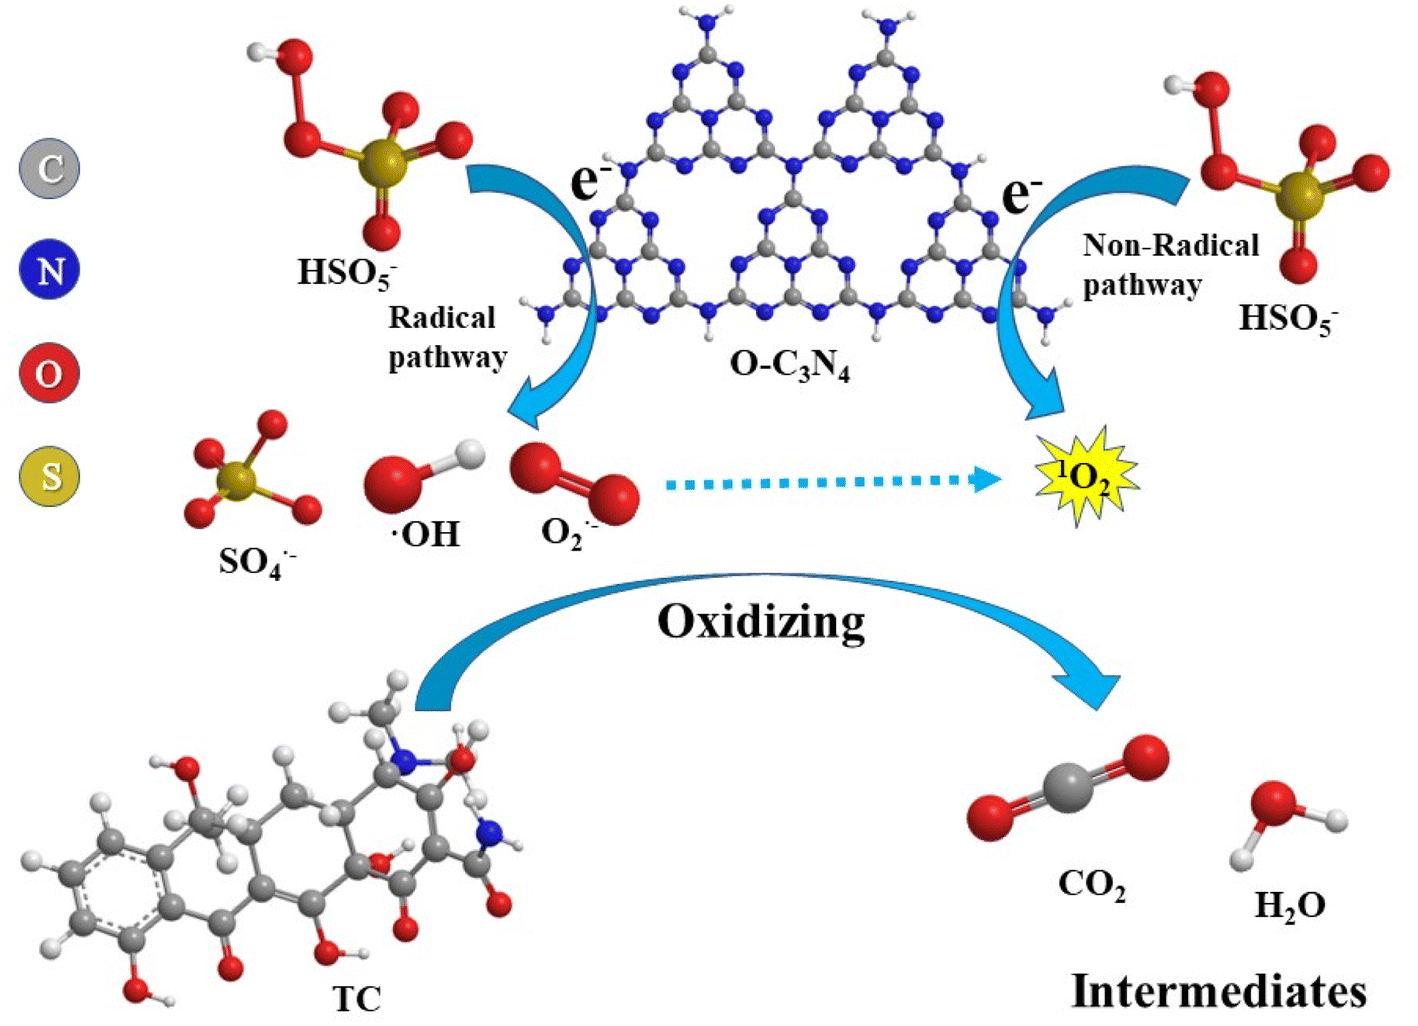
Based on these results, a rational explanation for the TC degradation mechanism of the O–C3N4/PMS system can be proposed, as shown in Fig. 8. The high electronegativity of oxygen atoms made them more accessible to electrons, so regions of different electron strengths formed on the O–C3N4 surface.18 The electron transfer excited PMS to produce OH and SO4˙−:
| e− + HSO5− → ·OH + SO42− | (5) |
| e− + HSO5− → SO4˙− + OH− | (6) |
 | ||
| Fig. 8 TC degradation mechanism of the O–C3N4/PMS system. | ||
In addition, the peroxy bonding excited PMS to produce ·OH and SO4˙− along with the less reactive monoperoxysulfate radical (SO5−):
| e− + HSO5− → SO5− + H+ | (7) |
SO5− is further trapped by water molecules in the system to generate 1O2:36,37
| SO5− + H2O → 2HSO4− + 1O2 | (8) |
In addition, oxygen molecules present in the system may also capture electrons and react to form O2−, which further react with ·OH to form 1O2:
| e− + O2 → O2− | (9) |
| O2− + ·OH → OH− + 1O2 | (10) |
These radicals and non-radicals act together to degrade TC:
| ·OH/SO4˙−/O2−/1O2 + TC → intermediates → H2O + CO2 | (11) |
3.4 Mineralization degree and intermediate product analysis
The TOC analyzer was used to determine the variation of TOC in the O–C3N4/PMS system and evaluate the degree of mineralization. Supplement Fig. 8 showed that the final TOC removal rate was 33.9%. This indicated that part of the TC was mineralized to CO2 and H2O, and part of the TC was converted to other products in addition to the residual TC. Therefore, analyzing the intermediate products of TC degradation by the O–C3N4/PMS system and identifying possible degradation pathways were extremely important. LC-MS was used to identify the intermediate products (ESI Fig. 9†), which were then characterized according to the mass-to-charge ratio (m/z). The possible TC degradation pathways were suggested by structural analysis of the intermediate products. Fig. 9 showed the main TC degradation pathways. The higher electron density of the conjugated double bonds in TC molecules made them more susceptible to ROS attack.38 In pathway 1, ROS attacks the electron-rich conjugated double bond to form P1 (ref. 39) and TC was converted to P2 through demethylation.40 Then, P1 and P2 were then converted to P3 (m/z = 274) through ring opening, deamination, and dealkylation.41,42 P3 was further oxidized to the small molecules P4 (m/z = 218) and P5 (m/z = 167). In pathway 2, TC was first converted to P6 (m/z = 301) by dehydroxylation and ring opening.43 P6 is then converted to P7 (m/z = 279) by ·OH attack and further oxidizes to the small molecule P8 (m/z = 149).44 The small molecules of P4, P5, and P8 finally degraded to H2O and CO2.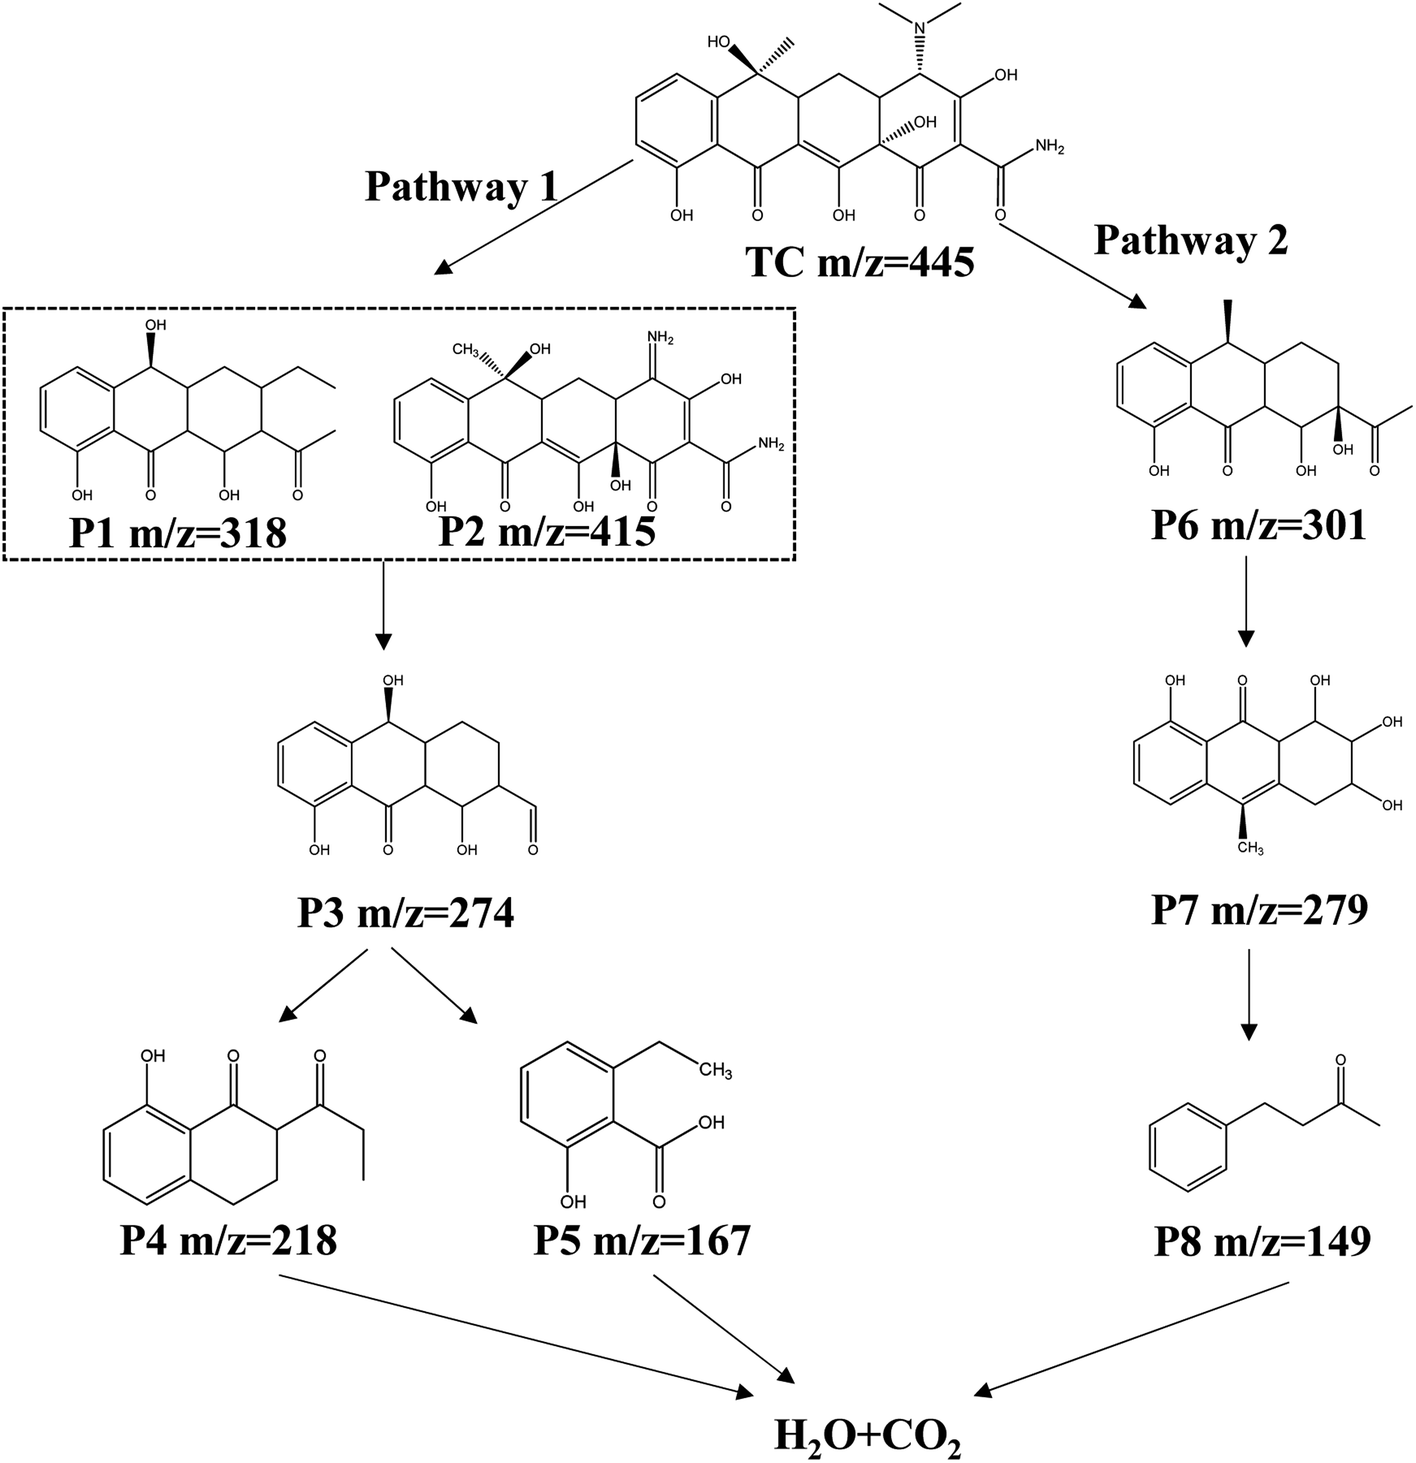 | ||
| Fig. 9 Possible TC degradation pathways. | ||
3.5 Toxicity analysis
Normally, TC is a large molecule, and its degradation requires complex processes to be mineralized into water and carbon dioxide. However, the intermediates produced during TC degradation may be more toxic than the parent.45,46 Therefore, the toxicity of TC and intermediates was assessed using the Toxicity Estimation Software Tool (T.E.S.T).47 The LC50 values of all intermediates except P2 intermediates were lower than that of TC (ESI Fig. 10(a)†), suggesting that most intermediates were less toxic to fathead minnow. As shown in ESI Fig. 10(b),† the LC50 value of TC against daphnia magna was 12.17 mg L−1, which was classified as “harmful”. Except for P2 and P8 intermediates, LC50 values of all intermediates were lower than that of TC, indicating that most intermediates were not as toxic as TC to daphnia magna. ESI Fig. 10(c)† showed that the developmental toxicity of most intermediates was reduced except for P5. In addition, the mutagenicity of other intermediates was not significantly reduced except for P1, P3, P5 and P8 which were negative mutagenicity (ESI Fig. 10(d)†). In conclusion, the removal of TC by degradation can indeed reduced the toxicity of TC, but most intermediates were still toxic.4. Conclusion
In this work, O–C3N4 was prepared by thermal polymerization as a PMS catalyst for TC degradation. Experiments were performed under different conditions, and the results meant that the O–C3N4/PMS system expressed good degradation performance with a final TC removal rate of 89.94% in 120 min and wide practical applicability. The cycling experiments showed that the catalyst had good reusability and structural stability, while the EPR tests indicated that the system had free radical and non-free radical pathways for TC degradation. ·OH, SO4˙−, O2−, and 1O2 were all involved in the TC degradation, and 1O2 was the main active species. The activation mechanism of PMS was clarified, and possible TC degradation pathways were proposed based on an analysis of the intermediate products. Toxicity prediction of TC and intermediates showed that O–C3N4/PMS system significantly reduced the toxicity of TC. The developed O–C3N4/PMS system had wide practical applicability for TC degradation in water, and the results of this study provided a reference for future research on efficient and low-cost nonmetallic catalysts.List of abbreviations
| EPR | Electron paramagnetic resonance |
| ROS | Reactive oxygen species |
| SEM | Scanning electron microscopy |
| TBA | Tert-Butyl alcohol |
| TOC | Total organic carbon |
| XPS | X-ray photoelectron spectroscopy |
| XRD | X-ray diffraction |
Author contributions
Liquan Wang: methodology, visualization, writing – original draft. Xian Xiao and Yuan Zhao: writing – review & editing, Ruyi Li, Zhiwei Zhang and Ting Chen: editing & visualization, Yuexiang Gao and Yimin Zhang: writing – review & editing conceptualization.Conflicts of interest
The authors declare that they have no known competing financial interests or personal relationships that could have appeared to influence the work reported in this paper.Acknowledgements
This study was supported by the Yangtze River Water Ecological Environment Protection Research Project of Yangzhou City, the Yangtze River Water Ecological Environment Protection Research Project of Jiangsu Province (2022-LHYJ-02-0502-04) and “Integration and Demonstration of Integrated Regulation and Ecological Restoration Technology of Wunan Regional River and Lake System”, National Science and Technology Major Special Project (2017ZX07202006). Besides, the author would like to thank the Shiyanjia Lab [https://www.shiyanjia.com] for its detection work in SEM, EDS, XRD, BET, XPS, and FT-IR.References
- Q. Li, Y. Tang, B. Zhou, J. Zhou and B. Shi, Bioresour. Technol., 2022, 358, 127417 CrossRef CAS.
- Y. Dai, M. Liu, J. Li, S. Yang, Y. Sun, Q. Sun, W. Wang, L. Lu, K. Zhang, J. Xu, W. Zheng, Z. Hu, Y. Yang, Y. Gao and Z. Liu, Sep. Sci. Technol., 2020, 55, 1005–1021 CrossRef CAS.
- X. Li, S. Fan, C. Jin, M. Gao, Y. Zhao, L. Guo, J. Ji and Z. She, Chemosphere, 2022, 305, 135448 CrossRef CAS.
- W. Ren, C. Cheng, P. Shao, X. Luo, H. Zhang, S. Wang and X. Duan, Environ. Sci. Technol., 2022, 56, 78–97 CrossRef CAS.
- L. Zhang, W. Ding, J. Qiu, H. Jin, H. Ma, Z. Li and D. Cang, J. Cleaner Prod., 2018, 197, 297–305 CrossRef CAS.
- Y. Liu, Y. Zhao and J. Wang, J. Hazard. Mater., 2021, 404, 124191 CrossRef CAS.
- Y. Feng, D. Wu, Y. Deng, T. Zhang and K. Shih, Environ. Sci. Technol., 2016, 50, 3119–3127 CrossRef CAS.
- P. Hu and M. Long, Appl. Catal., B, 2016, 181, 103–117 CrossRef CAS.
- R. Yin, J. Sun, Y. Xiang and C. Shang, J. Cleaner Prod., 2018, 178, 441–448 CrossRef CAS.
- X. Li, Z. Wang, B. Zhang, A. I. Rykov, M. A. Ahmed and J. Wang, Appl. Catal., B, 2016, 181, 788–799 CrossRef CAS.
- X. Dong, X. Duan, Z. Sun, X. Zhang, C. Li, S. Yang, B. Ren, S. Zheng and D. D. Dionysiou, Appl. Catal., B, 2020, 261, 118214 CrossRef CAS.
- Y. Lei, C.-S. Chen, Y.-J. Tu, Y.-H. Huang and H. Zhang, Environ. Sci. Technol., 2015, 49, 6838–6845 CrossRef CAS.
- X. Gao, L. Ai, L. Wang, Y. Ju, S. Liu, J. Wang and H. Fan, J. Environ. Chem. Eng., 2022, 10, 107814 CrossRef CAS.
- E. Falletta, M. Longhi, A. Di Michele, D. C. Boffito and C. L. Bianchi, J. Cleaner Prod., 2022, 371, 133641 CrossRef CAS.
- Y. Wang, X. Li, W. Lei, B. Zhu and J. Yang, Appl. Surf. Sci., 2021, 559, 149967 CrossRef CAS.
- L. Jiang, X. Yuan, Y. Pan, J. Liang, G. Zeng, Z. Wu and H. Wang, Appl. Catal., B, 2017, 217, 388–406 CrossRef CAS.
- S. Wang, L. Xu and J. Wang, Chem. Eng. J., 2019, 375, 122041 CrossRef CAS.
- Y. Gao, Y. Zhu, L. Lyu, Q. Zeng, X. Xing and C. Hu, Environ. Sci. Technol., 2018, 52, 14371–14380 CrossRef CAS.
- P. Qiu, C. Xu, H. Chen, F. Jiang, X. Wang, R. Lu and X. Zhang, Appl. Catal., B, 2017, 206, 319–327 CrossRef CAS.
- S. Wang, L. Xu and J. Wang, Chem. Eng. J., 2022, 428, 131066 CrossRef CAS.
- L. Lin, H. Ou, Y. Zhang and X. Wang, ACS Catal., 2016, 6, 3921–3931 CrossRef CAS.
- S. Chen, J. Duan, J. Ran and S.-Z. Qiao, Adv. Sci., 2015, 2, 1400015 CrossRef.
- L. Yang, J. Huang, L. Shi, L. Cao, Q. Yu, Y. Jie, J. Fei, H. Ouyang and J. Ye, Appl. Catal., B, 2017, 204, 335–345 CrossRef CAS.
- Z.-F. Huang, J. Song, L. Pan, Z. Wang, X. Zhang, J.-J. Zou, W. Mi, X. Zhang and L. Wang, Nano Energy, 2015, 12, 646–656 CrossRef CAS.
- H. S. H. Mohamed, L. Wu, C.-F. Li, Z.-Y. Hu, J. Liu, Z. Deng, L.-H. Chen, Y. Li and B.-L. Su, Acs Applied Materials & Interfaces, 2019, 11, 32957–32968 Search PubMed.
- Y. Wang, H. Wang, J. Li and X. Zhao, Appl. Catal., B, 2020, 278, 118981 CrossRef CAS.
- C. Zhang, D. Qin, Y. Zhou, F. Qin, H. Wang, W. Wang, Y. Yang and G. Zeng, Appl. Catal., B, 2022, 303, 120904 CrossRef CAS.
- L. Liu, H. Mi, M. Zhang, F. Sun, R. Zhan, H. Zhao, S. He and L. Zhou, Chem. Eng. J., 2021, 407, 127201 CrossRef CAS.
- T. Li, P. Cui, X. Wang, C. Liu, Y. Zeng, G. Fang, Y. Zhao, J. Gao, Y. Wang and D. Zhou, Environ. Sci.: Nano, 2022, 9, 2534–2547 RSC.
- S. Wang, H. Liu and J. Wang, J. Hazard. Mater., 2020, 387, 121669 CrossRef CAS.
- F. Shao, Y. Wang, Y. Mao, T. Shao and J. Shang, Chemosphere, 2020, 261, 127844 CrossRef CAS.
- P. Hu, H. Su, Z. Chen, C. Yu, Q. Li, B. Zhou, P. J. J. Alvarez and M. Long, Environ. Sci. Technol., 2017, 51, 11288–11296 CrossRef CAS.
- R. Bai, W. Yan, Y. Xiao, S. Wang, X. Tian, J. Li, X. Xiao, X. Lu and F. Zhao, Chem. Eng. J., 2020, 397, 125501 CrossRef CAS.
- J. Ye, Y. Wang, Z. Li, D. Yang, C. Li, Y. Yan and J. Dai, J. Hazard. Mater., 2021, 417, 126028 CrossRef CAS.
- H. Song, C. Chen, H. Zhang and J. Huang, J. Environ. Chem. Eng., 2016, 4, 460–467 CrossRef CAS.
- Y. Pan, M. Zhou, J. Cai, X. Li, W. Wang, B. Li, X. Sheng and Z. Tang, Chem. Eng. J., 2018, 339, 411–423 CrossRef CAS.
- Y. Yang, G. Zeng, D. Huang, C. Zhang, D. He, C. Zhou, W. Wang, W. Xiong, B. Song, H. Yi, S. Ye and X. Ren, Small, 2020, 16, 2001634 CrossRef CAS.
- Y. Liu, X. He, Y. Fu and D. D. Dionysiou, Chem. Eng. J., 2016, 284, 1317–1327 CrossRef CAS.
- S.-S. Liu, Q.-J. Xing, Y. Chen, M. Zhu, X.-H. Jiang, S.-H. Wu, W. Dai and J.-P. Zou, ACS Sustainable Chem. Eng., 2019, 7, 1250–1259 CrossRef CAS.
- J. Niu, Z. Song, X. Gao, Y. Ji and Y. Zhang, J. Alloys Compd., 2021, 884, 161292 CrossRef CAS.
- Y. Zhang, J. Zhou, X. Chen, L. Wang and W. Cai, Chem. Eng. J., 2019, 369, 745–757 CrossRef CAS.
- B. Tan, Y. Fang, Q. Chen, X. Ao and Y. Cao, J. Colloid Interface Sci., 2021, 601, 581–593 CrossRef CAS.
- S. Wang, Z. Teng, Y. Xu, M. Yuan, Y. Zhong, S. Liu, C. Wang, G. Wang and T. Ohno, Appl. Catal., B, 2020, 260, 118145 CrossRef CAS.
- K. Wu, D. Chen, S. Lu, J. Fang, X. Zhu, F. Yang, T. Pan and Z. Fang, J. Hazard. Mater., 2020, 382, 121027 CrossRef CAS.
- Z. Ouyang, Y. Yang, C. Zhang, S. Zhu, L. Qin, W. Wang, D. He, Y. Zhou, H. Luo and F. Qin, J. Mater. Chem. A, 2021, 9, 13402–13441 RSC.
- C. Zhang, Z. Ouyang, Y. Yang, X. Long, L. Qin, W. Wang, Y. Zhou, D. Qin, F. Qin and C. Lai, Chem. Eng. J., 2022, 448, 137370 CrossRef CAS.
- W. Liu, Y. Li, F. Liu, W. Jiang, D. Zhang and J. Liang, Water Res., 2019, 150, 431–441 CrossRef CAS.
Footnote |
| † Electronic supplementary information (ESI) available. See DOI: https://doi.org/10.1039/d3ra00345k |
| This journal is © The Royal Society of Chemistry 2023 |