DOI:
10.1039/D3RA00064H
(Paper)
RSC Adv., 2023,
13, 7280-7292
Utilizing modified cellulose nanoparticles derived from a plant loofah sponge to improve the removal of diazinon insecticide from an aqueous medium
Received
4th January 2023
, Accepted 21st February 2023
First published on 6th March 2023
Abstract
Organophosphate insecticides, such as diazinon, have been well investigated to pose health and environmental risks. In this study, ferric-modified nanocellulose composite (FCN) and nanocellulose particles (CN) based on a natural source as a loofah sponge were synthesized to verify their adsorption potential to eliminate diazinon (DZ) from contaminated water. The as-prepared adsorbents were characterized by performing TGA, XRD, FTIR spectroscopy, SEM, TEM, pHPZC, and BET analyses, in which FCN showed high thermal stability, surface area of 82.65 m2 g−1, surface with mesopores, good crystallinity (61.6%), and particle size of 86.0 nm. The results of adsorption tests demonstrated that the maximum Langmuir adsorption capacity (294.98 mg g−1) was exhibited by FCN at 38 °C, pH 7, 1.0 g L−1 of adsorbent dosage, and 20 h of contact shaking time. The effect of adding KCl solution with high ionic strength (1.0 mol L−1) reduced the DZ removal percent by 52.9%. The experimental adsorption data achieved the best fit with all the applied isotherm models with favorable, physical, and endothermic nature of adsorption consistent with thermodynamic data. Pentanol attained higher desorption efficiency (95%) and was used in five adsorption/desorption cycles in which FCN exhibited only an 8.8% decrease in the removal percent of DZ.
1. Introduction
The pollution of groundwater and surface water resources with insecticides is one of the most substantial environmental concerns. Insecticide contaminants are inserted into the environment from several sources, such as chemical spills, industrial effluents, and agricultural runoff. Insecticides have been widely utilized in agriculture since the end of World War II to protect crops and fields from insects, weeds, and other pests owing to their low cost and high effectiveness. They cause threats to the ecosystem, living organisms, and human health along the dietary exposure and food chain because these refractory organics are toxic and not biodegradable even in low concentrations.1 They can be categorized according to their structures and functions. Structurally, insecticides can be grouped into three main synthetic organic categories, namely the organophosphorus, organochlorine, and organonitrogen insecticides. Organophosphorus compounds, including about 40% of insecticides, are one of the hugest pesticide groups in the world.2 Diazinon (DZ) (O,O-diethyl-O-[6-methyl-2-(1-methylethyl)-4-pyrimidinyl] phosphorothioate) is an example of organophosphorus insecticide grouped by the World Health Organization (WHO) as a moderate risk insecticide (Class II). It has a lethal dosage of 350–400 mg kg−1 for human weight with a possible carcinogenic effect.3 The maximum permissible concentration in drinking water for diazinon is 0.02 mg L−1. Diazinon is a toxin that inhibits the action of acetylcholinesterase enzymes in the nervous system, causing a serious problem to human health.4 Additionally, diazinon results in harmful effects on blood and human organs, causing some diseases, such as respiratory paralysis, brain cancer, asthma, vision blurriness, drastic intestinal torsion, migraine, diarrhea, coma, high blood pressure, and neuropsychiatric complications, such as memory loss and depression.5,6 Therefore, it is urgent to improve desirable and highly efficient techniques to detect, quantify, and eliminate diazinon from aqueous solutions.
Several approaches have been used to remove organophosphorus insecticide, especially diazinon, from wastewater, including biological process,7 electrochemistry,8 photocatalysis,9 oxidation,10 membrane filtration, chromatography,11 and adsorption.12,13 Every method has drawbacks and benefits. However, the deficiencies of most of these methods are high operational costs and may generate byproducts after the treatment operation. Thus, adsorption technology is considered a competitive process regarding the development of a robust process, its low cost, high performance, economical and simple operation. Hence, the design of newfound adsorbents with a high adsorption capacity to eliminate persistent diazinon from wastewater is a global challenge. Various types of adsorbents, such as activated carbon,6 carbon nanotubes,14 metal–organic frameworks (MOFs),15 biochar,16 minerals, and clays, have been studied to eliminate insecticides from aqueous media. The nano-adsorbents used for water purification have been very common in recent years. They can possess a high adsorption capacity due to their numerous active sites, high surface area, and short diffusion length.
Cellulose is a linear unbranched polysaccharide that comprises several hundred to several thousand units of D-glucose linked by β-1,4-glucosidic linkages. Each chain is stabilized by intra-hydrogen bonds, providing rigidity to the structure. The individual chains are arranged in crystalline structures.17 Cellulose is the most naturally abundant renewable biopolymer with production evaluated above 7.5 × 10¹⁰ tons per year in the biosphere and with many hydroxyl groups that provide its benefits in various enrichment and separation technologies.18 Nanocellulose has been extracted from various natural sources, such as sugarcane bagasse, pineapple leaf fibers, pine and corn bark, loofah sponge, cotton fibers, hemp, wood, sisal plant, Chamaerops humilis leaves, rice straw, Phormium tenax leaf fibers, animals, and bacteria; its scientific study is currently increasing.19,20 Loofah is a non-wood plant with a high content (55–90%) of cellulose and is utilized as a mold to obtain porous materials as reinforcement materials in electrocatalysts, pharmaceutical fields, cosmetics, food, and water treatment. Recently, loofah has attracted more attention as an effective adsorbent in the heavy metals, insecticides, and dyes removal from contaminated water. Hence, the principles of green chemistry are focused on employing organic solvent-free methods, diminishing solvent consumption, utilizing indigenous safe adsorbents, and miniaturizing strategies.21 Cellulose exhibits characteristic properties, such as potential as a sorbent, non-toxicity, cheapness, water insolubility, hydrophilicity, good mechanical property, abundance in nature, adsorption property, and facile chemical modification. Therefore, they can be used for the removal of insecticides from wastewater and incorporated into composites. A solution of ferric chloride can be utilized for the modification of solid nano-adsorbents, where positively charged ferric ions are represented as Lewis acid, which improves the adsorption of anionic species of insecticides after hydrolysis in an acidic and neutral medium, such as diazinon, coumaphos, fensulfothion, and ethylparaoxon. To the best of our knowledge, no studies have been conducted on loofah sponge-based nanocellulose modified with ferric ions as nanocomposites for diazinon removal via adsorption.
This study aims to synthesize nanocellulose (CN) extracted from a loofah sponge and ferric-modified nanocellulose composite (FCN) for diazinon adsorption. Diazinon was selected as an organophosphorus insecticide model owing to its widespread applications and prevalent presence in water sources. The nanomaterials produced were investigated by applying TGA, XRD, FTIR, pHPZC, N2 adsorption, SEM-EDX, and TEM technologies. The diazinon adsorption was tested in a batch process under various conditions, such as the pH effect of solution, nano-adsorbent dosage, initial adsorbate concentration, contact time, ionic strength, and temperature. Additionally, evaluations were made of isotherms, kinetics, and thermodynamics of diazinon adsorption on the prepared samples. Diazinon desorption from the FCN surface was determined using various desorbing agents, and FCN reusability was studied after five adsorption cycles.
2. Materials and methods
2.1. Materials
Loofah was obtained from a farm in Damanhour, Egypt, cut into very small pieces, washed repeatedly with distilled water to remove attached dust and impurities, dried at 100 °C, and ground into fine powder. Diazinon insecticide was obtained from Sigma-Aldrich. Hexahydrate ferric chloride was obtained from Oxford Lab Fine Chem Llp Co., India, while potassium chloride, sodium hypochlorite, ethanol, sodium hydroxide, hydrochloric acid, propanol, and pentanol were obtained from El-Nasr for Pharmaceutical and Chemical Industry Co., Egypt.
2.2. Synthesis of solid nano-adsorbents
2.2.1. Synthesis of nanocellulose particles. Twenty grams of loofah powder were dispersed into 200 mL of sodium hydroxide solution (17.5% w/v) to eliminate lignin and heated at 80 °C for 4 h under continuous magnetic stirring. The resulting mixture was filtered, washed with deionized water until alkali free, and dried at room temperature. The resulting product was bleached using sodium hypochlorite solution (12% w/v) for 40 min at 80 °C. After filtering, washing, and drying, the dried bleached product was hydrolyzed with 50 mL of 2.5 mol L−1 hydrochloric acid at 110 °C for 40 min under continuous stirring. The hydrolyzed sample was filtered, washed until the neutral filtrate, followed by the dialysis process, and finally dried. Nanocellulose (CN) yields a snowy-white powder.22,23
2.2.2. Synthesis of ferric-modified nanocellulose composites. One gram of CN was added into 50 mL of 100 mg L−1 solution of ferric chloride for 24 h under magnetic stirring. The obtained composite was filtered, gently washed, and finally dried at room temperature (FCN).
2.3. Characterization of the synthesized solid adsorbents
Thermogravimetric analysis of CN and FCN was applied by utilizing a thermal apparatus (SDT Q600 V20.9 Build 20) at a temperature of up to 800 °C.
The crystalline features of the prepared adsorbents were investigated using X-ray diffraction spectra (D8 advance diffractometer). The crystallinity index (Ict) of the solid adsorbents was calculated using the following equation:24
| |
 | (1) |
where
Im and
Iam represent the main peak intensity (at 2
θ = 22.5 and 22.4) and amorphous peak intensity (at 2
θ = 18.1 and 14.1) for CN and FCN, respectively.
Average pore diameter (![[r with combining macron]](https://www.rsc.org/images/entities/i_char_0072_0304.gif) , nm), specific surface area (SBET, m2 g−1), and total pore volume (VT, cm3 g−1) were evaluated via nitrogen gas adsorption (BET analysis) by employing a NOVA-3200e gas sorption analyser at −196 °C (Quantachrome Corporation, USA).
, nm), specific surface area (SBET, m2 g−1), and total pore volume (VT, cm3 g−1) were evaluated via nitrogen gas adsorption (BET analysis) by employing a NOVA-3200e gas sorption analyser at −196 °C (Quantachrome Corporation, USA).
FTIR spectrophotometer was performed for the solid adsorbents before and after DZ adsorption in the 450–3900 cm−1 range by utilizing Mattson 5000 FTIR spectrometer. A pH of zero charges for CN and FCN was determined by adding 50 mL of 0.1 mol L−1 solution of NaCl in closed flasks. The initial pH values were adjusted between 1.9 and 12.2 by utilizing 0.05 mol L−1 NaOH and/or HCl. The flasks were mixed with 0.05 g of solid adsorbents and agitated for 24 h. The final pH values were determined using a pH meter. pHPZC is the point at pHf = pHi.25
Transmission electron microscope (TEM) and SEM (scanning electron microscopy) were employed for CN and FCN using JEOL-JEM-2100 and JEOL JSM-6510LV models, Japan, respectively, in addition to EDX of FCN.
2.4. Adsorption studies
The diazinon adsorption from the aqueous solution by CN and FCN was studied by shaking 50 mL of DZ solution possessing a certain concentration with 0.05 g of solid adsorbent for 20 h at 20 °C and pH 7 value. The unadsorbed DZ concentration (Ce) was measured at a wavelength of 281 nm by applying a UV-vis spectrophotometer with error values of ±0.05%. The removal percent (R%) and equilibrium adsorption capacity qe (mg g−1) were calculated using eqn (2) and (3), respectively:| |
 | (2) |
| |
 | (3) |
where Ce and C0 are the equilibrium and initial DZ concentration (mg L−1), respectively. m is the adsorbent mass (g) and V is the DZ solution volume (L). To optimize the adsorption efficiency of diazinon, the pH (4 to 12), shaking time (0.5 to 32 h), initial DZ concentration (30 to 360 mg L−1) based on the sample adsorption capacity, ionic strength, the dosage of CN and FCN (0.25 to 1.60 g L−1), and adsorption temperature (20, 30, and 38 °C) effects were investigated. In the study of the ionic strength effect on DZ adsorption by FCN, we used solvents with various ionic strengths (I) (distilled water and (0.1, 0.2, 0.3, 0.5, and 1.0 mol L−1 KCl) with I = 0.0, 0.1, 0.2, 0.3, 0.5, and 1.0 mol L−1, respectively).
2.5. Adsorption kinetic models
Mechanism and rate of diazinon adsorption onto the prepared samples were investigated by pseudo-first order (PFO, eqn (4)), pseudo-second order (PSO, eqn (6)), Elovich (eqn (7)), and intra-particle diffusion (eqn (8)) kinetic models:26| | |
ln(qe − qt) = ln(qe) − k1t,
| (4) |
| |
 | (5) |
| |
 | (6) |
| |
 | (7) |
where qt and qe are the adsorbed amounts of diazinon (mg g−1) at time (t, h) and equilibrium, respectively. k1 (h−1), k2 (g mg−1 h−1), and Ct (mg L−1) are the rate constants of the PFO and PSO models, and the residual DZ concentration at time (t, h), respectively. β (g mg−1) and ∝ (mg g−1 h−1) are related to the extent of surface coverage and the initial rate of DZ adsorption, respectively. The C value denotes the boundary layer thickness. k0 is the intra-particle diffusion rate constant (mg g−1 h−1/2).
2.6. Adsorption isotherm models
Isotherm models were tested and applied for the diazinon adsorption mechanism, and the Langmuir isotherm (eqn (9)) and Freundlich isotherm (eqn (11)) are expressed as follows:27| |
 | (9) |
| |
 | (10) |
| |
 | (11) |
where b (L mg−1) and qm (mg g−1) represent the Langmuir constant and maximum adsorption capacity, respectively. Dimensionless separation constant (RL) was evaluated to explain the nature of DZ adsorption, whether it is irreversible (RL = 0), favorable (0 < RL < 1), or unfavorable (RL > 1). n and KF belong to Freundlich coefficients that express the intensity of adsorption and the adsorption capacity (L1/n mg1−1/n g−1), respectively.
The linear Temkin form (eqn (12)) and Dubinin–Radushkevich (eqn (15)) isotherm models are represented as follows:28
| |
 | (13) |
| |
 | (14) |
| |
ln![[thin space (1/6-em)]](https://www.rsc.org/images/entities/char_2009.gif) qe = lnqDR − KDR ε2, qe = lnqDR − KDR ε2,
| (15) |
| |
 | (16) |
where
A,
T, and
R constants are the adsorption heat, absolute temperature in Kelvin, and gas adsorption constant (8.314 J mol
−1 K
−1), respectively.
bT (J mol
−1) and
KT (L g
−1) are related to the Temkin constants.
qDR (mg g
−1),
ε and
KDR (mol
2 kJ
−2) represent the maximum adsorption capacity, Polanyi potential, and constant of Dubinin–Radushkevich, respectively.
EDR is the mean free energy of adsorption (kJ mol
−1).
2.7. Thermodynamic studies
Parameters of adsorption thermodynamics, such as enthalpy (ΔH°), free energy (ΔG°), and entropy (ΔS°) changes, were estimated by applying the following equations:25| |
 | (17) |
| | |
ΔG° = −RTlnKd,
| (18) |
| |
 | (19) |
where Cs, Ce, and Kd are the equilibrium concentrations (mg L−1) of DZ on the adsorbent and in the solution, and the adsorption distribution constant, respectively. The values of ΔH° (kJ mol−1) and ΔS° (kJ mol−1 K−1) were evaluated from the van't Hoff plot (eqn (19)).
2.8. Diazinon desorption and solid FCN reusability
The desorption of DZ was discussed by adding 0.5 g of the dried DZ preloaded FCN in 100 mL distilled water, ethanol, propanol, or pentanol, and then agitating for 15 h at 30 °C. The desorbed concentration of DZ was measured after filtration. The desorption efficiency% (D.E%) was calculated using the following equation:29| |
 | (20) |
where Cd is the equilibrium concentration (mg L−1) of DZ after desorption from the FCN. V (L) is the volume of the eluent. q is the maximum FCN adsorption capacity (mg g−1). m (g) is the mass of the adsorbent.
The reusability of the FCN was accomplished after five cycles of the diazinon adsorption/desorption processes. DZ adsorption was accomplished by FCN under 600 mg L−1 of DZ concentration, 1.0 g L−1 of adsorbent dosage, pH 7, at 30 °C, and 20 h as shaking time. After each cycle, the FCN was filtered and repeatedly washed with 25 mL of pentanol to desorb the adsorbed DZ, washed with deionized water, and finally dried at 85 °C for further reuse.
3. Results and discussion
3.1. Characterization of the prepared solid adsorbents
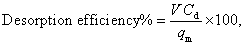
Thermogravimetric curves of CN and FCN are shown in Fig. 1a. CN and FCN exhibited a total decrease in mass of 81.0 and 75.8%, respectively. The first mass decrease in CN and FCN (5.7 and 3.1%, respectively) up to 100 °C is attributed to the elimination of adsorbed water molecules. Furthermore, the solid samples indicated high thermal stability between 100 and 260 °C. The main weight loss (76.7%) for CN between 260 and 400 °C revealed the degradation of cellulose, starting with glycosidic unit decomposition, depolymerization, dehydration, and decarboxylation. The last collapse in CN from 400 to 800 °C is related to char combustion.22 The residual weight (9.0% at 800 °C) for nanocellulose includes anhyrocellulose and levoglucosan.30 Hydrophilic ferric cations were vigorously crosslinked to CN to form FCN, increasing its surface functional groups and improving its thermal stability and adsorption ability.
 |
| | Fig. 1 TGA (a), XRD (b), nitrogen adsorption/desorption isotherm (c), FTIR (d), and point of zero charge (f) curves for CN and FCN, in addition to FTIR of DZ-FCN (e). | |
XRD curves for all the solid adsorbents are depicted in Fig. 1b. The typical peaks of CN were found at 2θ of 15.3, 22.5, and 34.5°, belonging to (101), (002), and (004) planes, respectively, and representing cellulose I structure.31 No doublet was observed at 2θ = 22.5°, showing the formed crystalline structure of cellulose during the extraction process. The index of crystallinity was evaluated using eqn (1), and the obtained data are found in Table 1, indicating that the index of CN and FCN crystallinity (Ict) is about 77.4 and 61.6%, respectively. The high CN crystallinity results from the removal of amorphous hemicellulose and lignin polymers from the loofah sponge during CN synthesis. The modification of CN with ferric ions resulted in a decrease in FCN crystallinity, which may be due to the effects of ferric ions on the crystalline regions, destructing hydrogen bonds and producing further amorphous regions in cellulose.32
Table 1 Point of zero charge and textural parameters for CN and FCN
| Sample |
pHPZC |
SBET (m2 g−1) |
VT (cm3 g−1) |
(nm) |
Ict |
| CN |
7.4 |
87.87 |
0.3084 |
14.04 |
77.4 |
| FCN |
7.0 |
82.65 |
0.2898 |
14.02 |
61.6 |
The nitrogen adsorption/desorption isotherms for the prepared adsorbents are depicted in Fig. 1c. The textural results for CN and FCN are listed in Table 1. Upon IUPAC classification, all the adsorbents showed a mixture of adsorption isotherms of types II and IV with H3-type hysteresis loops that contain the nanomaterial aggregation with slit-like pores and monolayer-multilayer adsorption onto mesoporous adsorbents.33 Based on the results found in Table 1, the incorporation of ferric ions in nanocellulose particles decreased the specific surface area from 87.87 to 82.65 m2 g−1 (5.9% loss) owing to the blocking of some pores, proving that the total pore volume of CN > FCN. The average pore diameters of CN (14.04 nm) and FCN (14.02 nm) revealed the mesoporosity of solid adsorbents.
FTIR spectra of CN and FCN are shown in Fig. 1d to investigate their surface functional groups. Nanocellulose exhibited characteristic peaks located at 666, 898, 1240, 1321, 1370, 1430, and 2900 cm−1 related to C–O–H bending mode, (C–C–O, C–O–C, and C–C–H) deformation modes of pure cellulose, O–C stretching of phenolics, C–O–H vibration, H–C stretching, CH2 bending vibration, and CH3 groups, respectively. The bands in the range of 1059–1162 cm−1 belong to the saccharide structure in nanocellulose, while the peaks at 3347 and 1639 cm−1 correspond to the O–H stretching and adsorbed water of carbohydrates. All the previous signals illustrate that nanocellulose is type I, which agrees with XRD spectra.34 Further, the crosslinking between hydroxyl groups of CN and ferric ions was proven by the increase in absorption intensity, and the appearance of C–O–Fe stretching at 1070 cm−1 and O–Fe bond at 562 cm−1 that is responsible for FCN nanocomposite stability.32,35 As demonstrated in Fig. 1e (FTIR of DZ-FCN), there is an obvious displacement in bands after DZ adsorption and the appearance of new bands of diazinon located at 655, 829, and 1020 cm−1 related to the stretching vibration of P![[double bond, length as m-dash]](https://www.rsc.org/images/entities/char_e001.gif) S, P–O, and (P–O–CH3, C–O, and C–N stretching), respectively, confirming the success of the adsorption process.36
S, P–O, and (P–O–CH3, C–O, and C–N stretching), respectively, confirming the success of the adsorption process.36
The estimated pHPZC values of CN and FCN are 7.4 and 7.0, respectively, as illustrated in Fig. 1f and listed results in Table 1. Ferric ions as a Lewis acid are responsible for the decrease in pHPZC for FCN compared with that for CN.
Morphologies of CN and FCN were examined using SEM and TEM, respectively. Fig. 2a and b shows SEM images of the samples where the nanocellulose surface displayed a regular spherical porous structure with homogeneously distributed crystalline nanoparticles owing to the elimination of the amorphous regions, abiding the ideal synthesis of nanocellulose. The crosslinking of ferric ions with cellulose chains resulted in the shrinking and deformation of the FCN particles. EDX analysis of FCN displayed that surface atoms comprise 53.43% carbon atoms, 46.42% oxygen atoms, and 0.15% ferric atoms, as depicted in Fig. 2c. TEM images are shown in Fig. 2d and e where the particle size increased from 25.4 nm for CN to 86.0 nm for FCN because of the incorporation of ferric ions, causing aggregation of nanoparticles.
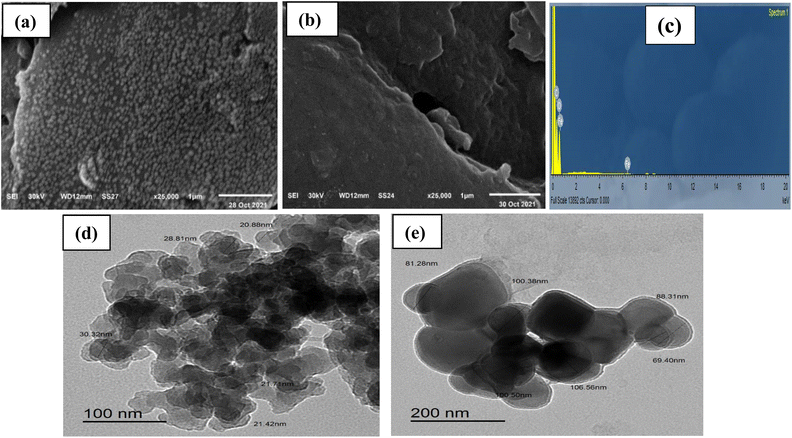 |
| | Fig. 2 SEM (a, b) and TEM (d, e) images for CN and FCN, respectively, in addition to EDX of FCN (c). | |
3.2. Investigation of diazinon adsorption onto CN and FCN
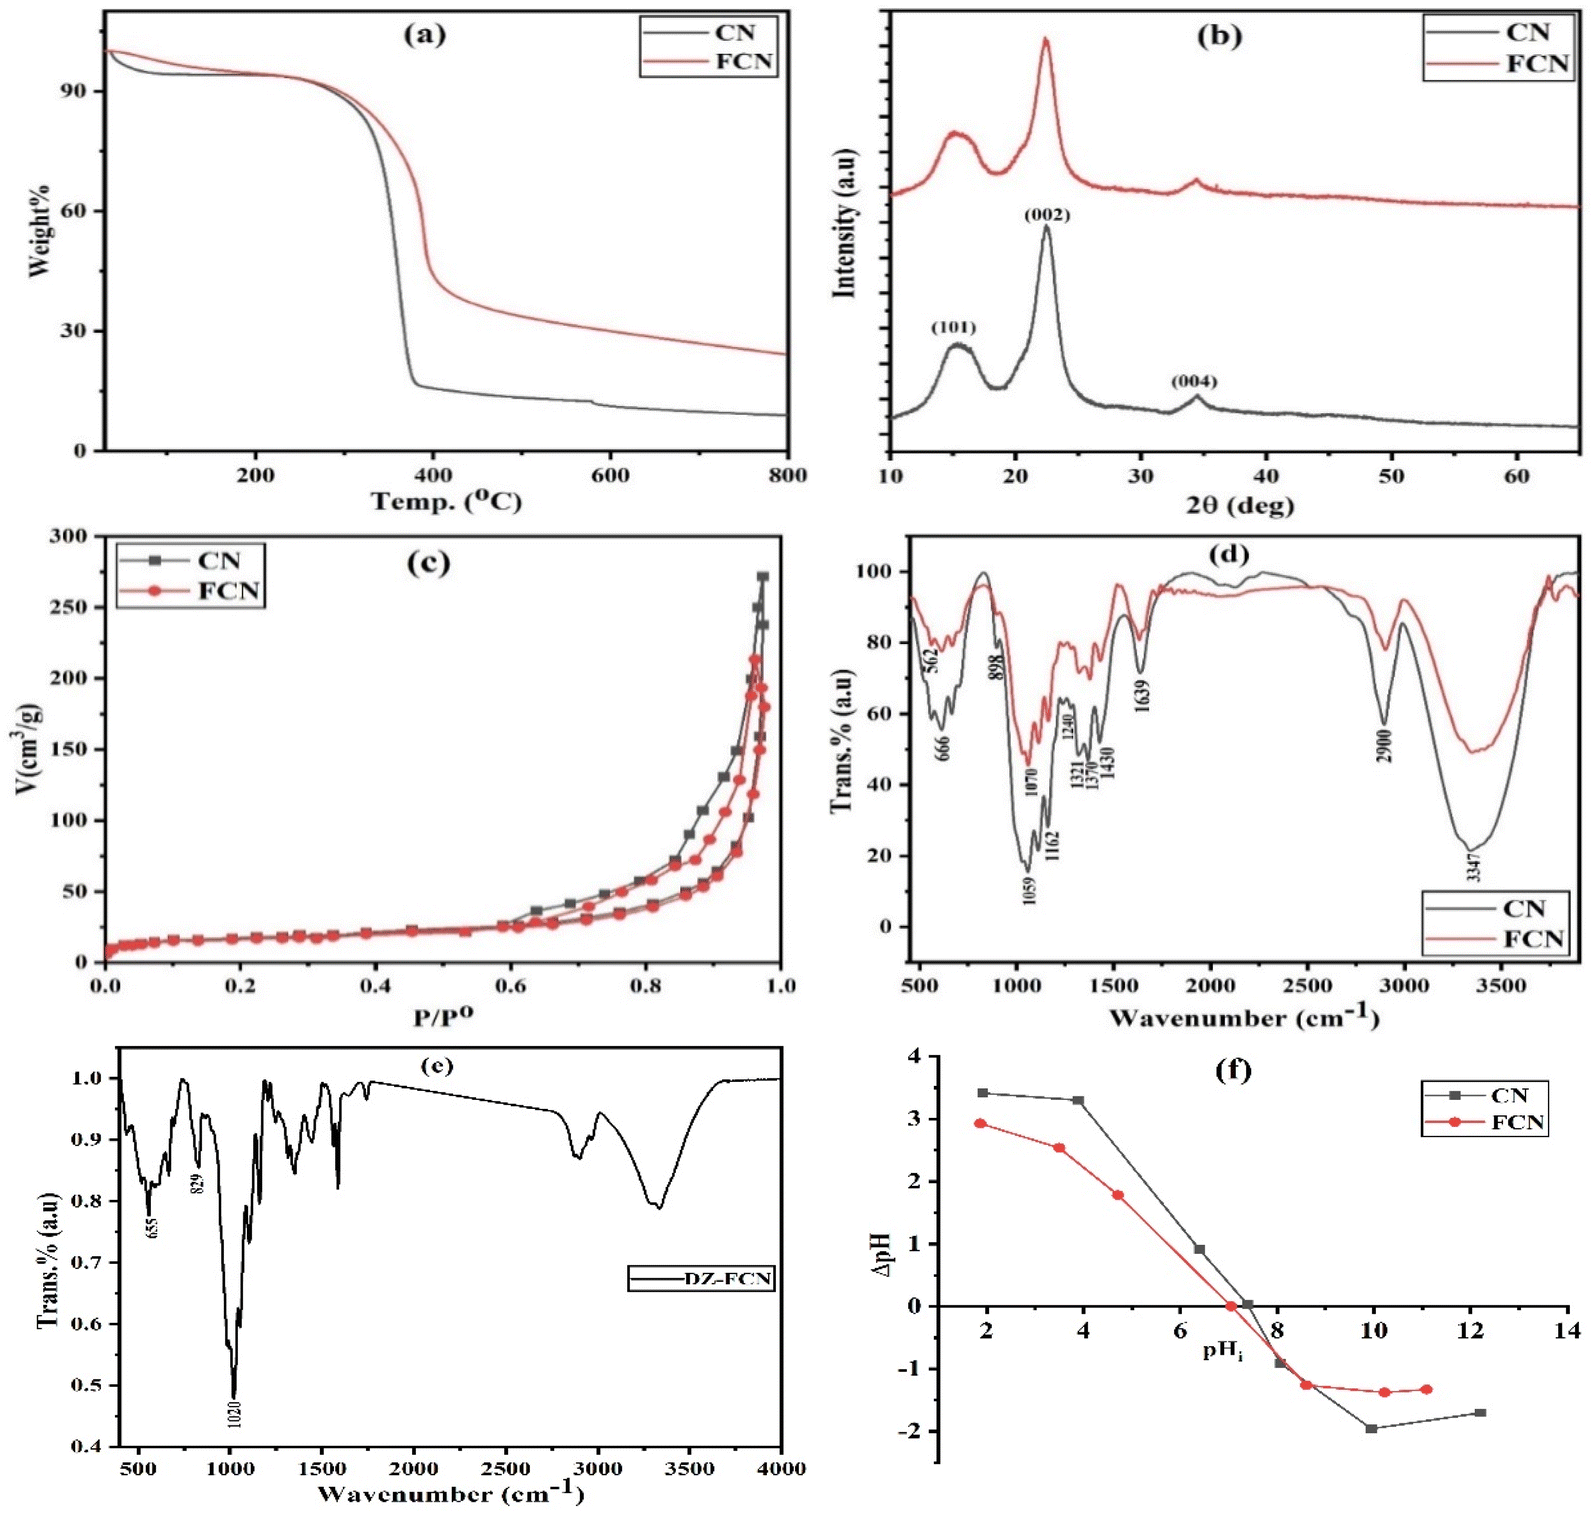
3.2.1. Effect of adsorbent dose. The effect of the adsorbent dose (0.25 to 1.60 g L−1) on the removal percent (R%) of DZ from 50 mL of 400 mg L−1 DZ concentration at pH 7, 30 °C, and for 24 h of shaking time, was evaluated using eqn (2), as shown in Fig. 3a. The increment in adsorbent amount from 0.25 to 1.50 g L−1 was followed by providing more accessible adsorption sites, enhancing the DZ removal percent (8.0 and 2.4 times for CN and FCN, respectively). The maximum DZ removal was obtained when 1.50 g L−1 adsorbent was used, in which CN and FCN achieved 50.0 and 91.5% of R%, respectively. At a definite dose (>1.50 g L−1), the removal percent remained constant. This can be attributed to the adsorption equilibrium achieved at a lower DZ concentration.
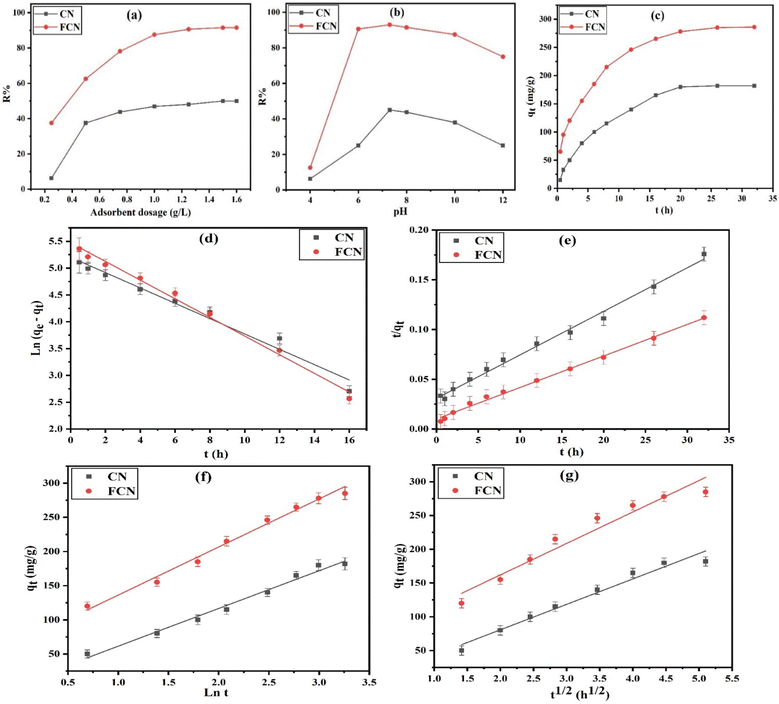 |
| | Fig. 3 Effect of adsorbent dosage (a), pH at 30 °C (b), shaking time at 38 °C, (c) effects, pseudo-first order (d), pseudo-second order (e), Elovich (f), and intra-particle diffusion (g) plots for the DZ adsorption onto CN and FCN. | |
3.2.2. Effect of pH of the solution. The pH of a solution that includes adsorbate is an essential factor in the adsorption process. The effect of pH levels ranging from 4 to 12 was studied on the removal percent (R%) of DZ from a solution containing 50 mL of 400 mg L−1 concentration of DZ, 1.0 g L−1 of adsorbent, for a shaking time of 24 h, and at 30 °C. It is necessary that the effect of diazinon hydrolysis be considered in the calculation of the removal percent. The diazinon compound is highly unstable and rapidly degraded at acidic pH solution, where its hydrolysis was accelerated, and diazinon pKa is 2.6.37,38 As shown in Fig. 3b, the actual DZ adsorption increased from 6.25 and 12.5% at pH 4 to 45.0 and 93.0% at pH 7.3 for CN and FCN, respectively. However, DZ adsorption began to decrease at a pH level of over 7.3. Considering the pHPZC of CN and FCN (7.4 and 7.0, respectively), the adsorbent surface is positively charged at pH < pHPZC owing to the hydroxyl group protonation onto the surface and negatively charged at pH > pHPZC. Additionally, at a pH level of over pKa (2.6), the diazinon molecules started to dissociate to anionic species that were electrostatically attracted to the positively charged CN and FCN surfaces. Therefore, at a greater pH level above pKa, the diazinon dissociation degree is higher, and more negatively charged molecules are attracted to the positively charged surface, achieving a higher removal percent of diazinon at pH 7.3. At higher pH above pHPZC, the decline in DZ removal can be illustrated by the negatively charged surfaces that resulted in electrostatic repulsion with the anionic diazinon molecules, causing a decline in the adsorption of diazinon as the conditions to become more alkaline.27 Here, R% decreased from 45.0 and 93.0% at pH 7.3 and from 25.0 and 75.0% at pH 12 for CN and FCN, respectively. Thus, the optimum condition of pH attained at pH 7.3, around neutral pH, is considered an advantage to CN and FCN compared with other adsorbents that need an acidic medium for the removal of pesticides, making the process cheap and more effective.
3.2.3. Kinetic study of diazinon adsorption. To investigate the time required to accomplish the diazinon adsorption process and its rate, the kinetic study of the process was performed using CN and FCN in a shaking time range of 0.5 to 32 h, at 38 °C, 50 mL of 400 mg L−1 DZ concentration, 1.0 g L−1 of adsorbent dosage, and pH 7. As illustrated in Fig. 3c, by increasing the shaking time, the adsorption capacity increased by 12.0 and 4.3 times for CN and FCN, respectively, in 20 h owing to the availability of active surface sites at the first time.39 Then, the rate of adsorption began to decrease after 20 h until it remained unchanged after 26 h owing to the depletion of active sites with DZ molecules. Thus, the equilibrium time of CN and FCN occurred at 20 h. The kinetic parameters of DZ adsorption onto CN and FCN were discussed for the linear PFO (eqn (4)), PSO (eqn (6)), Elovich (eqn (7)), and intra-particle diffusion (eqn (8)) plots, as depicted in Fig. 3d–g, and the data are summarized in Table 2. To check the resulting values in Table 2, (i) the adsorption of DZ onto CN was fitted by the PFO kinetic model based on the higher correlation coefficient value (0.9721) and the extremely small variance between the adsorption capacity (qm) of Langmuir and the estimated value (qexp) of PFO (0.92%). However, PFO did not fit DZ adsorption onto FCN because of the large difference between the previous adsorption capacities (23.7%), which outperformed the high R2 value (0.9910). (ii) Besides the high R2 value (0.9950), the slight variance between qm and qexp values (4.6%) confirmed the best fit of PSO onto FCN. However, the DZ adsorption onto CN was not applied by the PSO kinetic model based on the high difference (21.8%) between the adsorption capacity values of the Langmuir and PSO models although the R2 value is high. Thus, it was suggested that the DZ adsorption rate relied on two parameters represented in the concentration of diazinon only for CN and in the concentration of DZ and active surface sites for FCN. (iii) Based on R2 > 0.9836 obtained from the Elovich model, DZ adsorption followed this model. α value of FCN is 2.98 times more than that of CN, proving the increment in FCN adsorption capacity and its initial rate. Additionally, surface coverage by DZ onto CN was completed before FCN based on β of CN than that of FCN by 1.25 times, confirming the higher surface functional groups onto FCN than that onto CN. (iv) In the case of the intra-particle diffusion kinetic model, R2 > 0.9420 showed the best description of this model for diazinon adsorption onto the prepared adsorbents. The results had intercepts (C), indicating that DZ adsorption did not depend on the effect of intra-particle diffusion only. The rate constant (k0) values (37.681 and 46.611 for CN and FCN, respectively) revealed a higher attraction force between the DZ molecules and new chemical functional groups onto the FCN surface. The positive values of C of FCN > CN revealed the fast adsorption of diazinon onto the FCN surface through a short time40 and FCN depicted a 12.9 times higher boundary layer effect than CN.
Table 2 Pseudo-first, pseudo-second order, Elovich, and intra-particle diffusion kinetic models at 38 °C and thermodynamic parameters for the DZ adsorption onto CN and FCN
| Models |
Parameters |
|
CN |
FCN |
| PFO |
qm (mg g−1) |
|
192.68 |
294.98 |
| qexp (mg g−1) |
|
194.46 |
225.07 |
| k1 (h−1) |
|
0.1425 |
0.1734 |
| R2 |
|
0.9721 |
0.9910 |
| PSO |
qexp (mg g−1) |
|
234.78 |
308.57 |
| k2 ×10−4 (g mg−1 h−1) |
|
6.251 |
9.989 |
| R2 |
|
0.9924 |
0.9950 |
| Elovich |
α (mg g−1 h−1) |
|
61.169 |
182.170 |
| β (g mg−1) |
|
0.0180 |
0.0144 |
| R2 |
|
0.9836 |
0.9867 |
| Intra-particle diffusion |
k0 (mg g−1 h−1/2) |
|
37.681 |
46.611 |
| C |
|
5.319 |
68.727 |
| R2 |
|
0.9671 |
0.9420 |
| Thermodynamic parameters |
R2 |
|
0.9982 |
0.9862 |
| ΔH° (kJ mol−1) |
|
14.976 |
7.366 |
| ΔS° (kJ mol−1 K−1) |
|
0.0636 |
0.0403 |
| −ΔG° (kJ mol−1) |
20 °C |
3.653 |
4.456 |
| 30 °C |
4.267 |
4.829 |
| 38 °C |
4.800 |
5.185 |
| |
Kd |
20 °C |
4.48 |
6.23 |
| 30 °C |
5.44 |
6.80 |
| 38 °C |
6.40 |
7.43 |
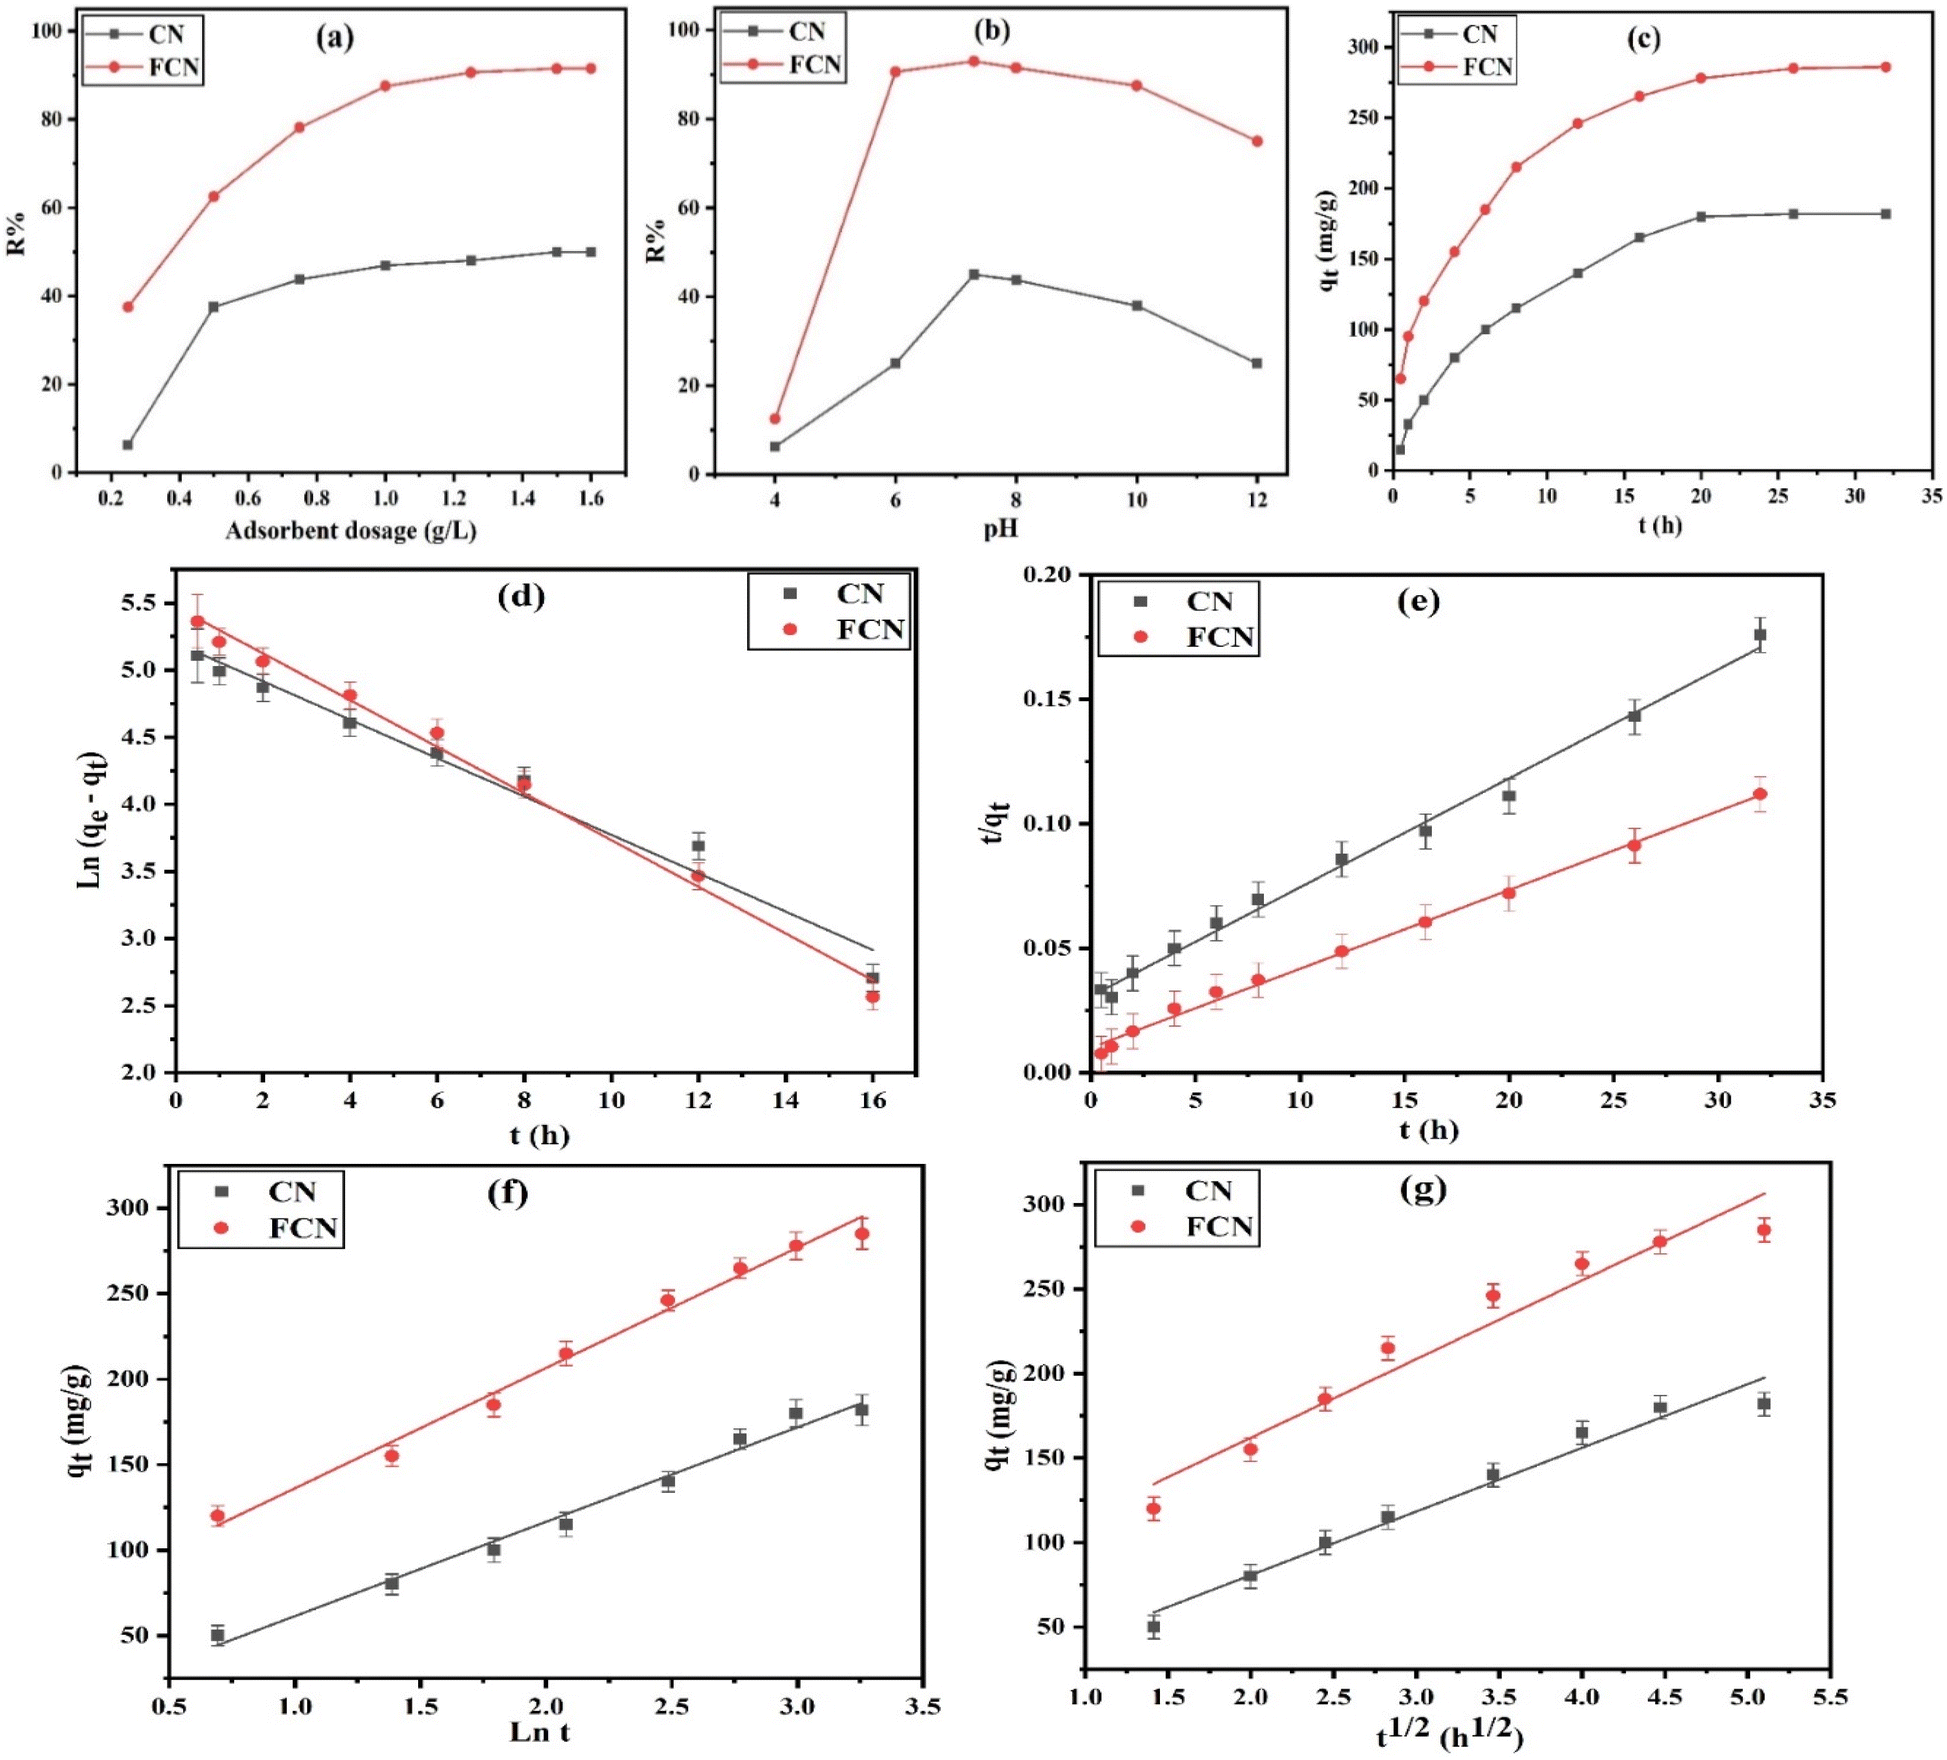
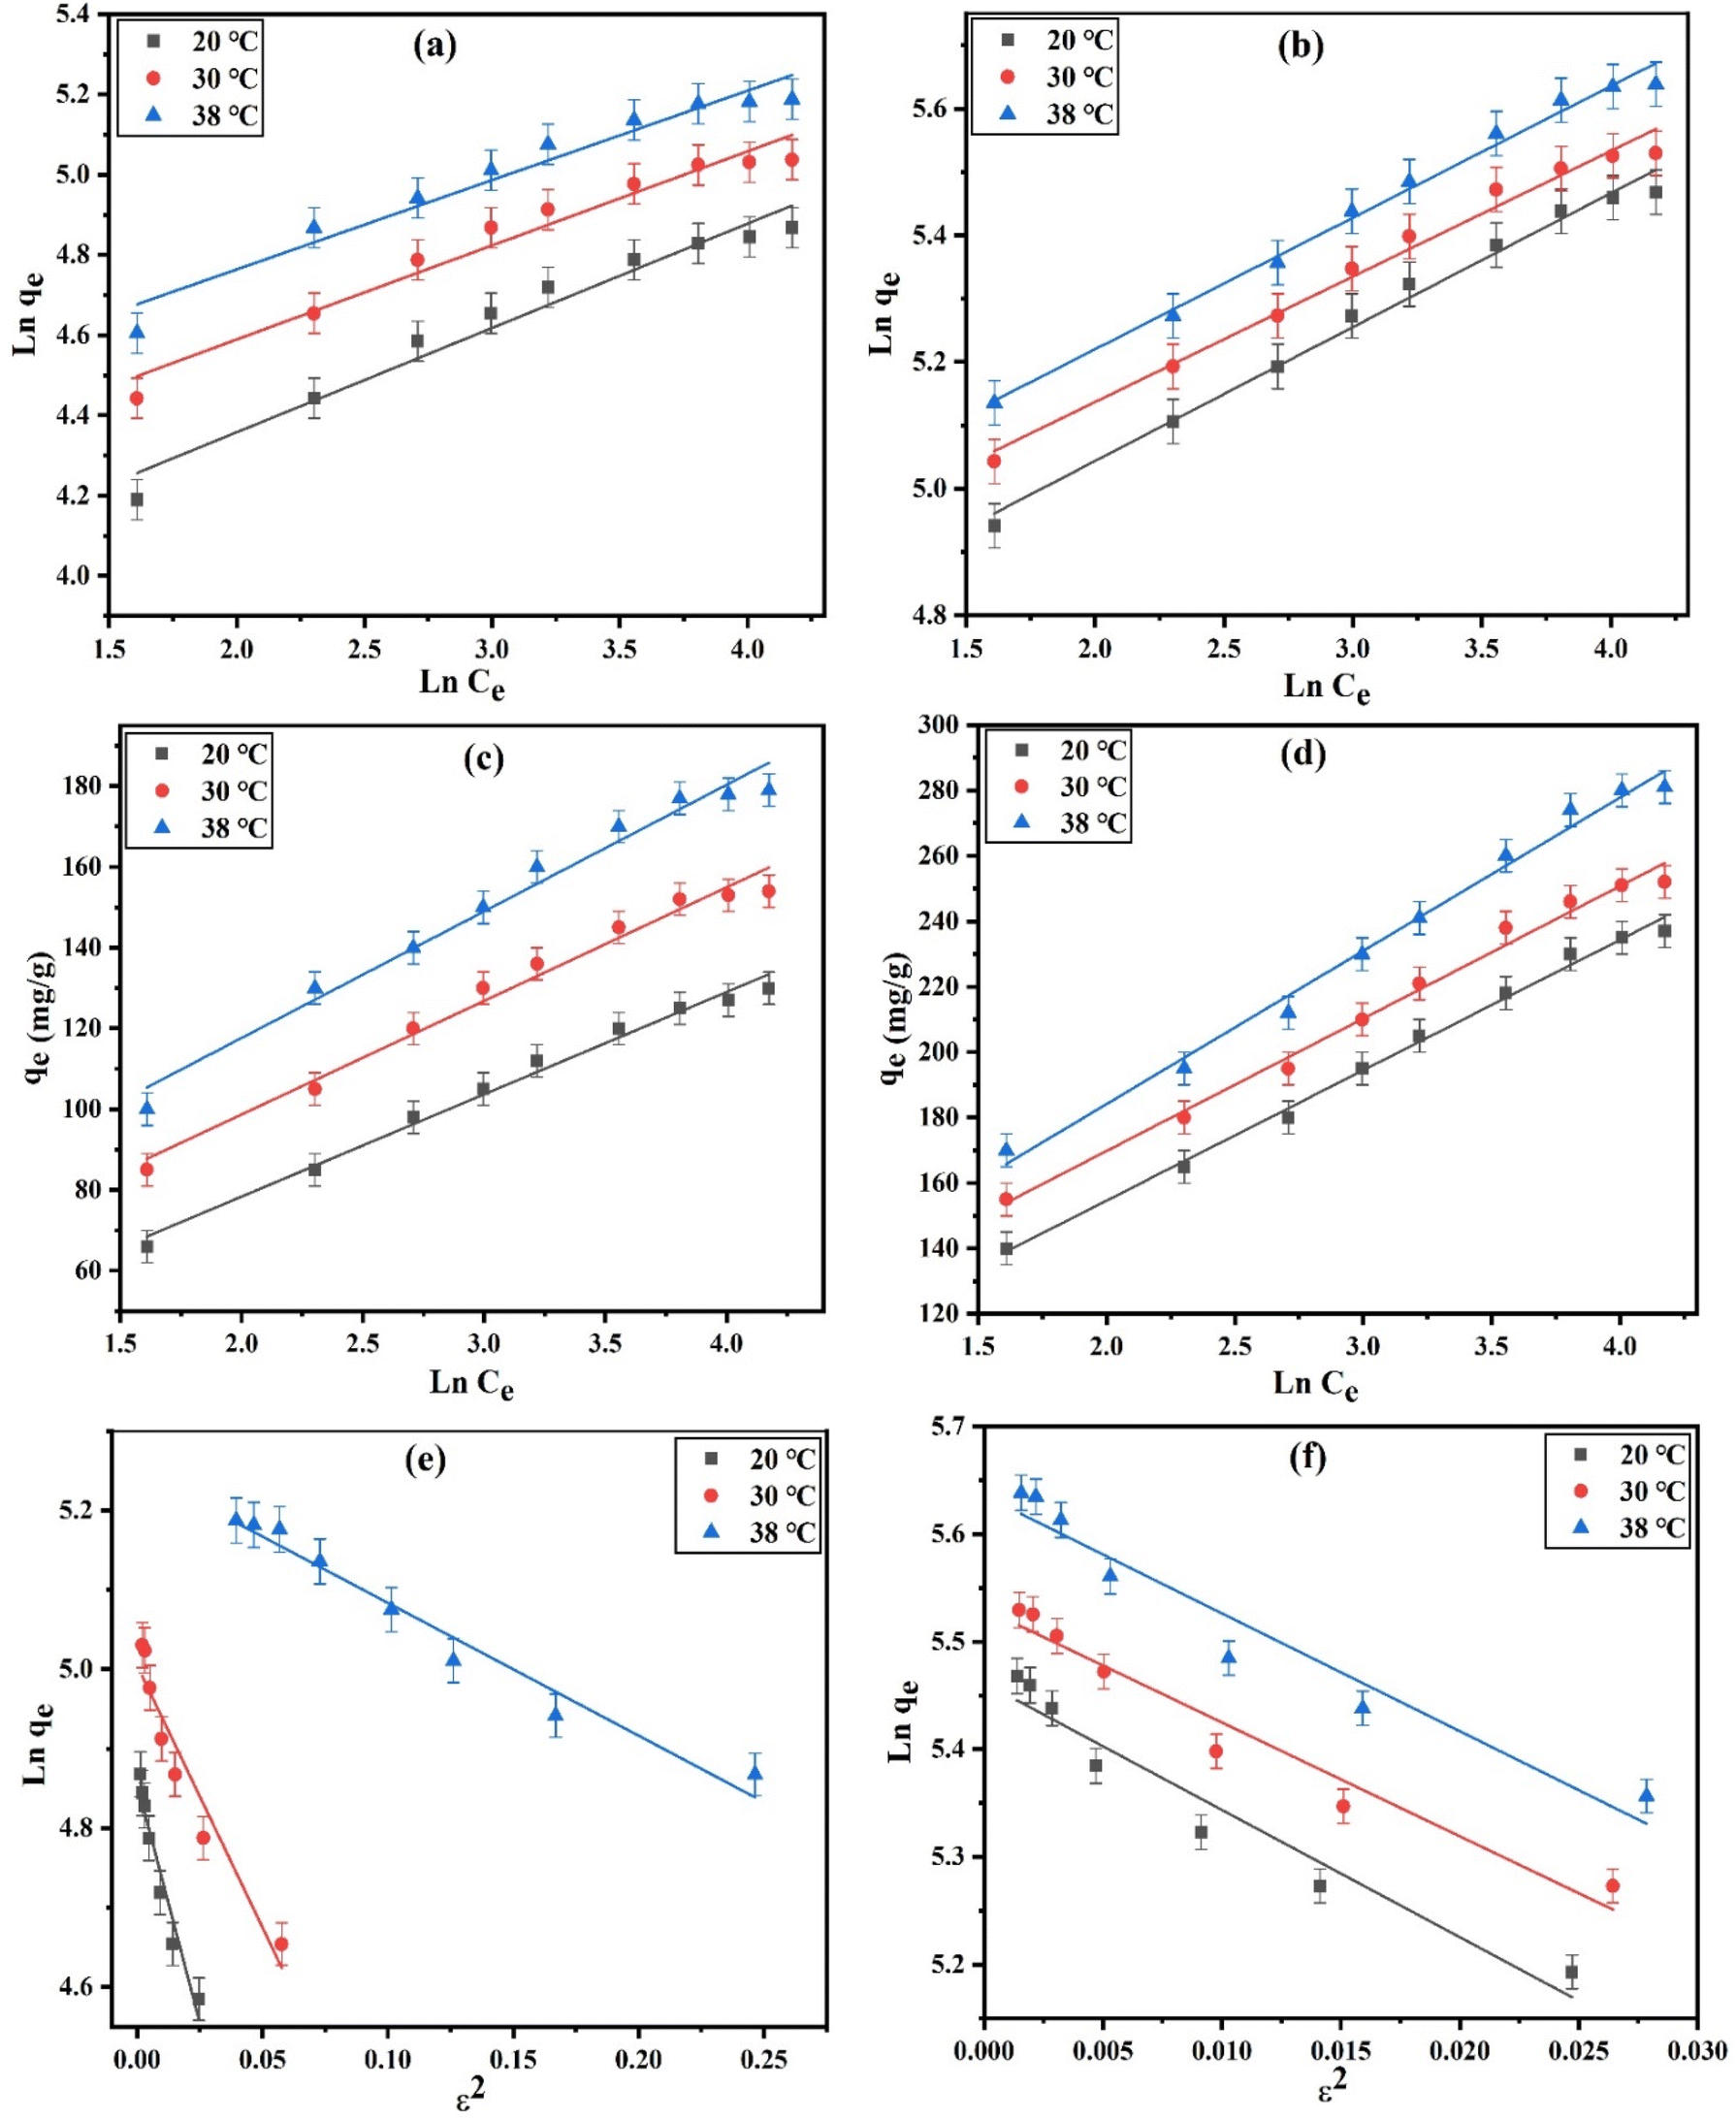
3.2.4. Adsorption isotherms. The distribution of an adsorbate between the solid and liquid phases at equilibrium can be described using adsorption isotherms. The temperature effects (20, 30, and 38 °C) on the DZ adsorption onto CN and FCN were discussed by utilizing 30 to 360 mg L−1 of initial DZ concentration, 20 h of contact time, 1.0 g L−1 of adsorbent weight, and at pH 7, as depicted in Fig. 4a and b. Fig. 4a and b illustrates that the adsorption capacity (qe, mg g−1) of DZ observably increased at a lower initial DZ concentration, which is related to the high abundance of active sites in the DZ concentration until adsorption remained stable at higher DZ concentrations due to the completely available active site coverage. To find the best isotherm models that match well with the experimental adsorption data, four adsorption isotherms (eqn (9), (11), (12), and (15)) were examined and the resulting data are shown in Table 3.
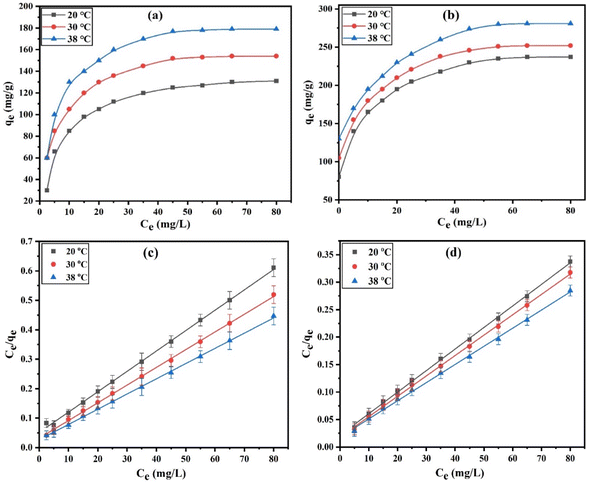 |
| | Fig. 4 Adsorption isotherms of DZ (a and b) and Langmuir plots (c and d) for CN and FCN, respectively, at 20, 30, and 38 °C. | |
Table 3 Langmuir, Freundlich, Temkin, and Dubinin–Radushkevich parameters for adsorption of DZ onto CN and FCN at 20, 30, and 38 °C
| Parameters |
CN |
FCN |
| 20 °C |
30 °C |
38 °C |
20 °C |
30 °C |
38 °C |
| Langmuir |
| qm (mg g−1) |
144.09 |
165.29 |
192.68 |
248.76 |
263.85 |
294.98 |
| b (L mg−1) |
0.1372 |
0.1986 |
0.2124 |
0.2480 |
0.2762 |
0.3153 |
| RL |
0.0411 |
0.0249 |
0.0208 |
0.0144 |
0.0123 |
0.0098 |
| R2 |
0.9987 |
0.9993 |
0.9994 |
0.9957 |
0.9964 |
0.9953 |
|
| Freundlich |
| 1/n |
0.2598 |
0.2343 |
0.2226 |
0.2114 |
0.2072 |
0.2002 |
| KF |
46.44 |
61.58 |
75.06 |
101.59 |
114.48 |
122.08 |
| R2 |
0.9581 |
0.9547 |
0.9447 |
0.9875 |
0.9836 |
0.9898 |
|
| Temkin |
| bT (J mol−1) |
96.197 |
89.588 |
82.484 |
62.851 |
59.992 |
55.206 |
| KT (L g−1) |
2.987 |
4.525 |
5.769 |
6.553 |
7.945 |
8.428 |
| R2 |
0.9870 |
0.9786 |
0.9742 |
0.9941 |
0.9889 |
0.9890 |
|
| Dubinin–Radushkevich |
| qDR (mg g−1) |
130.55 |
153.38 |
190.93 |
239.22 |
255.63 |
284.99 |
| EDR (kJ mol−1) |
0.2031 |
0.2698 |
0.5455 |
0.2050 |
0.2168 |
0.2130 |
| R2 |
0.9361 |
0.9168 |
0.9640 |
0.9359 |
0.9498 |
0.9319 |
The Langmuir isotherm explained that the growth of the monolayer diazinon adsorption was completed with limitations in the active sites of CN and FCN. As shown in Fig. 4c and d, based on the higher correlation coefficients (0.9953–0.9994), the Langmuir adsorption model applied well the DZ adsorption onto CN and FCN. Adsorption capacities enhanced the increment in temperature from 20 to 38 °C, indicating the endothermic nature of DZ adsorption onto the studied adsorbents. FCN had higher adsorption capacities at all temperatures than CN by 72.6, 59.6, and 53.1% at 20, 30, and 38 °C, respectively, and this is related to the existence of several chemical functional groups on the FCN surface. Furthermore, the anionic species of diazinon after the hydrolysis process in acidic and neutral media rapidly tended toward ferric ions considering the Lewis acid on the FCN surface. Langmuir binding constant values (b, L mg−1) increased with temperature and were higher in FCN than in CN, revealing the higher binding force between the adsorbent surface, especially FCN, and DZ molecules at 38 °C.41 The good favorability of DZ adsorption onto CN and FCN was indicated from the RL values (0.0098–0.0411) calculated from eqn (10).
Fig. 5a and b elucidates the linear plots of the Freundlich model for DZ adsorption onto CN and FCN at 20, 30, and 38 °C. The good applicability of this model was achieved from the higher R2 values (>0.9447), dominating the heterogeneous multilayer adsorption of DZ onto the investigated adsorbents, in addition to the homogenous monolayer adsorption resulting from the Langmuir isotherm. The enhancement of temperature increased the values of KF by 1.1–1.3 times as with Langmuir adsorption capacity values. In addition, the improvement in surface heterogeneity resulted from the decline in adsorption intensity (1/n) with temperature. The 1/n values (<1) demonstrated the physical adsorption of DZ onto CN and FCN. Moreover, these values (0.1 < 1/n < 1.0) between 0.2002 and 0.2598 abided by the favorability and rapidness of DZ adsorption.19
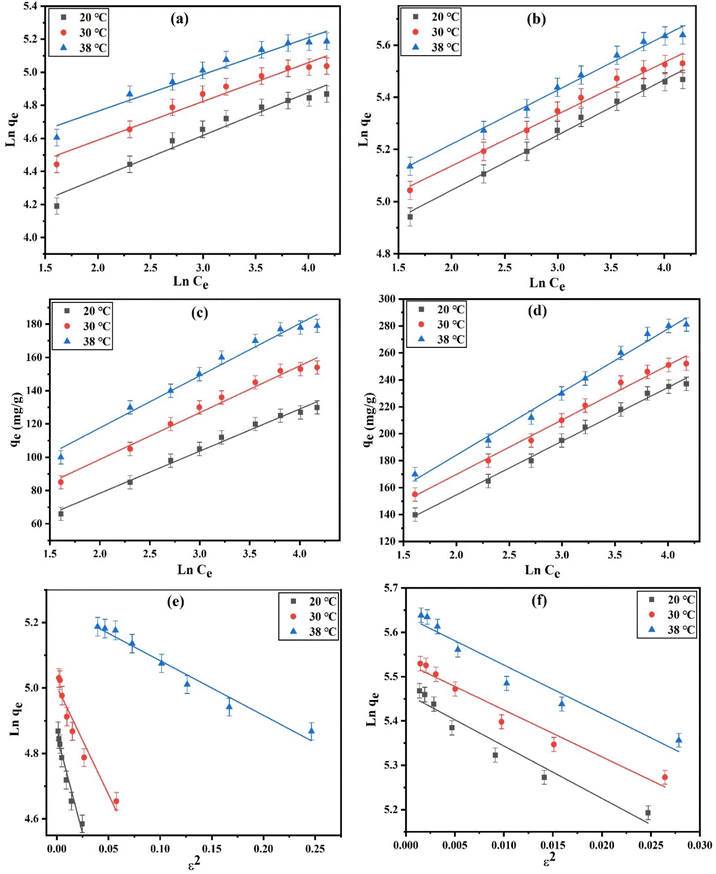 |
| | Fig. 5 Linear Freundlich (a and b), Temkin (c and d), and Dubinin–Radushkevich (e and f) plots for the DZ adsorption onto CN and FCN, respectively, at 20, 30, and 38 °C. | |
According to Fig. 5c, d and the data in Table 2, the higher correlation coefficients (0.9742–0.9941) confirmed the best fitting of the Temkin isotherm. The evaluated Temkin constants (KT, L g−1) increased by 1.1–1.5 times with temperature, indicating an increase in DZ adsorption at the elevated temperature. The Temkin model parameter values (bT < 8000 J mol−1) in the range of 55.206–96.197 J mol−1 confirmed the physisorption process of DZ onto the studied adsorbents and also decreased as the temperature increased, indicating that FCN at 38 °C needed the least heat of adsorption.42
Dubinin–Radushkevich isotherm plots for diazinon adsorption at the studied temperatures onto the CN and FCN are depicted in Fig. 5e and f. The slight difference (0.9–9.4%) between Langmuir adsorption capacities (qm) and qDR of Dubinin–Radushkevich isotherm as well as the higher R2 > 0.9168 evidenced good agreement of this isotherm with the equilibrium adsorption data. The adsorption nature can be determined from the values of the mean free energy (EDR, kJ mol−1). The physisorption process is achieved if EDR is less than 8 kJ mol−1, and in the case of 8 < EDR < 16 kJ mol−1, the chemical adsorption is dominant.43 It was observed that the physical adsorption controls DZ adsorption based on the EDR values ranging from 0.2031 to 0.5455 kJ mol−1, as summarized in Table 3. Here, the physisorption was performed through the weak interaction, including the π–π interaction and hydrogen bonding. The chemical functional groups (O, S, and N) on the diazinon surface can form hydrogen bonds with hydroxyl groups on the CN surface or Fe3+ and OH− groups on the FCN surface.44 Diazinon removal by physisorption, compared with chemisorption, is the main method because of the characteristic porous structures of CN and FCN. Thus, DZ removal was suggested to be physically adsorbed within the prepared adsorbent pores.
3.2.5. Effect of ionic strength. The ionic strength effect on the removal percent (R%) of diazinon by FCN adsorbent under 1.0 g L−1 of FCN dosage, pH 7, 20 h of shaking time, 400 mg L−1 of initial DZ concentration, and at 38 °C was investigated, as illustrated in Fig. 6a. We used solvents with various ionic strengths (I) (distilled water and (0.1, 0.2, 0.3, 0.5, and 1.0 mol L−1 KCl) with I = 0.0, 0.1, 0.2, 0.3, 0.5, and 1.0 mol L−1, respectively). It was observed that DZ adsorption decreased as the ionic strength increased, where R% decreased from 85.0 to 40.0% as I increased from 0.0 to 1.0 mol L−1. The ionic strength depending on the adsorbate uptake is sometimes considered proof of the coordination of inner-sphere or outer-sphere. Ions forming outer-sphere complexes compete for active adsorption sites with species of the supporting electrolyte. In this study, the adsorbate uptake decrease resulted when the concentration of electrolyte was increased.45 Thus, the diazinon uptake amount decreased as the negatively charged chloride ion concentrations increased because of the possible binding between these ions and the positively charged functional groups (ferric ions) onto the FCN, thereby increasing the repulsion between the anionic diazinon species and the surface.46 Furthermore, chloride ions competed with anionic DZ species on active surface sites.45 As the ionic strength increased, more ions (K+ and Cl−) screened the active charged sites, leading to the electrostatic attraction suppression between DZ and FCN surfaces.47 We concluded that distilled water was the best solvent compared to the other solvents used for the elimination of DZ from wastewater.
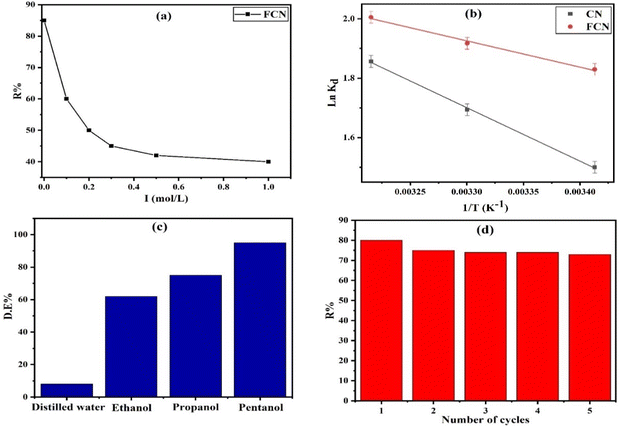 |
| | Fig. 6 Ionic strength effect on FCN (a), van't Hoff plot of the prepared adsorbents (b), desorption of DZ from FCN using various eluents (c), and reusability of FCN after five adsorption/desorption cycles (d). | |
3.2.6. Thermodynamics of diazinon adsorption. Thermodynamic parameters, including the change in enthalpy (ΔH°), entropy (ΔS°), and Gibbs free energy (ΔG°), are essential for investigating the DZ adsorption process. Thermodynamic data were evaluated using eqn (17)–(19) and tabulated in Table 2. First, (i) the ΔH° values are positive (7.366–14.976 kJ mol−1), which indicates the endothermic diazinon adsorption onto CN and FCN and lower than 40 kJ mol−1, reflecting the diazinon physisorption onto the solid adsorbents.25 Moreover, the enthalpy value of CN is 2 times more than that of FCN, which indicates that FCN consumed the least heat of adsorption, facilitating the adsorption process and agreeing with the data resulting from bT of the Temkin model. (ii) Because the entropy changes ranging from 0.0403 to 0.0636 kJ mol−1 K−1 are positive, the diazinon concentration increased at the solid/liquid interface, and the change in adsorbent structure was significant.48 Moreover, ΔS° for CN is greater than that of FCN, increasing the DZ randomness at the CN surface. (iii) The negative change in free energy values at all tested temperatures inferred the spontaneous process of DZ adsorption. The negative amounts of ΔG° and positive Kd values increased with temperature, enhancing the adsorption of DZ at a higher temperature. (iv) If the free energy changes range from −400 to −80 and −20 to 0 kJ mol−1, then the process is chemisorption and physisorption, respectively.43 Thus, the ΔG° values (−3.653 to −5.185) revealed the physical adsorption of diazinon. (v) The best correlation of the van't Hoff plot (Fig. 6b) with DZ adsorption was shown from the higher values R2 (>0.9862). It was concluded that FCN has the highest negative ΔG° and positive Kd values at all temperatures, revealing the high facility and velocity of DZ adsorption onto the FCN surface.
3.2.7. Adsorption mechanisms. The correct interaction between diazinon and the prepared samples was well illuminated by FTIR analysis of FCN after DZ adsorption. We know from the discussion section that diazinon hydrolyzes into anionic species at pH values greater than pKa (2.6), and the physical adsorption is performed through weak interactions, representing the π–π interaction and hydrogen bonding. Thus, the hydroxyl groups on the CN surface or Fe3+ and OH− groups on the FCN surface can interact by hydrogen bonding with the chemical functional groups (O, S, and N) on the diazinon surface, as confirmed in the FTIR discussion of DZ-FCN by the appearance of new bands of diazinon merging with the bands of FCN.49
3.3. Desorption and regeneration study
The regeneration study determines the reusability of FCN, which contributes to the reactivity, stability, and cost-effectiveness of the adsorbent. The results of the desorption of DZ and reusability by FCN are shown in Fig. 6c and d, respectively. In this study, the desorption process was done using several eluents, where efficient desorption was achieved by the following trend (pentanol > propanol > ethanol > distilled water as 95, 75, 62, and 8%, respectively). The previous data are based on the acidity degree of each eluent, where pentanol has the lowest acidity between them and yields fewer protons in the solution. Thus, the protonation of surface groups of FCN decreased in the presence of pentanol, reducing the positive charges onto the surface and also the electrostatic attraction between anionic DZ species and FCN surface. The regeneration of the FCN was performed for five cycles of diazinon adsorption. It was observed that the DZ removal percent was slightly decreased by the regeneration cycles from 80% to 73% and changed by 8.8% only. This decrease may be caused by the loss of the FCN powder during the regeneration process, incomplete desorption of DZ from the adsorbent surface, coagulation of FCN particles, and/or losing some surface functional groups.43,44,50 The obtained results demonstrate that FCN exhibits a high removal percent of diazinon with high recyclability.
3.4. Efficiency comparison
To compare the adsorption capacity of the FCN adsorbent with those of the other adsorbents, their maximum adsorption capacities are listed in Table 4, considering the adsorption conditions mentioned in each study.27,36,38,50–54 As presented in Table 4, the adsorption capacity of FCN is higher than those of the other solid adsorbents. Therefore, the studied FCN is considered an excellent solid adsorbent with good reactivity, reusability, and applicability for DZ removal from wastewater.
Table 4 Comparison of maximum adsorption capacity of FCN with other solid adsorbents
| Adsorbents |
Adsorption conditions |
qm (mg g−1) |
References |
| Chemically modified H3PO4 |
2.0 g L−1, pH 7, 2 h, 25 °C |
10.33 |
27 |
| NH4Cl-induced activated carbon |
0.2 g L−1, pH 7, 6 h, 25 °C |
250.00 |
38 |
| Chitosan/carbon nanotube |
0.5 g L−1, pH 5.5, 1 h, 25 °C |
222.86 |
50 |
| Fe3O4 – guar gum |
10.0 g L−1, pH 7, 3 h, 25 °C |
47.17 |
51 |
| Fe3O4 – guar gum-montmorillonite |
10.0 g L−1, pH 7, 3 h, 25 °C |
80.00 |
51 |
| Fe3O4/SiO2–NH2 nanocrystals |
0.004 g L−1, pH 6, 0.42 h, 25 °C |
206.18 |
52 |
| Ordered mesoporous silica |
0.1 g L−1, pH 6, 1.5 h, 25 °C |
142.00 |
53 |
| Propyl methacrylate-modified ordered mesoporous silica |
0.1 g L−1, pH 6, 1.5 h, 25 °C |
254.00 |
53 |
| Loess |
1.0 g L−1, pH 7, 24 h, 25 °C |
24.69 |
54 |
| Activated carbon |
1.0 g L−1, pH 7, 24 h, 25 °C |
202.75 |
54 |
| MIL-101(Cr) |
0.75 g L−1, pH 7, 1.1 h, 25 °C |
260.43 |
36 |
| FCN |
1.0 g L−1, pH 7, 20 h, 38 °C |
294.98 |
[This research] |
4. Conclusion
In this study, adsorption of diazinon was performed onto two solid nano-adsorbents, namely, cellulose nanoparticles (CN) synthesized from loofah sponge upon green synthesis and ferric-modified nanocellulose composite (FCN). The prepared adsorbents were investigated by thermal, textural, and chemical analyses, indicating that CN and FCN displayed high thermal stability, high surface area (82.65 and 87.87 m2 g−1, respectively), mesoporous particles, pore volume (0.3084 and 0.2898 cm3 g−1, respectively), high crystallinity, nanoparticle size, and abundance of active surface functional groups. Adsorption tests were performed to evaluate the optimum conditions for adsorbent dosage, shaking time, pH, initial adsorbate concentration, ionic strength, and temperature. The optimum pH attained at a pH of 7.3 is considered an advantage, making the process less costly and more effective. FCN demonstrated a higher maximum adsorption capacity than CN by 1.7, 1.6, and 1.5 times at 20, 30, and 38 °C, respectively, because of the incorporation of CN with ferric ions. Based on higher correlation coefficients (0.9168–0.9994), the adsorption of DZ by the prepared solid adsorbents was well fitted by isotherm (Langmuir, Temkin, Freundlich, and Dubinin–Radushkevich) and kinetic models (pseudo-first order for CN, pseudo-second order for FCN, Elovich, and intra-particle diffusion). It was observed that the R% of DZ adsorption was reduced by 52.9% as the ionic strength increased from 0.0 to 1.0 mol L−1. Thermodynamic studies demonstrated the endothermic, spontaneous, physical, fast, and favorable nature of diazinon adsorption onto the investigated samples. The maximum desorption efficiency (95%) was achieved with pentanol, and the regeneration of FCN showed only an 8.8% decrease after five adsorption/desorption cycles. We can conclude that the modification of nanocellulose prepared from a low-cost green source, such as a loofah sponge with ferric ions, is a better step, illuminating that FCN is an excellent promising adsorbent for water treatment from contaminants.
Author contributions
Asaad F. Hassan: supervision, conceptualization, writing-review, methodology, and editing. Walaa A. Shaltout: methodology, software, data curation, writing-original draft. Laila M. Alshandoudi: methodology, writing-review, and editing.
Conflicts of interest
No potential conflict of interest was reported by the authors.
References
- N. Mansouriieh, M. R. Sohrabi and M. Khosravi, Int. J. Environ. Sci. Technol., 2016, 13, 1393–1404 CrossRef CAS
 .
. - M. Köck-Schulmeyer, M. Villagrasa, M. López de Alda, R. Céspedes-Sánchez, F. Ventura and D. Barceló, Sci. Total Environ., 2013, 458–460, 466–476 CrossRef PubMed .
- S. E. Ban, E. J. Lee, D. J. Lim, I. S. Kim and J. W. Lee, Bioresour. Technol., 2022, 348, 126828 CrossRef CAS PubMed .
- E. Okada, M. Allinson, M. P. Barral, B. Clarke and G. Allinson, Water Res., 2020, 168, 115139 CrossRef CAS PubMed .
- B. Maddah, S. S. Javadi, A. Mirzaei and M. Rahimi-Nasrabadi, J. Liq. Chromatogr. Relat. Technol., 2015, 38, 208–214 CrossRef CAS .
- M. Bayat, A. Alighardashi and A. Sadeghasadi, Environ. Technol. Innovation, 2018, 12, 148–159 CrossRef .
- A. Abdel-Fattah Mostafa, M. T. Yassin, T. M. Dawoud, F. O. Al-Otibi and S. R. Sayed, Environ. Res., 2022, 212, 113421 CrossRef CAS PubMed .
- P. Mahmoudpoor Moteshaker, S. Saadi and S. E. Rokni, Water Environ. Res., 2020, 92, 975–986 CrossRef CAS PubMed .
- H. Fakhri, M. Farzadkia, R. Boukherroub, V. Srivastava and M. Sillanpää, J. Sol. Energy, 2020, 208, 990–1000 CrossRef CAS .
- H. Hossaini, G. Moussavi and M. Farrokhi, Sep. Purif. Technol., 2017, 174, 320–330 CrossRef CAS .
- P. Sun, Y. L. Gao, C. Xu and Y. F. Lian, RSC Adv., 2018, 8, 10277–10283 RSC .
- S.-E. Ban, E.-J. Lee, D.-J. Lim, I.-S. Kim and J.-W. Lee, Bioresour. Technol., 2022, 348, 126828 CrossRef CAS PubMed .
- I. Kurnia, S. Karnjanakom, I. Irkham, H. Haryono, A. Situmorang and A. Indarto, RSC Adv., 2022, 13, 220–227 RSC .
- M. H. Dehghani, S. Kamalian, M. Shayeghi, M. Yousefi, Z. Heidarinejad, S. Agarwal and V. K. Gupta, Microchem. J., 2019, 145, 486–491 CrossRef CAS .
- S. M. Mirsoleimani-azizi, P. Setoodeh, F. Samimi, J. Shadmehr, N. Hamedi and M. R. Rahimpour, J. Environ. Chem. Eng., 2018, 6, 4653–4664 CrossRef CAS .
- V. Ponnam, N. K. Katari, R. N. Mandapati, S. Nannapaneni, S. Tondepu and S. B. Jonnalagadda, J. Environ. Sci. Heal. Part. B, Pestic. food Contam. Agric. wastes, 2020, 55, 396–405 CrossRef CAS PubMed .
- Y. Wang, M. E. Lindström and G. Henriksson, BioResources, 2014, 9, 7566–7578 Search PubMed .
- Y. Habibi, L. A. Lucia and O. J. Rojas, Chem. Rev., 2010, 110, 3479–3500 CrossRef CAS PubMed .
- G. Başaran Kankılıç and A. Ü. Metin, J. Mol. Liq. DOI:10.1016/j.molliq.2020.113313 .
- S. A. Wahib, D. A. Da'na and M. A. Al-Ghouti, Arabian J. Chem., 2022, 15, 103650 CrossRef CAS .
- V. Ashouri, K. Adib, M. R. Nasrabadi and M. Ghalkhani, J. Mol. Struct., 2021, 1240, 130607 CrossRef CAS .
- N. Y. Abu-Thabit, A. A. Judeh, A. S. Hakeem, A. Ul-Hamid, Y. Umar and A. Ahmad, Int. J. Biol. Macromol., 2020, 155, 730–739 CrossRef CAS PubMed .
- A. Adewuyi and F. V. Pereira, J. Assoc. Arab Univ. Basic Appl. Sci., 2017, 24, 39–45 Search PubMed .
- D. M. Catori, E. H. Fragal, I. Messias, F. P. Garcia, C. V. Nakamura and A. F. Rubira, Int. J. Biol. Macromol., 2021, 167, 726–735 CrossRef CAS PubMed .
- C. F. Mok, Y. C. Ching, N. A. A. Osman, F. Muhamad, N. D. Hai, J. H. Choo and C. R. Hassan, J. Polym. Res. DOI:10.1007/s10965-020-02347-3 .
- A. A. Inyinbor, F. A. Adekola and G. A. Olatunji, Water Resour. Ind., 2016, 15, 14–27 CrossRef .
- N. A. Baharum, H. M. Nasir, M. Y. Ishak, N. M. Isa, M. A. Hassan and A. Z. Aris, Arabian J. Chem., 2020, 13, 6106–6121 CrossRef CAS .
- A. F. Hassan, G. A. El-naggar, G. Esmail and W. A. Shaltout, Appl. Surf. Sci., 2023, 13, 100388 CrossRef .
- F. S. Teodoro, M. M. C. Elias, G. M. D. Ferreira, O. F. H. Adarme, R. M. L. Savedra, M. F. Siqueira, L. H. M. da Silva, L. F. Gil and L. V. A. Gurgel, J. Colloid Interface Sci., 2018, 512, 575–590 CrossRef CAS PubMed .
- A. Nabili, A. Fattoum, R. Passas, E. Elaloui and A. Nabili, Cellul. Chem. Technol., 2014, 50, 9–10 Search PubMed .
- J. T. Mhlongo, Y. Nuapia, M. M. Motsa, T. O. Mahlangu and A. Etale, Mater. Today: Proc. DOI:10.1016/j.matpr.2022.02.088 .
- Y. Su, Y. Wu, M. Liu, Y. Qing, J. Zhou and Y. Wu, Materials, 2020, 13, 1–13 Search PubMed .
- E. Skwarek, O. Goncharuk, D. Sternik, W. Janusz, K. Gdula and V. M. Gun’ko, Nanoscale Res. Lett. DOI:10.1186/s11671-017-1911-5 .
- C. M. Pieper, W. L. O. da Rosa, R. G. Lund, A. F. da Silva, E. Piva, M. M. S. Salas, G. K. Maron, M. R. D. Bomio, F. V. Motta and N. L. V. Carreño, J. Bioact. Compat. Polym., 2020, 35, 469–478 CrossRef CAS .
- F. Ahangaran, A. Hassanzadeh and S. Nouri, Int. Nano Lett., 2013, 3, 3–7 CrossRef .
- S. M. Mirsoleimani-Azizi, P. Setoodeh, F. Samimi, J. Shadmehr, N. Hamedi and M. R. Rahimpour, J. Environ. Chem. Eng., 2018, 6, 4653–4664 CrossRef CAS .
- A. F. Hassan, H. Elhadidy and A. M. Abdel-Mohsen, J. Taiwan Inst. Chem. Eng., 2017, 75, 299–306 CrossRef CAS .
- G. Moussavi, H. Hosseini and A. Alahabadi, Chem. Eng. J., 2013, 214, 172–179 CrossRef CAS .
- A. F. Hassan and H. Elhadidy, J. Environ. Chem. Eng., 2017, 5, 955–963 CrossRef CAS .
- A. Pholosi, E. B. Naidoo and A. E. Ofomaja, S. Afr. J. Chem. Eng., 2020, 32, 39–55 Search PubMed .
- C. H. C. Tan, S. Sabar and M. H. Hussin, S. Afr. J. Chem. Eng., 2018, 26, 11–24 Search PubMed .
- K. H. Kamal, S. Dacrory, S. S. M. Ali, K. A. Ali and S. Kamel, Desalin. Water Treat., 2019, 165, 281–289 CrossRef CAS .
- W. A. Shaltout, G.
A. El-Naggar, G. Esmail and A. F. Hassan, Biomass Convers. Biorefin., 2023 DOI:10.1007/s13399-022-02753-1 .
- R. M. Abdelhameed, M. Taha, H. Abdel-Gawad and H. E. Emam, J. Mol. Struct., 2022, 1250, 131914 CrossRef CAS .
- I. Perassi and L. Borgnino, Geoderma, 2014, 232–234, 600–608 CrossRef CAS .
- J. Liu, L. Wan, L. Zhang and Q. Zhou, J. Colloid Interface Sci., 2011, 364, 490–496 CrossRef CAS PubMed .
- Y. Hu, T. Guo, X. Ye, Q. Li, M. Guo, H. Liu and Z. Wu, Chem. Eng. J., 2013, 228, 392–397 CrossRef CAS .
- N. Sohrabi, R. Mohammadi, H. R. Ghassemzadeh and S. S. S. Heris, J. Mol. Liq., 2021, 328, 115384 CrossRef CAS .
- G. Wang, L. Yang, L. Jiang, M. Shi, Z. Wei, W. Zhong, S. Li, J. Cui and W. Wei, RSC Adv., 2016, 6, 67888–67897 RSC .
- T. T. Firozjaee, N. Mehrdadi, M. Baghdadi and G. R. N. Nabi Bidhendi, Desalin. Water Treat., 2017, 79, 291–300 CrossRef CAS .
- S. Nikzad, A. A. Amooey and A. Alinejad-Mir, Chem. Data Collect., 2019, 20, 100187 CrossRef CAS .
- A. Farmany, S. S. Mortazavi and H. Mahdavi, J. Magn. Magn. Mater., 2016, 416, 75–80 CrossRef CAS .
- M. A. Amani, A. M. Latifi, K. Tahvildari and R. Karimian, Int. J. Environ. Sci. Technol., 2018, 15, 1301–1312 CrossRef CAS .
- K. S. Ryoo, S. Y. Jung, H. Sim and J. H. Choi, Bull. Korean Chem. Soc., 2013, 34, 2753–2759 CrossRef CAS .
|
| This journal is © The Royal Society of Chemistry 2023 |
Click here to see how this site uses Cookies. View our privacy policy here. 
 Open Access Article
 This Open Access Article is licensed under a Creative Commons Attribution-Non Commercial 3.0 Unported Licence
 a,
Laila M. Alshandoudib and
Walaa A. Shaltout
a,
Laila M. Alshandoudib and
Walaa A. Shaltout