DOI:
10.1039/D3RA00043E
(Paper)
RSC Adv., 2023,
13, 8227-8237
Interfacial S–O bonds specifically boost Z-scheme charge separation in a CuInS2/In2O3 heterojunction for efficient photocatalytic activity†
Received
4th January 2023
, Accepted 6th March 2023
First published on 13th March 2023
Abstract
Reducing the recombination rate of photoexcited electron–hole pairs is always a great challenging work for the photocatalytic technique. In response to this issue, herein, a novel Z-scheme CuInS2/In2O3 with interfacial S–O linkages was synthesized by a hydrothermal and subsequently annealing method. The Fourier transform infrared (FT-IR) and X-ray photoelectron spectrometer (XPS) measurements confirmed the formation of covalent S–O bonds between CuInS2 and In2O3. The quenching and electron spin resonance (ESR) tests revealed the Z-scheme transfer route of photogenerated carriers over the CuInS2/In2O3 heterojunctions, which was further verified theoretically via density functional theory (DFT) calculations. As expected, the CuInS2/In2O3 heterojunctions showed significantly boosted photocatalytic activities for lomefloxacin degradation and Cr(VI) reduction under visible light illumination compared with the bare materials. Accordingly, a synergistic photocatalytic mechanism of Z-scheme heterostructures and interfacial S–O bonding was proposed, in which the S–O linkage could act as a specific bridge to modify the Z-scheme manner for accelerating the interfacial charge transmission. Furthermore, the CuInS2/In2O3 heterojunction also exhibited excellent performance perceived in the stability and reusability tests. This work provides a new approach for designing and fabricating novel Z-scheme heterostructures with a high-efficiency charge transfer route.
1. Introduction
Along with the rapid development of modern industries like the pharmaceutical, chemical and manufacturing industries, abundant concomitant pollutants like antibiotics and heavy metals have entered into the aquatic ecosystem, posing a severe threat to the environment and human health.1–3 In order to alleviate these environmental issues, various water purification technologies, such as adsorption,4 ion exchange,5 membrane separation,6 photocatalysis7 and electrocatalysis,8 have been studied and applied to remove the aqueous contaminants. Among them, semiconductor-based photocatalysis has become a research hotspot in water environment treatment due to its sustainable, eco-friendly and low-cost characteristics.9–11 To date, multitudinous semiconductors have been developed, and typically, semiconducting metallic oxides such as TiO2,12 ZnO13 and SnO2,14 are extensively researched because of their excellent physical and chemical properties. Nevertheless, due to their wide band gap energies, the effective light response is normally restrained to the ultraviolet region, making them less active under visible-light. Thus, seeking an effective visible-light-responsive semiconductor is of great significance in the practical application of photocatalysis.
Indium oxide (In2O3), as a typical n-type semiconductor, has been considered as a promising visible-light-active photocatalyst due to its relative narrow band gap (∼2.7 eV), environmental stability and low toxicity.15,16 However, a major shortcoming on the pure In2O3 is its high recombination rate of photoinduced charge carries, which has seriously inhibited its photocatalytic activity.17 To address this drawback, combining In2O3 with another semiconductor to form a heterojunction has been regarded as an effective approach to favor the charge separation.18 In particular, the Z-scheme heterojunction, inspired by the natural photosynthesis, has sparked great interest from researchers due to its efficient carries transfer pattern and the relative higher redox capacity in comparison with the conventional type II heterostructure.19–22 For instance, Wang et al. fabricated a Z-scheme In2O3/CdS photocatalyst and this heterojunction possessed outstanding degradation performance for the doxycycline hydrochloride and levofloxacin owing to the high charge separation rate.23 Duan and coworkers constructed a ZnO/In2O3 Z-scheme heterojunction which showed superior photocatalytic performance for H2 production.24 Recently, copper indium disulfide (CuInS2), a ternary chalcogenide semiconductor, has shown great potential in photocatalysis due to its narrow band energy (∼1.8 eV) and high optical absorption coefficient (α > 105 cm−1).25,26 Furthermore, the CuInS2 possesses a theoretically suitable band structures and Fermi levels with those of In2O3,27,28 which makes them prospective candidates for constructing a Z-scheme heterostructure. However, to the best of our knowledge, very few reports currently focus on the assembling of such CuInS2/In2O3 composite to achieve a promoted photocatalytic activity.
In general, simple combining of hybridized semiconductors may cause interfacial resistance at their contact regions, which would impede the charge transfer and severely affect their photocatalytic performance.29 To overcome this issue, heterostructures with interfacial bonds were fabricated and the formed intimate linkage was considered to be efficient to accelerate the spatial carrier transportation.30,31 For example, Shehzad et al. reported that the chemical bonded TiO2-graphene displayed high photocatalytic activity attributing to the interfacial Ti–O–C bonds and promoted transfer of electrons.32 In Chen and Jiang's report, the covalently bonded Bi2O3/Bi2WO6 composite by cosharing of the Bi–O tetrahedron showed superior photocatalytic activities for CO2 reduction and degradation of RhB.33 Recently, some researchers have found that calcination treatment on sulphide semiconductors could promote the production of sulfur vacancies, which could delocalize local electrons and contribute to developing the heterogeneous interfaces with chemical bonding.29,34 Accordingly, for the CuInS2/In2O3 heterojunction, annealing of its precursor in the preparation process may be a prospective method to generate the interfacial chemical linkages between CuInS2 and In2O3, which would be a key factor to boost its photocatalytic activity.
In this study, a chemically bonded CuInS2/In2O3 composite was successfully synthesized using a hydrothermal method followed by annealing treatment. The obtained heterojunction between CuInS2 and In2O3 was formed via interfacial S–O linkages verified by the FT-IR and XPS. Besides, we selected lomefloxacin and Cr(VI) as the target contaminants to probe the visible-light photocatalytic performance on the prepared catalysts. Furthermore, a Z-scheme charge separation route was revealed by the quenching and ESR tests, and confirmed theoretically by DFT calculations. Finally, a synergistically enhanced photocatalytic mechanism of Z-scheme heterostructure and interfacial S–O bond on CuInS2/In2O3 was proposed and discussed.
2. Experimental
2.1 Chemical materials
Cuprous chloride (CuCl), indium chloride tetrahydrate (InCl3·4H2O), indium nitrate pentahydrate (In(NO3)3·5H2O), urea (CO(NH2)2), N,N-dimethylformamide, thioacetamide (C2H5NS), anhydrous ethanol, ammonium oxalate (AO), dimethyl sulfoxide (DMSO), isopropyl alcohol (IPA), and benzoquinone (BQ) were obtained from Sinopharm Chemical Reagent Co., Ltd. (China). The lomefloxacin (LOM) was purchased from Aladdin Chemistry Co., Ltd (China). Besides, the potassium dichromate (K2Cr2O7) was supplied by Shiyi Chemical Co., Ltd. (China). All chemicals and reagents are of analytical grade and used directly in the experiment.
2.2 Preparation of CuInS2 sample
The bare CuInS2 catalyst was synthesized by a solvothermal method. Typically, 0.3 mmol CuCl and 0.3 mmol InCl3·4H2O was dissolved and stirred in 40 mL of N,N-dimethylformamide to form a mixed solution. Subsequently, 3 mmol of thioacetamide was added into the above mixture under continuous stirring for another 60 min. Then, the obtained homogeneous solution was sealed in a 100 mL teflon-lined stainless autoclave and thermally treated at 180 °C for 16 h. After cooling to the ambient temperature naturally, the precipitate was harvested via centrifugation and washed alternately with deionized water and anhydrous ethanol for six times, and then dried in a vacuum oven at 60 °C for 24 h.
2.3 Preparation of CuInS2/In2O3 composites
The CuInS2/In2O3 photocatalysts with different mass ratios were prepared via a solvothermal and followed calcination route. In a typical procedure, 4 mmol In(NO3)3·5H2O and 30 mmol urea were introduced into 50 mL of deionized water with vortex stirring for 20 min, and then a predetermined amount of as-synthesized CuInS2 was dispersed into the mixed solution with magnetic stirring for 90 min. Afterwards, the obtained suspension was transferred to a teflon-lined stainless autoclave (100 mL) and maintained at 140 °C for 12 h. The resultant product was separated by centrifugation and washed for several times with deionized water and anhydrous ethanol, and then dried at 80 °C for 24 h. Subsequently, the obtained power was calcined at 400 °C for 120 min in a ceramic crucible with a ramp rate of 10 °C min−1 under argon atmosphere. The as-prepared CuInS2/In2O3 samples with nominal mass ratio 5%, 11%, 17% and 23% CuInS2 were denoted as 5-CuInS2/In2O3, 11-CuInS2/In2O3, 17-CuInS2/In2O3, and 23-CuInS2/In2O3, respectively. For comparison, the pure In2O3 was prepared via the similar procedure only without the introduction of CuInS2.
2.4 Characterization and theoretical calculation
The details about characterization and theoretical calculation on the fabricated materials were provided in the ESI† SM1.
2.5 Photocatalytic activity evaluation
The photocatalytic performance of the synthesized catalysts were investigated through degrading lomefloxacin (LOM) and reducing Cr(VI) under visible light irradiation. The typical photocatalytic test was conducted as follows: 200 mg of each as-synthesized material was dispersed into 500 mL LOM (30 mg L−1) or Cr(VI) (50 mg L−1) aqueous solution under continuous stirring. To ensure the adsorption–desorption equilibrium, the suspension was vigorously stirred in dark for 30 min. Afterwards, the reaction system was irradiated by a 350 W Xe-lamp (CEL-HXUV500, CEAULIGHT, Beijing, China) equipped with a 420 nm cut-off filter, and 5 mL of the suspensions were sucked out at timed intervals and immediately centrifuged for the removal of catalyst powders. The concentrations of residual LOM were determined by an UV-vis spectrophotometer (TU-1900) at a wavelength of 286 nm, and the remaining Cr(VI) concentrations were measured colorimetrically at 540 nm with the standard diphenylcarbazide method. All the experimental data were the average of three duplicate determinations.
3. Results and discussion
3.1 XRD analysis
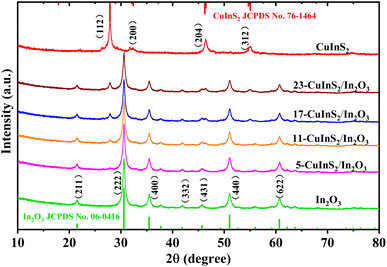
The crystalline phase and purity of all prepared catalysts were characterized by XRD measurements, and the results are shown in Fig. 1. In the XRD pattern of bare In2O3, the diffraction peaks at 21.5°, 30.6°, 35.5°, 41.8°, 45.7°, 51.0° and 60.7° could be assigned to the (211), (222), (400), (332), (431), (440) and (622) crystal planes of cubic phase In2O3 (JCPDS no. 06-0416), respectively.35 For bare CuInS2, the typical peaks located at 27.8°, 32.4°, 46.2° and 55.0° were observed, which corresponded well to the (112), (200), (204) and (312) crystal reflections of CuInS2, respectively (JCPDS no. 76-1461).36 In regard to the CuInS2/In2O3 samples, the characteristic peaks of both In2O3 and CuInS2 were identified and no other diffraction peaks of impurities could be observed. At the same time, the peak intensities of CuInS2 became correspondingly more intense with the CuInS2 content increasing, and not much difference was observed in the In2O3 diffraction peaks. The XRD characterization suggested that CuInS2 was successfully coupled with In2O3, and their original crystal phases were remained well during the combining process.
 |
| | Fig. 1 XRD patterns recorded on bare In2O3, CuInS2 and CuInS2/In2O3 composites. | |
3.2 Micromorphology and element analysis
The surface morphologies of as-prepared In2O3, CuInS2 and 17-CuInS2/In2O3 composite were depicted by SEM and TEM. As displayed in Fig. 2(a), the bare In2O3 presented stacked small-size plate structure. In Fig. 2(b), it was observed that the pure CuInS2 was constructed by dense nanoparticles with concomitant aggregation. For 17-CuInS2/In2O3 composite, it was found that the lamellar In2O3 and CuInS2 particles were both in its morphology (Fig. 2(c)). Besides, to further investigate the detailed information of the morphology and crystal structure, TEM and HRTEM analysis on 17-CuInS2/In2O3 were carried out. As illustrated in Fig. 2(d and e), there was intimate interface contact between In2O3 and CuInS2. In addition, the HRTEM image clearly showed the lattice fringes of the two substances. Among, the interplanar spacings of 0.272 and 0.319 nm corresponded to the (200) and (112) crystal planes of CuInS2,36,37 and the spacings of the 0.261 and 294 nm were attributed to the (200) and (222) planes of In2O3,16,38 respectively, which was in good agreement with the results from XRD analysis. Moreover, the high-angle annular dark field (HAADF) image and corresponding element mapping of 17-CuInS2/In2O3 (Fig. 2(f)) demonstrated the presence of Cu, In, S and O elements, further testifying the co-existing of both CuInS2 and In2O3 in this composite.
 |
| | Fig. 2 SEM images of (a) In2O3, (b) CuInS2 and (c) 17-CuInS2/In2O3 sample; TEM images (d, e) and HRTEM image (f) of 17-CuInS2/In2O3; (g) HAADF-STEM image and corresponding EDS elemental mappings of 17-CuInS2/In2O3. | |
3.3 FT-IR and XPS analysis
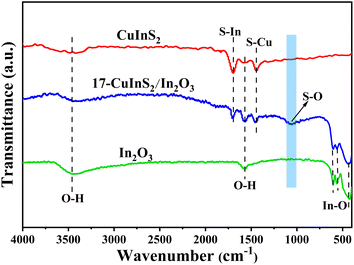
The FT-IR spectra were performed to explore the structure and bond characteristics of the as-prepared samples. As observed in Fig. 3, the FT-IR spectrum recorded on bare In2O3 revealed the In–O stretching vibrations at 426 and 560 cm−1 and the In–O bending vibration at 604 cm−1.27,35 In addition, the bands centered at 3456 and 1592 cm−1 could be ascribed to the stretching and bending vibration of –OH groups from physical adsorbed water, respectively.39 In the FT-IR spectrum of bare CuInS2, the bands at 1700 and 1449 cm−1 belonged to the S–In and S–Cu vibrations, respectively.40,41 For the composite of 17-CuInS2/In2O3, all the typical bands of surface bonds on In2O3 and CuInS2 were detected, suggesting their coexistence in this composite. Of note, a new band located at 1061 cm−1 was observed, which could be assigned to the vibration of S–O bond.29 This S–O bond might be formed via the reaction of the unsaturated S vacancies in CuInS2 and O atoms in In2O3, suggesting the construction of interfacial linkages in CuInS2/In2O3 heterostructure.
 |
| | Fig. 3 FT-IR spectra of bare In2O3, CuInS2 and 17-CuInS2/In2O3 composite. | |
The XPS determination was used to probe more details about the surface element composition and chemical states on the as-synthesized catalysts. As depicted in Fig. 4(a), the In 3d spectrum for bare In2O3 was divided into two symmetrical peaks at 452.2 and 444.6 eV, corresponding to In 3d3/2 and 3d5/2, respectively.29 The energy peaks of Cu 2p1/2 and 2p3/2 on bare CuInS2 were located at 950.2 and 930.8 eV,42 respectively (Fig. 4(b)). While for the 17-CuInS2/In2O3 composite, the In 3d energy positions were observed to shift to lower states (Fig. 4(a)), and meanwhile the Cu 2p states showed a positive shift (Fig. 4(b)) in comparison with the individual materials. Fig. 4(c) presents the high resolution XPS spectra of S 2p on bare CuInS2 and 17-CuInS2/In2O3 sample. The S 2p spectrum on bare CuInS2 could be decomposed into two peaks at 163.1 eV (S–In) and 161.9 eV (S–Cu), respectively.43 In the case of 17-CuInS2/In2O3 composite, the fitted S 2p peaks of S–In (163.6 eV) and S–Cu (162.4 eV) exhibited a positive shift, and notably, a new peak was observed at 164.6 eV associated with the S–O bonds.29,34 In Fig. 4(d), the fitting curve of O 1s on bare In2O3 involved two peaks at 532.6 and 529.8 eV, which were ascribed to the –OH from surface adsorbed water and In–O–In bond in the structure of In2O3, respectively.16 Furthermore, an additional peak was developed at 531.6 eV in the O 1s spectrum of 17-CuInS2/In2O3 composite, which could corresponded to the S–O bonds.29,44 According to the above fitting results, it was found that each element in 17-CuInS2/In2O3 showed a negative or positive shift in the banding energy compared with that of bare materials as indicated in Fig. 4(a–d), and moreover, the formation of interfacial S–O bonds was testified by XPS measurement in consistence with the results form FT-IR, indicating the intimate interfacial contact between CuInS2 and In2O3.
 |
| | Fig. 4 High-resolution XPS spectra of (a) In 3d, (b) Cu 2p, (c) S 2p, and (d) O 1s on bare In2O3, CuInS2 and 17-CuInS2/In2O3 composite. | |
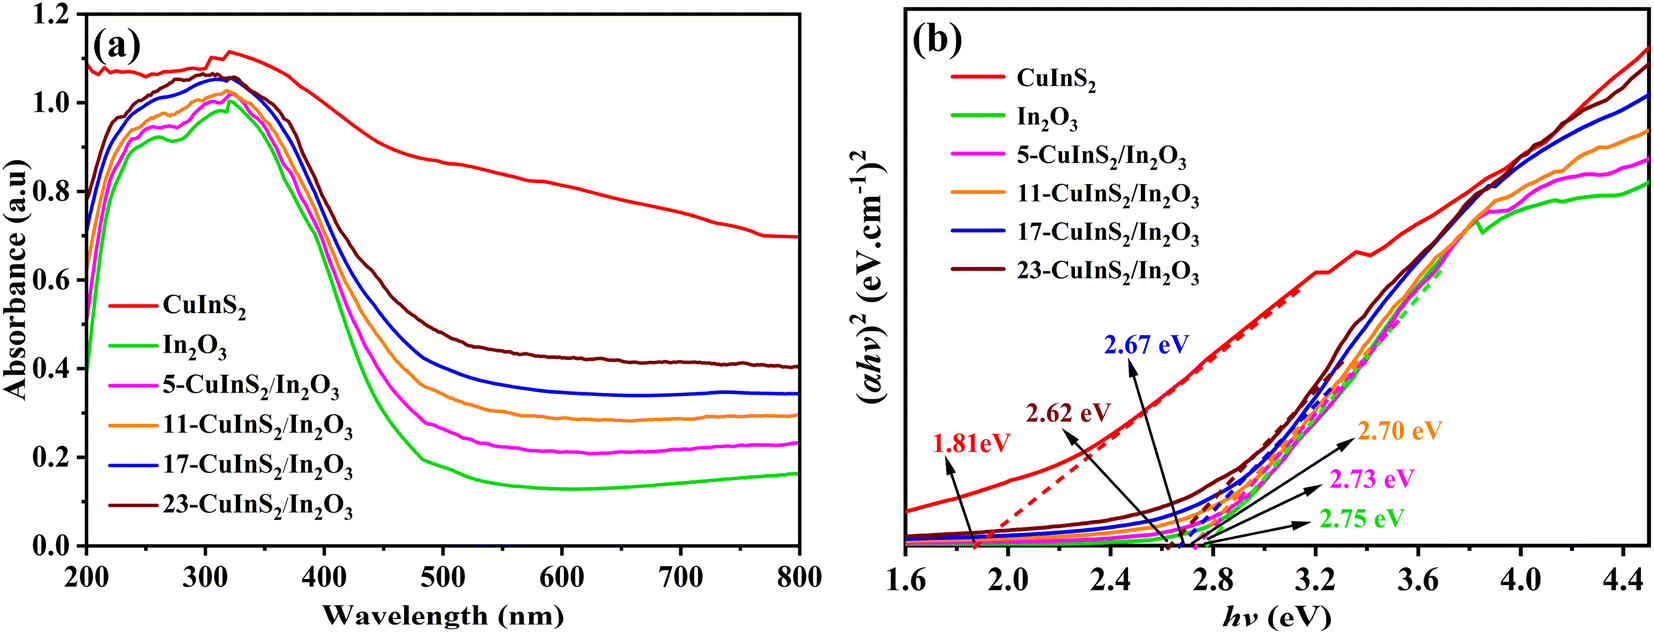
3.4 UV-vis DRS analysis
UV-vis diffuse reflectance spectra (DRS) were recorded for investigating the photo-response range on the prepared photocatalysts. As displayed in Fig. 5(a), the optical absorption edge of bare In2O3 was found at approximate 500 nm. After combining with CuInS2, the CuInS2/In2O3 composites revealed gradually promoted visible light response in the range of 500–800 nm with the CuInS2 loading content increasing, which was attributed to the excellent light absorption on CuInS2. In addition, the band gap energies of the bulk CuInS2 and In2O3 was analyzed via the following equation:45 αħν = A (ħν − Eg)n/2, in which α and A represent the absorption coefficients, ħ, ν and Eg stand for the Planck constant, light frequency and band gap energy, respectively, and n depends on the transition feature of electrons in the semiconductor with 1 and 4 for a direct transition and indirect transition gap one, respectively. In this case, both CuInS2 and In2O3 were disclosed to reveal direct transitions.27,41 Accordingly, the band gap values of CuInS2, In2O3, 5-CuInS2/In2O3, 11-CuInS2/In2O3, 17-CuInS2/In2O3 and 23-CuInS2/In2O3 were estimated to be 1.81, 2.75, 2.73, 2.70, 2.67 and 2.62 eV, respectively (Fig. 5(b)).
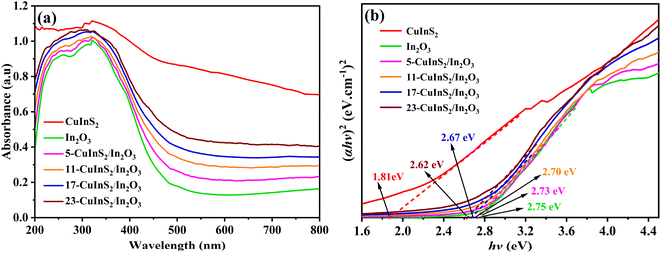 |
| | Fig. 5 (a) UV-vis DRS spectra of different samples and (b) Plots of (aħv)2 versus ħv on pure CuInS2 and In2O3. | |
3.5 Photoluminescence and photocurrent analysis
The photoluminescence (PL) emission spectra were used to explore the recombination rate of photoinduced electrons and holes on the prepared photocatalysts. As illustrated in Fig. 6(a), the CuInS2/In2O3 samples exhibited obviously declining PL emission intensities in comparison with the pure In2O3 and CuInS2, indicated that the recombination of charge carries was effectively restrained in the composites.46,47 In addition, it was found that the loading content of CuInS2 in the composites had a great influence on the PL intensity. Notably, the 17-CuInS2/In2O3 possessed the lowest PL emission intensity, implying its highest separation efficiency of electron–hole pairs in the photocatalytic process. Furthermore, to confirm the charge separation efficiency on the obtained catalysts, photocurrent response tests were carried out and the results are shown in Fig. 6(b). Normally, the higher photocurrent intensity indicates the larger charge transfer and separation rate on the semiconductor.48,49 It was observed that the CuInS2/In2O3 composites displayed enhanced photocurrent response densities compared to the bare materials, and the 17-CuInS2/In2O3 showed the strongest response density, suggesting the outstanding charge separation efficiency inside 17-CuInS2/In2O3. This result was kept in line with the analysis of PL spectra, which might be due to the tight interfacial contact with covalent S–O bonds between CuInS2 and In2O3.
 |
| | Fig. 6 Photoluminescence spectra (a) and photocurrent density curves (b) on bare In2O3, CuInS2 and CuInS2/In2O3 composites. | |
3.6 Photocatalytic activity
Photocatalytic experiments of degrading LOM and reducing Cr(VI) conducted under visible light irradiation were used to evaluate the photocatalytic performance of the as-fabricated photocatalysts. In addition, the blank tests were also carried out to estimate the photostability of the selected pollutants under light irradiation. Fig. 7(a) presents the photo-degradation activities of different samples towards LOM solution. It could be found that there was very little degradation rate of LOM with direct photolysis (without solids), suggesting the tenacious stability of aqueous LOM. Besides, after the addition of bare In2O3, only 29.9% of LOM was degraded in 90 min, and meanwhile the pure CuInS2 also displayed unsatisfactory photocatalytic performance with 37.7% LOM degradation rate. By contrast, all the CuInS2/In2O3 composites showed boosted photocatalytic activities. Among them, the 17-CuInS2/In2O3 possessed the highest photo-degradation rate of LOM (98.8%) after 90 min visible light irradiation, which might mainly due to its excellent separation efficiency of electron–hole pairs demonstrated by the PL and photocurrent measurements. Additionally, the photo-reaction kinetics of LOM over different catalysts were analyzed via the pseudo-first order kinetic formula (ln(C0/Ct) = kt).50 As illustrated in Fig. 7(b), the fitted curves were in good accordance with the kinetic model, and the 17-CuInS2/In2O3 revealed the fastest rate constant (0.0474 min−1), which was 10.1 and 13.9 times higher than that of bare CuInS2 (0.0047 min−1) and In2O3 (0.0034 min−1), respectively.
 |
| | Fig. 7 Photocatalytic degradation of LOM (a) and reduction of Cr(VI) (c), with (b) and (d) the corresponding pseudo-first-order kinetics on the as-prepared photocatalysts under visible light irradiation. | |
Fig. 7(c) shows the photocatalytic performance for Cr(VI) reduction on the prepared catalysts. Similar to the LOM degradation, the removal rate of Cr(VI) was almost negligible in the blank experiment. Besides, both bare CuInS2 and In2O3 presented low catalytic performance with only 37.1% and 25.2% reduction rate of Cr(VI), respectively. However, markedly improved activities of CuInS2/In2O3 were acquired for the removal of Cr(VI), and in line with the LOM degradation tests, the 17-CuInS2/In2O3 also displayed the best reduction rate of Cr(VI) (98.1%) in the 90 min reaction time. Furthermore, the obtained rate constants resulted from the pseudo-first order kinetic curves disclosed that the k value on the 17-CuInS2/In2O3 (0.0439 min−1) was 9.14 and 14.6 times higher than that of pure CuInS2 (0.0048 min−1) and In2O3 (0.0030 min−1), respectively (Fig. 7(d)). In addition, the photocatalytic activity of the 17-CuInS2/In2O3 composite was also compared with those of other reported photocatalysts. As displayed in Table S1,† the 17-CuInS2/In2O3 showed a quite competitive performance in the photocatalytic removal of lomefloxacin and Cr(VI).
The cyclic stability of the 17-CuInS2/In2O3 photocatalyst was evaluated via the consecutive LOM degradation and Cr(VI) reduction for five times, respectively. As can be obtained from Fig. 8(a), the photocatalytic performance of 17-CuInS2/In2O3 had no obvious deactivation with only 2.8% and 3.6% decline in LOM degradation and Cr(VI) reduction after five runs, respectively, disclosing its remarkable reusability. Besides, it could be concluded from the XRD patters (Fig. 8(b)) and S 2p and O 1s XPS spectra (Fig. S1†) of 17-CuInS2/In2O3 before and after five cycles that its crystal structure basically remained unchanged during the reactions, which further verifying its chemical stability.
 |
| | Fig. 8 (a) Recycling experiments of 17-CuInS2/In2O3 for LOM degradation and Cr(VI) reduction, (b) XRD patterns of the fresh and used 17-CuInS2/In2O3. | |
3.7 Mechanism analysis
In order to elucidate the photocatalytic mechanism on the as-synthesized materials, density functional theory (DFT) calculation was used to explore the electronic band structures of bulk CuInS2 and In2O3. As presented in Fig. 9(a and b), the direct band gaps of the CuInS2 and In2O3 were calculated to be 1.77 and 2.71 eV, respectively, which were very close to the Tauc plot results of 1.81 eV (CuInS2) and 2.75 eV (In2O3) from UV-vis DRS spectra (Fig. 5(b)). In addition, the Mott–Schottky (M–S) tests were performed to determine the band potentials of the CuInS2 and In2O3. As can be seen from the M–S plots (Fig. 9(c and d)), these two materials both belonged to the n-type semiconductors, and the flat band potentials on the CuInS2 and In2O3 were obtained as −0.67 and −0.19 V vs. Ag/AgCl (pH = 6.8), respectively, and meanwhile their flat band potentials could be converted to be −0.47 and 0.01 V vs. NHE (ENHE = EAg/AgCl + 0.2 V),51 respectively. For the n-type semiconductor, the conduction band (CB) potential is normally more negative by approximately 0.1 V than the flat band potential,10 thus the CB potentials of the CuInS2 and In2O3 were determined to be −0.57 and −0.09 V vs. NHE, respectively. In addition, according to the formula EVB = ECB + Eg, the corresponding VB potentials were calculated to be 1.24 eV for CuInS2 and 2.66 eV for In2O3, which agreed well with the results from VB-XPS spectra presented in Fig. S2.†
 |
| | Fig. 9 DFT calculated electronic band structures (a and b) and Mott–Schottky curves (c and d) of CuInS2 and In2O3. | |
To clearly clarify the effect of reactive species involving the photocatalytic activity over 17-CuInS2/In2O3, quenching tests were carried out by adding ammonium oxalate (AO), dimethyl sulfoxide (DMSO), isopropyl alcohol (IPA) and benzoquinone (BQ) as sacrificial agents for holes (h+), electrons (e−), hydroxyl radicals (˙OH) and superoxide radicals (˙O2−), respectively.52 As displayed in Fig. 10(a), there was a sharp decline (from 98.8% to 18.6%) in the photo-degradation rate of LOM when the IPA was added as the scavenger, suggesting that ˙OH played the key role in degrading LOM. Besides, the introductions of AO and BQ had apparently negative effects on LOM degradation with the degradation rates decreasing to 48.2% and 35.1%, respectively, indicating that the h+ and ˙O2− species both played important roles in LOM degradation. For the trapping experiments of Cr(VI) reduction, it was observed that adding DMSO could significantly restrain the reduction of Cr(VI) (17.4%), revealing that the photoinduced e− directly participated in the Cr(VI) reduction and acted as the dominant role in the reaction. In addition, the Cr(VI) reduction rate was greatly suppressed in the presence of BQ (30.2%), implying that ˙O2− radicals also played a crucial role in Cr(VI) reduction.
 |
| | Fig. 10 Photocatalytic removal of LOM and Cr(VI) over 17-CuInS2/In2O3 with different sacrificial agents (a), ESR spectra of ˙O2− (b) and ˙OH (c) radicals trapped by DMPO on 17-CuInS2/In2O3. | |
Additionally, ESR measurements were conducted to further examine the existence of ˙O2− and ˙OH active species generated in the photocatalytic system. As shown in Fig. 10(b), there was no distinct peak in the absence of light, and the bare In2O3 also displayed no characteristic peak in its ESR spectrum for DMPO-˙O2−, which could be due to that the induced e− in the CB of In2O3 (−0.09 eV vs. NHE) was not strong enough to reactive with O2 to generate ˙O2− (O2/˙O2−, −0.33 eV vs. NHE).53 Meanwhile, four characteristic peaks of DMPO-˙O2− were detected on the bare CuInS2 after 8 min visible light irradiation. Noticeably, the typical signals of DMPO-˙O2− were extremely enhanced on the 17-CuInS2/In2O3, indicating that abundant O2− radicals had been produced in this catalytic system. Fig. 10(c) depicts the ESR spectra of DMPO-˙OH performed on the as-prepared samples. It was found that no characteristic signal could be observed in dark, while four typical peaks of DMPO-˙OH appeared in the ESR spectrum on the bare In2O3, suggesting the existence of ˙OH species in the photoreaction. As for the bare CuInS2, no obvious peak could be perceived in its ESR curve for DMPO-˙OH, on account of the lower oxidation ability of h+ in the VB of CuInS2 (1.24 eV vs. NHE) relative to the standard potential of H2O/˙OH (2.4 eV vs. NHE).54 However, the 17-CuInS2/In2O3 exhibited a significant enhancement of DMPO-˙OH peaks compared with bare In2O3, revealing that the combination of In2O3 and CuInS2 could greatly promote the production of ˙OH radicals.
Based on the above band structure analysis of CuInS2 and In2O3, it was assumed that the 17-CuInS2/In2O3 was constructed within a traditional type II band alignment, the photoexcited e− in the CB of CuInS2 (−0.57 eV vs. NHE) should move down to that of In2O3 (−0.09 eV vs. NHE), and simultaneously, the generated h+ in the VB of In2O3 (2.66 eV vs. NHE) would transfer to that of CuInS2 (1.24 eV vs. NHE). Nevertheless, in this case, neither ˙O2− nor ˙OH could be produced in the photocatalytic reactions with 17-CuInS2/In2O3 composite, which be in contradiction to the results from the quenching and ESR tests. Thereby, the charge transfer mechanism of this CuInS2/In2O3 heterojunction may belong to a Z-scheme pattern. To further testify this supposition and make certain the charge transfer model at interface, work functions of CuInS2 and In2O3 were calculated by the DFT method. As indicated in Fig. 11, the surface work functions (Φ) of CuInS2 and In2O3 were simulated to be 3.28 and 5.76 eV, respectively. According to the formula of Ef = Eva − Φ,55 in which Ef and Eva stand for the Fermi level and electrostatic potential of vacuum level, respectively, the Fermi energy of CuInS2 was higher than that of In2O3. Thus, when CuInS2 and In2O3 form a intimate heterostructure, the e− at the CuInS2/In2O3 interface will be rearranged with a migration from CuInS2 to In2O3 until their Fermi energies attain an equilibrium, and as a result, the internal electric field (IEF) will be formed with the orientation from CuInS2 to In2O3. Thereby, due to the IEF, the photoexcited e− in In2O3 should transfer to CuInS2 in the 17-CuInS2/In2O3 reaction system, forming the Z-scheme transfer path.
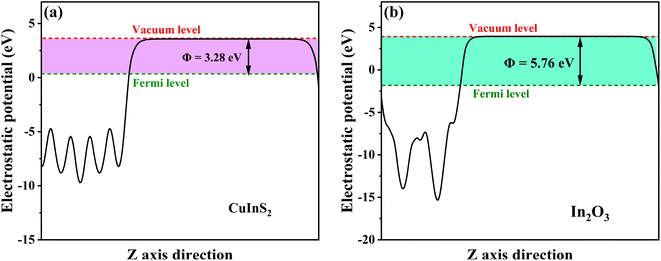 |
| | Fig. 11 Calculated work functions of (a) CuInS2 and (b) In2O3. | |
As a whole, the Z-scheme photocatalytic mechanism over CuInS2/In2O3 heterostructure is proposed and illustrated in Fig. 12. Firstly, once the CuInS2/In2O3 was irradiated by the visible light, both CuInS2 and In2O3 were excited to yield electrons and holes in their CB and VB, respectively. Secondly, owing to the formation of IEF, it would drive the photoexcited electrons to move from the CB of In2O3 to the VB of CuInS2 via interfacial S–O bonds, and then the recombination of electrons and holes occurred there. In the meantime, the electrons congregated in the CB of CuInS2 could directly reduce Cr(VI) to Cr(III) or produce ˙O2− via reacting with O2, and subsequently the generated ˙O2− could not only convert Cr(VI) to Cr(III) but also oxidize LOM to smaller molecules. Besides, in the VB of In2O3, the accumulated holes would degrade LOM or react with H2O to produce ˙OH radicals, further contributing to the degradation of LOM. Based on the aforementioned reaction process, the Z-scheme heterostructure and the formed interfacial S–O bonds between CuInS2 and In2O3 were regarded as the two synergistic factors for the enhanced photocatalytic performance on CuInS2/In2O3 heterojunctions. On the one hand, the built IEF in the Z-scheme heterostructure provided an efficient separate route for e−–h+ pairs. On the other hand, the covalent S–O linkage served as a specific bridge to further accelerate the charge separation. By virtue of this synergistic effect, the recombination of e−–h+ pairs was markedly suppressed on the CuInS2/In2O3 composite, thus greatly enhancing its photocatalytic performance for aqueous LOM and Cr(VI).
 |
| | Fig. 12 Schematic representation of proposed photocatalytic mechanism on CuInS2/In2O3 for LOM degradation and Cr(VI) reduction under visible light irradiation. | |
4. Conclusions
In summary, a covalently bonded CuInS2/In2O3 composite photocatalyst was successfully prepared via a hydrothermal and followed annealing route. The synthesized CuInS2/In2O3 heterostructure possessed an intimate interface with covalent S–O bonds confirmed by the FT-IR and XPS characterizations. In addition, the trapping and ESR tests disclosed a Z-scheme charge transfer pattern associated with the CuInS2/In2O3 heterojunction, and this transfer model was further demonstrated theoretically via the DFT calculations. As a result, in comparison with the individual materials, the optimal 17-CuInS2/In2O3 composite exhibited extremely promoted photocatalytic performance in degrading LOM and reducing Cr(VI) under visible light irradiation. In this CuInS2/In2O3 system, the built IEF provided an efficient Z-scheme separation path for charge carriers, and meanwhile the formed interfacial S–O bond acted as a bridge to further boost this separation rate. Thus, the Z-scheme heterostructure and S–O linkages showed a synergistic effect for the enhanced photocatalytic activities over CuInS2/In2O3 composites. In addition, the fabricated heterojunctions also presented good stability and reusability in five test cycles. This work provides an innovative route to constructing high-performance Z-scheme photocatalysts for environmental pollution.
Author contributions
Xiaofei Fu: conceptualization, validation, formal analysis, writing-original draft, writing-review & editing. Junwu Tao: formal analysis, visualization, data curation. Zizhou Zhao: formal analysis, methodology, data curation. Siwen Sun: formal analysis, visualization, data curation. Lin Zhao: formal analysis, data curation. Zuming He: investigation, supervision, writing-review & editing. Yong Gao: supervision, formal analysis, visualization, supervision. Yongmei Xia: formal analysis, writing-review & editing. All authors have approved the final version of the manuscript.
Conflicts of interest
There are no conflicts to declare.
Acknowledgements
This work was supported by the Specialized Research Fund for the Doctoral Program of Jiangsu University of Technology (KYY16018) and the Innovation and Entrepreneurship Training Program for Jiangsu college students (202211463073Y).
References
- H. Zhang, L. chao Nengzi, Z. Wang, X. Zhang, B. Li and X. Cheng, J. Hazard. Mater., 2020, 383, 121236 CrossRef CAS PubMed.
- Q. Wu, H. Yang, L. Kang, Z. Gao and F. Ren, Appl. Catal., B, 2020, 263, 118282 CrossRef CAS.
- J. W. Wang, F. G. Qiu, P. Wang, C. Ge and C. C. Wang, J. Cleaner Prod., 2021, 279, 123408 CrossRef CAS.
- A. M. Ismail, A. A. Menazea and H. Ali, J. Mater. Sci.: Mater. Electron., 2021, 32, 19352 CrossRef CAS.
- P. Czupryński, M. Płotka, P. Glamowski, W. Żukowski and T. Bajda, RSC Adv., 2022, 12, 5145–5156 RSC.
- C. A. Kozlowski and W. Walkowiak, Water Res., 2002, 36, 4870–4876 CrossRef CAS PubMed.
- L. Kang, Z. Han, H. Yu, Q. Wu and H. Yang, Sep. Purif. Technol., 2022, 278, 119482 CrossRef CAS.
- J. Han, S. Zhang, Q. Song, H. Yan, J. Kang, Y. Guo and Z. Liu, Sustainable Energy Fuels, 2021, 5, 509–517 RSC.
- L. Li, H. Gao, G. Liu, S. Wang, Z. Yi, X. Wu and H. Yang, Adv. Powder Technol., 2022, 33, 103481 CrossRef CAS.
- S. V. P. Vattikuti, A. K. R. Police, J. Shim and C. Byon, Appl. Surf. Sci., 2018, 447, 740–756 CrossRef CAS.
- X. Dong, H. Hao, N. Wang, H. Yuan and X. Lang, J. Colloid Interface Sci., 2021, 590, 387–395 CrossRef CAS PubMed.
- J. Juay, J. C. E. Yang, H. Bai and D. D. Sun, RSC Adv., 2022, 12, 25449 RSC.
- Z. He, Y. Xia, B. Tang, X. Jiang and J. Su, Mater. Lett., 2016, 184, 148–151 CrossRef CAS.
- Y. Lv, Z. Yu, S. Huang, F. Deng, K. Zheng, G. Yang, Y. Liu, C. Lin, X. Ye and M. Liu, Chemosphere, 2021, 271, 129452 CrossRef CAS PubMed.
- A. Saroni, M. Alizadeh, S. A. Rahman, W. Meevasana and B. T. Goh, J. Power Sources, 2020, 480, 228829 CrossRef CAS.
- J. Shen, L. Qian, J. Huang, Y. Guo and Z. Zhang, Sep. Purif. Technol., 2021, 275, 119239 CrossRef CAS.
- S. Wang, B. Y. Guan and X. W. D. Lou, J. Am. Chem. Soc., 2018, 140, 5037–5040 CrossRef CAS PubMed.
- H. Xu, H. Chen, S. Chen, K. Wang and X. Wang, Int. J. Hydrogen Energy, 2021, 46, 32445–32454 CrossRef CAS.
- Y. Wang, F. Xu, L. Sun, Y. Li, L. Liao, Y. Guan, J. Lao, Y. Yang, T. Zhou, Y. Wang, B. Li, K. Zhang and Y. Zou, RSC Adv., 2022, 1, 541004 Search PubMed.
- Z. He, M. S. Siddique, H. Yang, Y. Xia, J. Su, B. Tang, L. Wang, L. Kang and Z. Huang, J. Cleaner Prod., 2022, 339, 130634 CrossRef CAS.
- Z. He, H. Yang, J. Su, Y. Xia, X. Fu, L. Wang and L. Kang, Fuel, 2021, 294, 120399 CrossRef CAS.
- H. Hao and X. Lang, ChemCatChem, 2019, 11, 1378–1393 CrossRef CAS.
- T. Wang, Z. Zeng, J. Yang, Z. Pan, X. Zheng, Y. Guo and T. Huang, Colloids Interface Sci. Commun., 2022, 51, 100674 CrossRef CAS.
- Y. Duan, J. Xue, J. Dai, Y. Wei, C. Wu, S. H. Chang and J. Ma, Appl. Surf. Sci., 2022, 592, 153306 CrossRef CAS.
- X. Fu, J. Tao, Z. He, Y. Gao, Y. Xia and Z. Zhao, J. Mater. Sci.: Mater. Electron., 2022, 33, 24663–24676 CrossRef CAS.
- H. Tang, Y. Deng, H. Zou, Y. Tan, Y. Xiang, Y. Xu, W. Wu and Y. Zhou, ChemistrySelect, 2022, 5, 8258–8264 CrossRef.
- Z. Pan, L. Qian, J. Shen, J. Huang, Y. Guo and Z. Zhang, Chem. Eng. J., 2021, 426, 130385 CrossRef CAS.
- H. Hou, Y. Yuan, S. Cao, Y. Yang, X. Ye and W. Yang, J. Mater. Chem. C, 2020, 8, 11001–11007 RSC.
- Y. Zhang, Y. Huang, S. S. Zhu, Y. Y. Liu, X. Zhang, J. J. Wang and A. Braun, Small, 2021, 17, 2100320 CrossRef CAS PubMed.
- C. Xu, C. Jin, W. Chang, X. Hu, H. Deng, E. Liu and J. Fan, Catal. Sci. Technol., 2019, 9, 4990–5000 RSC.
- X. Fu, H. Yang, H. Sun, G. Lu and J. Wu, J. Alloys Compd., 2016, 662, 165–172 CrossRef CAS.
- N. Shehzad, M. Tahir, K. Johari, T. Murugesan and M. Hussain, J. Environ. Chem. Eng., 2018, 6, 6947–6957 CrossRef CAS.
- Z. Xie, Y. Xu, D. Li, S. Meng, M. Chen and D. Jiang, ACS Appl. Energy Mater., 2020, 3, 12194–12203 CrossRef CAS.
- H. Chai, L. Gao, P. Wang, F. Li, G. Hu and J. Jin, Appl. Catal., B, 2022, 305, 121011 CrossRef CAS.
- X. Zhou, J. Wu, Q. Li, T. Zeng, Z. Ji, P. He, W. Pan, X. Qi, C. Wang and P. Liang, J. Catal., 2017, 355, 26–39 CrossRef CAS.
- F. Deng, X. Lu, Y. Luo, J. Wang, W. Che, R. Yang, X. Luo, S. Luo and D. D. Dionysiou, Chem. Eng. J., 2019, 361, 1451–1461 CrossRef CAS.
- X. Lu, W. Che, X. Hu, Y. Wang, A. Zhang, F. Deng, S. Luo and D. D. Dionysiou, Chem. Eng. J., 2019, 356, 819–829 CrossRef CAS.
- A. Das, M. Patra, M. Kumar P, M. Bhagavathiachari and R. G. Nair, Mater. Chem. Phys., 2021, 263, 124431 CrossRef CAS.
- M. Lu, Z. Sun, Y. Zhang, Q. Liang, M. Zhou, S. Xu and Z. Li, Synth. Met., 2020, 268, 116480 CrossRef CAS.
- T. Yang, K. Xue, J. Wang, R. He, R. Sun, U. Omeoga, T. Yang, W. Wang, J. Wang and Y. Hu, J. Alloys Compd., 2020, 818, 152873 CrossRef CAS.
- F. Guo, W. Shi, M. Li, Y. Shi and H. Wen, Sep. Purif. Technol., 2019, 210, 608–615 CrossRef CAS.
- W. Ye, J. Hu, X. Hu, W. Zhang, X. Ma and H. Wang, ChemCatChem, 2019, 11, 6372–6383 CrossRef CAS.
- W. Yue, S. Han, R. Peng, W. Shen, H. Geng, F. Wu, S. Tao and M. Wang, J. Mater. Chem., 2010, 20, 7570–7578 RSC.
- J. Park, T. H. Lee, C. Kim, S. A. Lee, M. J. Choi, H. Kim, J. W. Yang, J. Lim and H. W. Jang, Appl. Catal., B, 2021, 295, 120276 CrossRef CAS.
- L. Li, H. Gao, Z. Yi, S. Wang, X. Wu, R. Li and H. Yang, Colloids Surf., A, 2022, 644, 128758 CrossRef CAS.
- Z. Gao, H. Yang, J. Li, L. Kang, L. Wang, J. Wu and S. Guo, Appl. Catal., B, 2020, 267, 118695 CrossRef CAS.
- L. Kang, L. Xu, Z. Han, H. Yu, Q. Wu, M. Wu, Z. He, L. Wang and H. Yang, Chem. Eng. J., 2022, 429, 132355 CrossRef CAS.
- T. Cheng, H. Gao, G. Liu, Z. Pu, S. Wang, Z. Yi, X. Wu and H. Yang, Colloids Surf., A, 2022, 633, 127918 CrossRef CAS.
- Q. Zhao, Z. Liu, J. Li, W. Yan, J. Ya and X. Wu, Int. J. Hydrogen Energy, 2021, 46, 36113–36123 CrossRef CAS.
- Q. Qiu, P. Zhu, Y. Liu, T. Liang, T. Xie and Y. Lin, RSC Adv., 2021, 11, 3333–3341 RSC.
- Z. He, H. Yang, J. Sunarso, N. H. Wong, Z. Huang, Y. Xia, Y. Wang, J. Su, L. Wang and L. Kang, Chemosphere, 2022, 303, 134973 CrossRef CAS PubMed.
- Z. He, Y. Xia, J. Su and B. Tang, Opt. Mater., 2019, 88, 195–203 CrossRef CAS.
- Z. He, Y. Xia, B. Tang and J. Su, Mater. Res. Express, 2017, 4, 095501 CrossRef.
- X. Wei, C. C. Wang, Y. Li, P. Wang and Q. Wei, Chemosphere, 2021, 280, 130734 CrossRef CAS PubMed.
- X. Wang, X. Wang, H. Yang, A. Meng, Z. Li, L. Yang, L. Wang, S. Li, G. Li and J. Huang, Chem. Eng. J., 2022, 431, 134000 CrossRef CAS.
|
| This journal is © The Royal Society of Chemistry 2023 |
Click here to see how this site uses Cookies. View our privacy policy here. 
 Open Access Article
 This Open Access Article is licensed under a Creative Commons Attribution-Non Commercial 3.0 Unported Licence
 *a,
Junwu Taoa,
Zizhou Zhaoa,
Siwen Suna,
Lin Zhaoa,
Zuming Heb,
Yong Gaoa and
Yongmei Xiac
*a,
Junwu Taoa,
Zizhou Zhaoa,
Siwen Suna,
Lin Zhaoa,
Zuming Heb,
Yong Gaoa and
Yongmei Xiac