 Open Access Article
Continuous synthesis of 2,2,6,6-tetramethyl-4-piperidinol over CuCrSr/Al2O3: effect of Sr promoter†
Zijing Zhang‡abcd,
Xi Chen‡e,
Bowei Wang *abcd,
Long Wanga,
Yang Li
 acd,
Xilong Yan
 acd and
Ligong Chen
 *abcd
*abcd
aSchool of Chemical Engineering and Technology, Tianjin University, Tianjin 300350, P. R. China. E-mail: bwwang@tju.edu.cn; lgchen@tju.edu.cn
bZhejiang Institute of Tianjin University, Shaoxing, Zhejiang 312300, P. R. China
cTianjin Engineering Research Center of Functional Fine Chemicals, Tianjin, P. R. China
dGuangdong Laboratory of Chemistry and Fine Chemical Industry Jieyang Center, Guangdong Province 522000, P. R. China
eInstitute of Pharmaceutical Sciences, China Pharmaceutical University, Nanjing 210009, P. R. China
First published on 24th March 2023
Abstract
A continuous process was developed for catalytic hydrogenation of triacetoneamine (TAA) to 2,2,6,6-tetramethyl-4-piperidinol (TMP), both of which are indispensable raw materials of hindered amine light stabilizers. A series of promoter-modified CuCr/Al2O3 catalysts were prepared by co-precipitation method and evaluated by the above reaction. The effect of promoter on the catalytic performance was explored by characterization tools, in which, CuCrSr/Al2O3 exhibited excellent catalytic performance with nearly complete conversion of TAA and over 97% selectivity of TMP at 120 °C. The characterization results indicated that the doped Sr could decrease the size of Cu nanoparticles to provide more active sites, improve the ratio of Cu+/Cu0 to promote the adsorption of substrates, and reduce the surface acidity to depress side reactions, thus remarkably enhancing catalytic performance. This work provides a low-cost, reliable and efficient strategy for the continuous industrial production of TMP.
1. Introduction
Triacetoneamine (TAA, 2,2,6,6-tetramethyl-4-piperidone) and 2,2,6,6-tetramethyl-4-piperidinol (TMP) are the critical raw materials of hindered amine light stabilizers,1,2 which have been used commonly in plastics, fibers, coatings, and rubbers.3–6 However, TAA is easily oxidized at room temperature due to its thermo-sensitivity, and thus it is normally converted into the corresponding stable alcohol-TMP in industry.As is well known, numerous methods have been reported for the production of TMP. Using sodium borohydride as a reducing agent, Wilson B. Lutz et al.7 obtained TMP from TAA by chemical reduction. In addition, TAA could be reduced at the electrolyzer cathode, where E. Sh. Kagan et al.8 synthesized TMP using the electrochemical method. However, these methods may cause pollution, and the small-scale production with high costs cannot meet the market demand. In order to overcome these deficiencies, the catalytic hydrogenation method was developed for large-scale production.9 Typically, Kintopf et al.10 realized the synthesis of TMP in an autoclave over RANEY®-Ni, and further extended it to large-scale production. Notwithstanding, there were some drawbacks, including high energy consumption, the cumbersome separation and recycling of RANEY®-Ni, and flammable and explosive safety hazards.9,11–15 Consequently, it is urgent to establish an economical, safety and convenient method to produce TMP. It will undoubtedly be of value to conduct research on continuous hydrogenation of TAA to TMP over cheap and efficient catalyst.
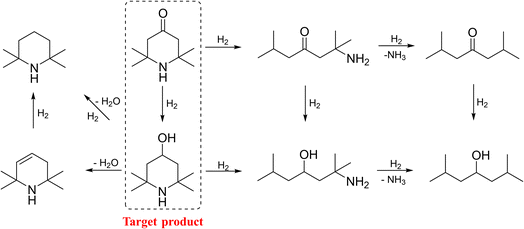
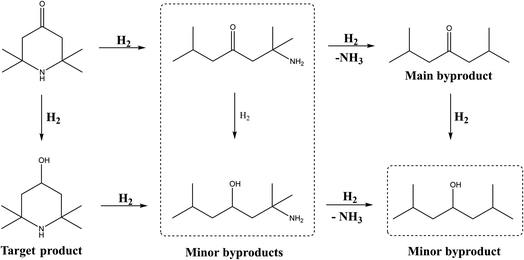
As reported and described in Scheme 1, the hydrogenation of TAA is quite complicated, consisting of a series of side reactions except for the target hydrogenation.16–18 This is reasonably attributed to the unique chemical structure of TAA, and the blocked piperidine unit is prone to proceed catalytic hydrogenolysis.19 Therefore, developing an efficient catalyst to realize the selective hydrogenation of TAA to TMP still remained a big challenge.
In our previous work, a continuous hydrogenation of TAA to TMP in a fixed bed reactor was reported, but the selectivity of TMP was not satisfied.18 Moreover, with high metal content on basic alumina, the mechanical strength of shaped catalyst was poor. Thus, further work to improve the catalyst is required.
Based on the knowledge of complex hydrogenation reactions, not only the dispersion of metal nanoparticles, but some additional factors, such as the surface composition and acidity of catalysts, could also influence the catalytic activity and product selectivity.20–23 Introducing appropriate promoters would boost the dispersion and modify the support thereby facilitating the progress of reactions.20,24 However, there is little research on the conversion from TAA to TMP and therefore not much information is available. According to our previous work and considering the service life of catalysts, we decided to use Al2O3 with desirable mechanical strength as carrier and introduce the third component to achieve this continuous hydrogenation process.
Herein, we developed a series of Cu-based catalysts by co-precipitation method with Al2O3 as support. The effect of promoter on its catalytic performance was explored, CuCrSr/Al2O3 was screened out and found to display the superior catalytic performance for the hydrogenation of TAA. Moreover, the prepared catalysts were characterized to explore the structure–activity relationship. The results revealed that the doped Sr markedly promoted the dispersion of Cu microcrystals, efficiently adjusted the surface composition of catalyst, and decreased the surface acidity, thus remarkably enhancing the catalytic performance and depressing side reactions. Furthermore, the reaction conditions were optimized, and under the optimized conditions, nearly quantitative conversion of TAA and over 97% selectivity of TMP were achieved.
2. Experimental section
2.1 Materials
2,2,6,6-Tetramethyl-4-piperidone (A.R.) was obtained by Adamas-Beta. Cu(NO3)2·3H2O (A.R.), Cr(NO3)3·9H2O (A.R.), Sr(NO3)2 (A.R.), Zn(NO3)2·6H2O (A.R.), Ce(NO3)3·6H2O, Mg(NO3)2·6H2O (A.R.), Ca(NO3)2 (A.R.), Ba(NO3)2 (A.R.) were purchased from Tianjin Guangfu Fine Chemical Research Institute, Tianjin, China. Na2CO3 (A.R.) was supplied by Tianjin Fengchuan Chemical Reagent Technology Co., Ltd., Tianjin, China. Pseudo-boehmite (99%, 300 mesh, SBET = 250 m2 g−1, Vpore = 0.40 m3 g−1, A.R.) was obtained from Jiangsu Sanji Industrial Co., Ltd., Jiangyan, China. All commercially available reagents were used without further purification.2.2 Catalyst preparation
The Cu-based catalysts were prepared using the co-precipitation method. The preparation of CuCrSr/Al2O3 (theoretical mass contents of the components: 20 wt% Cu, 5 wt% Cr, and 5 wt% Sr) was illustrated as following: 30.41 g Cu(NO3)2·3H2O, 15.39 g Cr(NO3)3·9H2O and 4.83 g Sr(NO3)2 were dissolved in 300 mL deionized water (solution A), and Na2CO3 solution was prepared as 1 mol L−1 (solution B). In a 2000 mL beaker, 300 mL of deionized water and 40.00 g pseudo-boehmite (equal to 28.00 g Al2O3) were introduced under mechanical stirring (>400 rpm). Then, solutions A and B were added dropwise simultaneously to the breaker. During the process, the pH of the mixture was kept around 8.0 using a pH meter. The resulting mixture was stirred for another 1 h and aged for further 12 h at room temperature. The precipitate was collected by filtration and washed with deionized water until the pH of the filtrate dropped to 7.0–7.5. The solid cake was dried at 110 °C for 6 h, crushed into 100 mesh powder, and then mixed with sesbania gum and deionized water to knead and extrude into bars with a diameter of 2 mm using an extruder. Eventually, the bars were dried at 110 °C for 6 h and calcined in a muffle furnace at 400 °C for 4 h. Before use, the catalysts were cut into small bars with a length of 3–5 mm and reduced in a stream of 1 MPa H2 at 150 °C for 4 h.Cu/Al2O3 and CuCr/Al2O3 were similarly prepared as above. In addition, CuCrM/Al2O3 catalysts were prepared by the same method with the same mass fraction (M: Zn, Ce, Ca, Mg or Ba; all were decomposed from their nitrates). Additionally, the catalysts with different Sr contents were expressed as CuCrSr/Al2O3-x (x represents the mass fraction of Sr, x = 1, 3, 7).
2.3 Characterization of catalysts
![[thin space (1/6-em)]](https://www.rsc.org/images/entities/char_2009.gif) :
:![[thin space (1/6-em)]](https://www.rsc.org/images/entities/char_2009.gif) 1
1![[thin space (1/6-em)]](https://www.rsc.org/images/entities/char_2009.gif) :
:![[thin space (1/6-em)]](https://www.rsc.org/images/entities/char_2009.gif) 0.1, V/V). After the acid digestion at 300 °C for 2 h, the obtained solution was transferred into a 25 mL volumetric flask for the ICP-OES test.
0.1, V/V). After the acid digestion at 300 °C for 2 h, the obtained solution was transferred into a 25 mL volumetric flask for the ICP-OES test.2.4 Catalyst activity tests
The catalytic performance evaluation of Cu-based catalysts was carried out in a fixed-bed reactor with an inner diameter of 15 mm and a length of 650 mm, where 10 mL catalysts were charged. The schematic was shown in Fig. S1.† The reduced catalysts were obtained from calcined catalysts in a stream of 1 MPa H2 at 150 °C for 4 h. 2,2,6,6-Tetramethyl-4-piperidone ethanol solution (20 wt%) was fed into the reactor by a syringe pump at a flow rate of 0.3 mL min−1. The temperature of the reaction was monitored by a thermocouple placed in the middle of the reactor. The reaction mixture was cooled by condenser and collected, which was then analyzed once an hour by a gas chromatograph equipped with PEG-20M (30 m × 0.5 mm) capillary column and FID detector. The components of sample were quantified by area normalization method. The program was carried out from 80 to 240 °C at a rate of 15 °C min−1 with a constant N2 flow at 50 mL min−1. The measured results were averaged for data credibility, and the mass difference between reaction product and feed was lower than 3% for six hours. The reaction sample was qualitatively analyzed by Agilent 6890/5975 gas chromatography-mass spectrometry (GC-MS) equipped with an HP-5 capillary column (30 m × 0.5 mm) and an FID detector with a relative standard deviation of less than 2%. The conversion of raw materials and selectivity of products were calculated according to the following equations:3. Results and discussion
3.1 Catalytic performance
As illustrated above, several Cu-based catalysts were successfully prepared, and then employed in the continuous hydrogenation of TAA to TMP in a fixed-bed reactor. The obtained results are summarized in Table 1. Under 100 °C, only TMP product was detected in the reaction mixture, and the conversion of TAA was enhanced by the introduction of chromium and different third metal elements, such as 45.19%, 53.55% and the best 75.21% TAA conversions achieved over Cu/Al2O3, CuCr/Al2O3 and CuCrSr/Al2O3 respectively. Compared with Cu/Al2O3 and CuCr/Al2O3, the third component (such as Zn, Ce, and alkaline-earth metals) in the catalysts exhibited different catalytic performances. Although Zn and Ce were reported to be efficient cocatalysts of Cu-based catalysts in hydrogenation reactions,24,25 none of them achieved better results in the above reaction. Encouragingly, it was found the doped alkaline-earth metals can effectively promoted TAA conversion. Except for a slight increase in the conversion of TAA over CuCrCa/Al2O3, other catalysts all acquired significant improvements, among which CuCrSr/Al2O3 showed the best.| Entry | Catalyst | Conversion/% | Selectivity/% | ||
|---|---|---|---|---|---|
| TMP | DIBK | Others | |||
| a Reaction conditions: 10 mL catalysts, 100 °C.b Reaction conditions: 10 mL catalysts, 120 °C, 2 MPa hydrogen, feed rate of TAA ethanol solution = 0.3 mL min−1 (20%). | |||||
| 1a | Cu/Al2O3 | 45.19 | 100 | — | — |
| 2a | CuCr/Al2O3 | 53.55 | 100 | — | — |
| 3a | CuCrZn/Al2O3 | 48.08 | 100 | — | — |
| 4a | CuCrCe/Al2O3 | 50.75 | 100 | — | — |
| 5a | CuCrMg/Al2O3 | 67.62 | 100 | — | — |
| 6a | CuCrCa/Al2O3 | 57.92 | 100 | — | — |
| 7a | CuCrSr/Al2O3 | 75.21 | 100 | — | — |
| 8a | CuCrBa/Al2O3 | 68.61 | 100 | — | — |
| 9b | Cu/Al2O3 | 60.26 | 90.56 | 8.34 | 1.10 |
| 10b | CuCr/Al2O3 | 61.60 | 92.77 | 6.45 | 0.78 |
| 11b | CuCrZn/Al2O3 | 57.55 | 93.12 | 6.14 | 0.74 |
| 12b | CuCrCe/Al2O3 | 58.96 | 91.65 | 7.63 | 0.72 |
| 13b | CuCrMg/Al2O3 | 80.43 | 94.10 | 5.11 | 0.79 |
| 14b | CuCrCa/Al2O3 | 81.79 | 93.55 | 4.97 | 1.48 |
| 15b | CuCrSr/Al2O3 | 86.70 | 95.86 | 3.21 | 0.93 |
| 16b | CuCrBa/Al2O3 | 83.53 | 93.41 | 5.64 | 0.95 |
Considering the insufficient reaction at 100 °C, further exploration was performed at 120 °C. When the hydrogenation temperature was elevated to 120 °C, TAA conversion increased. However, in addition to TMP, 2,6-dimethyl-4-heptanone (DIBK), 2-amino-2,6-dimethyl-4-heptanone, 2,6-dimethyl-4-heptanol and other byproducts were detected. CuCrSr/Al2O3 catalyst still presented the best TAA conversion of 86.70% and TMP selectivity of 95.86%, exhibiting outstanding catalytic performance.
As discussed above, the doped element can importantly influence the catalytic activity of Cu based catalysts, and doping with alkaline earth metals was an effective way to improve CuCr/Al2O3. To gain further insights into the structure–catalytic performance relationship of the obtained catalysts, they were fully characterized as following.
3.2 Characterization of catalysts
The X-ray diffraction patterns for calcined and reduced Cu/Al2O3, CuCr/Al2O3, and CuCrSr/Al2O3 were shown in Fig. 1A and B, respectively. The characteristic peaks of CuO (located at 2θ = 35.5°, 38.7°, 38.9°, 48.7°, 61.5°) and γ-Al2O3 (located at 2θ = 39.5°, 45.9°, 66.9°, 80.6°, 85.0°) were obviously observed in Fig. 1A, and the diffraction peaks located at 25.2°, 25.9°,36.3°, 36.7°, 44.2°, and 47.9° were assigned to SrCO3 phase of CuCrSr/Al2O3. Besides, no diffraction peaks were attributed to Cr or Cu–Cr oxides in calcined CuCr/Al2O3 and CuCrSr/Al2O3 catalysts, indicating that Cr particles were small or amorphous. It is noteworthy that the characteristic peaks of CuO became broader and weaker with the doping of Cr and Sr, indicating the better dispersion of CuO particles. In addition, the characteristic peaks of Al2O3 also became broader in CuCrSr/Al2O3, implying that the doped Sr regulated the property of Al2O3 carrier. After reduction, the diffraction peaks of CuO disappeared and the characteristic peaks of metallic Cu (located at 2θ = 43.3°, 50.4°, 74.1°, 89.9°, 95.1°) appeared in Fig. 1B. In addition, the rest diffraction peaks in Fig. 1B were basically similar as those peaks in Fig. 1A. With the doping of Cr and Sr, the similar behavior of peaks of Cu in reduced catalysts was observed as that of CuO, suggesting a smaller particle size of Cu in CuCrSr/Al2O3. The particle sizes of Cu calculated by Debye–Scherrer equation were 19.5, 17.1, and 9.5 nm for Cu/Al2O3, CuCr/Al2O3, and CuCrSr/Al2O3, respectively. This result indicated that Sr promoted the dispersion and reduced the size of Cu nanoparticles.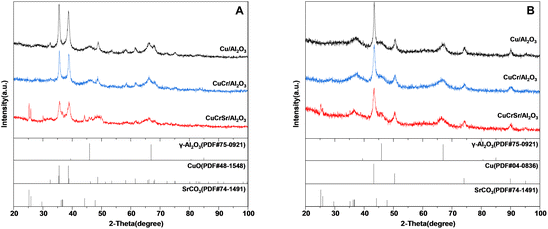 | ||
| Fig. 1 XRD patterns of Cu/Al2O3, CuCr/Al2O3 and CuCrSr/Al2O3 after (A) calcination and (B) reduction. | ||
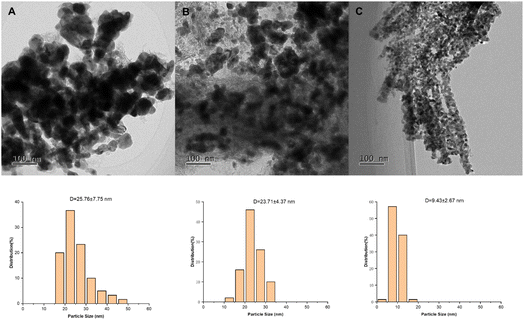
The distributions of Cu nanoparticles in Cu/Al2O3, CuCr/Al2O3, and CuCrSr/Al2O3 were also investigated using TEM, as shown in Fig. 2. Black particles were irregularly distributed on bulk Al2O3 support of Cu/Al2O3 and CuCr/Al2O3, suggesting the poor dispersion of Cu species. With the doping of Sr, the aggregation of metal particles was suppressed. Besides, the further statistical analysis showed that the size of Cu particles decreased from 25.8 nm over Cu/Al2O3 to 23.7 nm over CuCr/Al2O3, and even to 9.4 nm over CuCrSr/Al2O3, implying that doped Sr can markedly improve the dispersion of Cu particles, which squared well with the result of XRD. Thus, more active sites in CuCrSr/Al2O3 were provided for the hydrogenation of TAA to TMP.
To further reveal the structure and elemental distribution of CuCrSr/Al2O3, HRTEM and EDS elemental mapping (Fig. 3) were employed. As shown in HRTEM image of Fig. 3, well-resolved crystalline lattice spacings of about 0.213 nm were associated with the (1 1 1) planes of metallic Cu. The EDS elemental mapping results of CuCrSr/Al2O3 displayed homogeneous distributions of Cu, Cr, Sr, Al, and O. It should be noted that the distribution of Cr was consistent with that of Cu while Sr was uniformly distributed on the catalyst, which indicated that Cr and Sr might play different roles. It seemed that there was an interaction between Cu and Cr species26 while Sr species were more likely to interact with the carrier of catalysts to enhance the Cu species dispersion, and both of them could promote the catalytic activity. In addition, the interaction between Sr and carrier also reasonably demonstrated the change of Al2O3 peaks in Fig. 1A.
 | ||
| Fig. 3 HRTEM, HAADF, and EDS mapping images of CuCrSr/γ-Al2O3 (elements fusion diagram was composed by Cu, Cr, and Sr). | ||
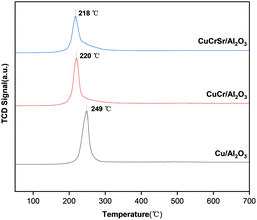
The unreduced catalysts were characterized by H2-TPR to investigate the reduction behavior, as shown in Fig. 4. It mainly revealed the reduction characteristics of CuO because Cr and Sr species could not be reduced under this condition. In each case, a strong hydrogen reduction peak was found, which is the typical profile for Cu2+ to Cu0.27 For Cu/Al2O3 catalyst, the reduction peak occurred at 249 °C. And as for unreduced CuCr/Al2O3, the reduction peak shifted to 220 °C. This result indicated that the introduction of Cr improved the reducibility of CuO. CuCrSr/Al2O3 sample exhibited similar reduction behavior as CuCr/Al2O3 but at a lower temperature of 218 °C, suggesting that the doped Sr could further improve the reducibility of CuO. Not only did the reduction temperature drop, but the area of the reduction peak also decreased gradually with the addition of Cr and Sr, which could imply some kind of change in the surface compositions.28
To reveal the surface compositions and chemical states of Cu/Al2O3, CuCr/Al2O3, and CuCrSr/Al2O3, XPS spectra were collected and shown in Fig. 5. For all reduced catalysts, Cu 2p3/2 peak at 932.0 eV and Cu 2p1/2 peak at 952.0 eV were observed, and attributed to Cu0 and/or Cu+ species.29,30 With the addition of Cr, Cu 2p peaks moved to lower binding energy (∼931.8 eV), indicating the obvious interaction between Cu and Cr,20,31 which was consistent with EDS mapping analysis results. The binding energy of Cu 2p peak after further adding Sr was comparable to that of CuCr/Al2O3, slightly less than that of Cu/Al2O3. In addition, the fine spectra of Cu/Al2O3 and CuCr/Al2O3 by Gaussian peak fitting exhibited shoulder peaks accompanying Cu 2p3/2 and Cu 2p1/2 at higher binding energy, suggesting the existence of Cu2+, which was probably due to the oxidation of metallic Cu during the testing process. Besides, no Cu2+ was detected in CuCrSr/Al2O3. Because of the similar binding energy of Cu0 and Cu+ species, it was difficult to distinguish them only by XPS analysis of Cu 2p peaks. In order to confirm the exact chemical state of Cu species on catalysts, we adopted Cu LMM XAES to clarify this (Fig. 5b). In the Cu LMM spectra, based on deconvolution and Gauss fitting, the Auger peaks could be fitted into two peaks, the lower kinetic energy corresponding to Cu+ species and the higher corresponding to Cu0 species.20,31 Numerical proportion results were listed in Table S1.† It was found that the proportion of Cu+ gradually increased with the introduction of Cr and Sr, which could reasonably explain why the areas of reduction peaks decreased gradually in Fig. 4. As reported, the existence of Cu+ could favor the adsorption of substrates.32
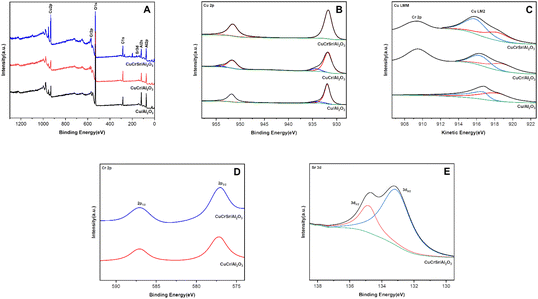 | ||
| Fig. 5 (A) XPS survey, (B) Cu 2p, (C) Cu LMM Auger, (D) Cr 2p, and (E) Sr 3d spectra of Cu-based catalysts after reduction. | ||
Fig. 5d showed the Cr 2p spectrum in CuCr/Al2O3 and CuCrSr/Al2O3. The binding energies of 577.1 eV and 587.0 eV were matched with Cr 2p2/3 and Cr 2p1/2, respectively, implying that Cr species existed in +3 valence state.33 As for the Sr 3d spectrum of CuCrSr/Al2O3 in Fig. 5e, the peaks could be deconvoluted into two peaks located at 134.1 eV and 135.9 eV, corresponding to Sr 3d5/2 and Sr 3d3/2, indicating the successful Sr-doping in CuCr/Al2O3.34
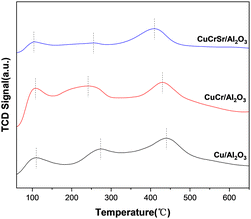
NH3-TPD was carried out to characterize the surface acidity of reduced Cu-based catalysts. As shown in Fig. 6, all the catalysts presented three NH3 desorption peaks, suggesting there were three kinds of acid sites on the surface of catalysts. The first peak located at 0–200 °C was assigned to weak acid sites, and the second peak at 200–350 °C was associate with medium-strong acid sites, while the third peak located at 350–500 °C was attributed to strong acid sites.35,36 As for weak acid sites, all of the catalysts displayed comparable strength of peak around 110 °C. For the medium-strong acid peaks, compared with Cu/Al2O3, the peak of CuCr/Al2O3 shifted to a lower temperature, but it became broader and larger. Furthermore, CuCrSr/Al2O3 presented the lowest quantity of medium-strong acidic sites. In the case of strong acid sites, the strength and amount gradually decreased with the doping of Cr and Sr. Obviously, all types of acid sites decreased significantly with the addition of Sr, which might alter its adsorption capacity for TAA and TMP.
Moreover, the physicochemical properties of Cu-based catalysts were investigated and summarized in Table S2.† ICP-OES results indicated that the actual compositions of all catalysts were close to the predetermined values. N2 adsorption–desorption isotherms and pore size distribution of all samples (Fig. S2†) confirmed the presence of mesoporous structures, which showed characteristic IV isotherms with H3-type hysteresis loops. As the addition of Cr and Sr, BET surface area, pore volume, and pore size of the catalyst presented a decreasing trend, which indicated that the additives were deposited in the pores probably.
3.3 Condition optimization
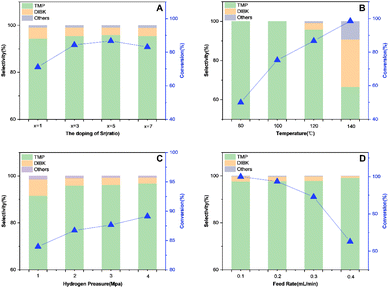
Reaction conditions would impose great influences on the reaction. Therefore, the catalytic performance of CuCrSr/Al2O3 catalyst for the hydrogenation of TAA was further investigated. Catalysts containing different Sr amounts were designed to explore the effect of doped Sr, and the results were shown in Fig. 7A. When the amount was 1%, the catalytic activity was just a little improvement. As the amount gradually increased, 5 wt% Sr content catalyst exhibited the best conversion of TAA and selectivity of TMP. However, further increase in Sr content led to a decreased TAA conversion compared with CuCrSr/Al2O3-5, which implied excessive Sr caused a negative impact. This might be due to the blocking of pore structure by Sr species. Thus, 5 wt% was selected as the optimum Sr content.Additional tests were carried out to evaluate the effect of reaction conditions. The catalytic performance of CuCrSr/Al2O3 catalyst was further investigated concerning reaction temperature (Fig. 7B), H2 pressure (Fig. 7C) and feed rate (Fig. 7D).
As shown in Fig. 7B, the conversion of TAA exhibited a gradual increase from 80 (58%) to 140 °C (99%). However, higher reaction temperature would also cause more by-products like DIBK. When the temperature was raised to 140 °C, TMP selectivity dropped to 67%. Thus, 120 °C was determined as the optimal hydrogenation temperature.
Fig. 7C showed the effect of hydrogen pressure. TAA conversion increased from 83.95% at 1 MPa hydrogen pressure to 89.13% at 4 MPa, suggesting the positive effect of increasing hydrogen pressure. TMP selectivity was poor at 1 MPa H2, and it raised with increasing hydrogen pressure. Here the optimal hydrogen pressure was set as 4 MPa.
As illustrated in Fig. 7D, different feed rates were adopted. The highest conversion was obtained when the feed rate was 0.1 mL min−1. And with further increase of the feed rate, the conversion decreased gradually. On the contrary, TMP selectivity increased slightly with the change of feed rate.
Overall, the final optimum conditions were 120 °C, 4 MPa hydrogen pressure, and 0.1 mL min−1 feed rate. At this point TAA conversion and TMP selectivity were 99.99% and 97.67%, respectively.
3.4 Reaction pathway
As reported and explored above, a plausible reaction pathway of TAA hydrogenation to TMP was described in Scheme 2. The hydrogenation to C![[double bond, length as m-dash]](https://www.rsc.org/images/entities/char_e001.gif) O was the major reaction under the optimized conditions, but several byproducts were detected in the reaction mixture, among which 2,6-dimethyl-4-heptanone was the major one. Considering the amino group is bonded to two tertiary carbon atoms and the uneven electron cloud distribution would weaken the C–N bonds, thus it is easy to undergo catalytic hydrogenolysis reaction.37 Moreover, the acidic sites of Al2O3 could adsorb TAA and TMP molecules and further enhanced the catalytic cracking of the C–N bond.19 These factors indicated that it was quite difficult to achieve full selectivity towards target TMP.
O was the major reaction under the optimized conditions, but several byproducts were detected in the reaction mixture, among which 2,6-dimethyl-4-heptanone was the major one. Considering the amino group is bonded to two tertiary carbon atoms and the uneven electron cloud distribution would weaken the C–N bonds, thus it is easy to undergo catalytic hydrogenolysis reaction.37 Moreover, the acidic sites of Al2O3 could adsorb TAA and TMP molecules and further enhanced the catalytic cracking of the C–N bond.19 These factors indicated that it was quite difficult to achieve full selectivity towards target TMP.
According to NH3-TPD results, the doped Sr could effectively decrease the acid strength and amount of Al2O3, so efficiently inhibit the adsorption of TAA and TMP molecules, and suppress the catalytic hydrogenolysis of C–N bond.
3.5 Catalyst stability
Service life is one of the important indexes to evaluate the performance of a catalyst. The long-term stability result over CuCrSr/Al2O3 catalyst under the moderate reaction conversions was described in Fig. 8. It was apparent that TAA conversion stayed at around 80% while TMP selectivity remained over 90% at 120 °C for 50 h, demonstrating the good stability of this catalyst. What's more, no fragmentation or loss of catalysts was observed during the reaction process. Compared with Cu30Cr5/Basic Alumina in our previous work, CuCrSr/Al2O3 exhibited better mechanical strength during the hydrogenation. To further study the stability of CuCrSr/Al2O3, XRD patterns and TEM images of the used catalyst were collected. The consistent patterns of fresh and used catalysts in Fig. S3† demonstrated its crystal structure remained unchanged after the reaction. Moreover, no significant aggregation of nanoparticles was discovered in TEM image of the used catalyst, although the average nanoparticle size in the used catalyst increased slightly from 9.5 to 11.0 nm. These results all confirmed the excellent stability of CuCrSr/Al2O3 catalyst.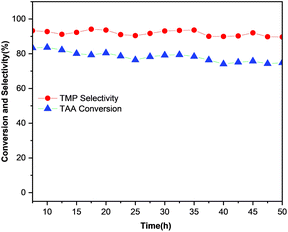 | ||
| Fig. 8 Time on stream performance of CuCrSr/Al2O3. Reaction conditions: 6 mL catalysts, 120 °C, 4 MPa H2, flow rate of TAA ethanol solution = 0.2 mL min−1 (20%). | ||
3.6 Structure–activity correlation
Analysis of catalyst structure–activity relationship is essential for the understanding of catalysis and catalyst design. Generally, high dispersion of the active metal species was crucial for improving catalytic activity.38 The well-dispersed Cu nanoparticles on the catalyst could provide more active sites and improve the contact efficiency of hydrogenation to yield target TMP. According to the characterization results, the decreased size of CuCrSr/Al2O3 nanoparticles was evident compared with Cu/Al2O3 and CuCr/Al2O3. This would be the main reason for the excellent catalytic performance of TAA hydrogenation.Moreover, the surface compositions and chemical states of Cu-based catalysts would also influence the catalytic performance.32 According to XPS results, the amount of Cu+ proportion increased with the introduction of Sr. Typically, Cu+ species could act as sites for adsorption and activation of C![[double bond, length as m-dash]](https://www.rsc.org/images/entities/char_e001.gif) O bond.32,39 Thus, the increased amount of Cu+ proportion could facilitate the reaction process. Besides, Cu0 species are generally regarded as the sites for activating and dissociating hydrogen for hydrogenation reactions.40 Therefore, we can infer that the rational proportion of Cu0 and Cu+ was one of the reasons for enhancing catalytic effectiveness.
O bond.32,39 Thus, the increased amount of Cu+ proportion could facilitate the reaction process. Besides, Cu0 species are generally regarded as the sites for activating and dissociating hydrogen for hydrogenation reactions.40 Therefore, we can infer that the rational proportion of Cu0 and Cu+ was one of the reasons for enhancing catalytic effectiveness.
Furthermore, the doped Sr not only promoted the dispersion of Cu and affected the electronic state of surface Cu species, but also regulated the surface acidic sites on the catalyst. As previously analyzed, the surface acidity might cause the adsorption of TAA and TMP molecules and break the C–N bond, leading to the generation of byproducts. Based on NH3-TPD characterization, the surface acidity environment of CuCrSr/Al2O3 catalyst was significantly diminished by doped Sr, which would reduce the occurrence of side reactions to a certain extent and boost the hydrogenation reaction. This might be one of the reasons why CuCrSr/Al2O3 catalyst showed excellent selectivity.
To sum up, these discussions demonstrated that the catalytic activity towards TMP was not only related to highly dispersed Cu, but also associated with the surface compositions and suitable acidity of catalysts.
4. Conclusions
In this work, we have developed a continuous process of TAA to TMP over CuCrSr/Al2O3. Complete TAA conversion and 97.67% TMP selectivity were obtained. The characterization results revealed that the doped Sr promoted the dispersion of Cu, adjusted the surface compositions, and diminished the surface acidity of the catalyst. The nanoparticle size of CuCrSr/Al2O3 decreased from 25.8 to 9.5 nm, which provided more active sites and improved the contact efficiency of hydrogenation. Introducing Sr could adjust the proportion of Cu+/Cu0, and the rational proportion would promote the adsorption of substrates and catalytic performance. Besides, the doped Sr decreased the acid strength and amount of Al2O3, which inhibited the adsorption and catalytic cracking of the C–N bond in TAA and TMP molecules, thus reducing the occurrence of side reactions. The catalyst showed excellent stability in long-term test. These results were beneficial to the development of efficient and stable Cu based catalysts for production of TMP.Conflicts of interest
There are no conflicts to declare.Acknowledgements
This work was supported by National Natural Science Foundation of China [grant numbers U22A20428] and Hebei Provincial Department of Science and Technology [grant number 216Z1403G].Notes and references
- F. A. Wang, J. Zhu, J. Song, S. Zhai and L. Wang, Molecules, 2001, 6, 528–532 CrossRef CAS.
- M. A. Chinelatto, J. A. M. Agnelli and S. V. Canevarolo, Polímeros, 2015, 25, 575–580 CrossRef CAS.
- R. V. Todesco and N. Ergenc, Chimia, 2002, 56, 225 CrossRef CAS.
- F. Gugumus, Polym. Degrad. Stab., 1994, 44, 273–297 CrossRef CAS.
- C. Schaller, D. Rogez and A. Braig, J. Coat. Technol. Res., 2009, 6, 81–88 CrossRef CAS.
- R. d. Chai and J. Zhang, Polym. Eng. Sci., 2013, 53, 1760–1769 CrossRef CAS.
- W. B. Lutz, S. Lazarus and R. I. Meltzer, J. Org. Chem., 1962, 27, 1695–1703 CrossRef CAS.
- E. Sh. Kagan, I. A. Avrutskaya, S. V. Kondrashov, V. T. Novikov, M. Ya. Fioshin and V. A. Smirnov, Chem. Heterocycl. Compd., 1984, 20, 288–289 CrossRef.
- M. Irfan, T. N. Glasnov and C. O. Kappe, ChemSusChem, 2011, 4, 300–316 CrossRef CAS PubMed.
- K. Siegfried, DE pat., 2656764A1, 1997 Search PubMed.
- K. D. Mukherjee, I. Kiewitt and M. Kiewitt, J. Am. Oil Chem. Soc., 1975, 52, 282–288 CrossRef CAS.
- D. Liu, D. Zemlyanov, T. Wu, R. J. Lobo-Lapidus, J. A. Dumesic, J. T. Miller and C. L. Marshall, J. Catal., 2013, 299, 336–345 CrossRef CAS.
- K. Wilson, Appl. Organomet. Chem., 2007, 21, 1002 CrossRef CAS.
- G. Ertl, H. Knözinger, F. Schüth and J. Weitkamp, Handbook of Heterogeneous Catalysis, Wiley-VCH, 2008 Search PubMed.
- G. V. Smith and F. Notheisz, Heterogeneous catalysis in organic chemistry, Academic, 1999 Search PubMed.
- S. Kuniko, JP pat., 2002001118A, 2002 Search PubMed.
- R. Membrat, A. Vasseur, D. Moraleda, S. Michaud-Chevallier, A. Martinez, L. Giordano and D. Nuel, RSC Adv., 2019, 9, 37825–37829 RSC.
- J. Ma, S. Liu, X. Fan, X. Du, X. Yan and L. Chen, Chin. J. Catal., 2012, 33, 605–609 CrossRef CAS.
- R. Prins, Y. Zhao, N. Sivasankar and P. Kukula, J. Catal., 2005, 234, 509–512 CrossRef CAS.
- Y. Zeng, B. Wang, W. Xu, X. Yan, Y. Li, G. Bai and L. Chen, Catal. Sci. Technol., 2022, 12, 2084–2096 RSC.
- A. Saadi, Z. Rassoul and M. M. Bettahar, J. Mol. Catal. A: Chem., 2000, 164, 205–216 CrossRef CAS.
- F. Dong, Y. Zhu, H. Zheng, Y. Zhu, X. Li and Y. Li, J. Mol. Catal. A: Chem., 2015, 398, 140–148 CrossRef CAS.
- F. Dong, G. Ding, H. Zheng, X. Xiang, L. Chen, Y. Zhu and Y. Li, Catal. Sci. Technol., 2016, 6, 767–779 RSC.
- X. Cai, Y. Ke, B. Wang, Y. Zeng, L. Chen, Y. Li, G. Bai and X. Yan, Mol. Catal., 2021, 508, 111608 CrossRef CAS.
- C. P. Jiménez-Gómez, J. A. Cecilia, F. I. Franco-Duro, M. Pozo, R. Moreno-Tost and P. Maireles-Torres, Mol. Catal., 2018, 455, 121–131 CrossRef.
- K. Yan and A. Chen, Energy, 2013, 58, 357–363 CrossRef CAS.
- J. J. Bravo-Suárez, B. Subramaniam and R. V. Chaudhari, Appl. Catal., A, 2013, 455, 234–246 CrossRef.
- M. Konsolakis and Z. Ioakeimidis, Appl. Surf. Sci., 2014, 320, 244–255 CrossRef CAS.
- M. C. Biesinger, Surf. Interface Anal., 2017, 49, 1325–1334 CrossRef CAS.
- M. C. Biesinger, L. W. M. Lau, A. R. Gerson, R. St and C. Smart, Appl. Surf. Sci., 2010, 257, 887–898 CrossRef CAS.
- C. Lin, J. Li, H. Guo, X. Wu, B. Wang and X. Yan, Catal. Commun., 2018, 111, 64–69 CrossRef CAS.
- A. Li, D. Yao, Y. Yang, W. Yang, Z. Li, J. Lv, S. Huang, Y. Wang and X. Ma, ACS Catal., 2022, 12, 1315–1325 CrossRef CAS.
- B. P. Payne, M. C. Biesinger and N. S. McIntyre, J. Electron Spectrosc. Relat. Phenom., 2011, 184, 29–37 CrossRef CAS.
- R. P. Vasquez, J. Electron Spectrosc. Relat. Phenom., 1991, 56, 217–240 CrossRef CAS.
- Z. Yu, F. Meng, Y. Wang, Z. Sun, Y. Liu, C. Shi, W. Wang and A. Wang, Ind. Eng. Chem. Res., 2020, 59, 7416–7425 CrossRef CAS.
- L. Chen, T. V. W. Janssens, M. Skoglundh and H. Grönbeck, Top. Catal., 2019, 62, 93–99 CrossRef CAS.
- K. Ouyang, W. Hao, W.-X. Zhang and Z. Xi, Chem. Rev., 2015, 115, 12045–12090 CrossRef CAS PubMed.
- K. Zhou, X. Sun, Y. Muhammad, P. Hu, Y. Li, Z. Tong and Z. Zhao, Appl. Catal., A, 2018, 555, 138–147 CrossRef CAS.
- X. Yuan, S. Chen, D. Cheng, L. Li, W. Zhu, D. Zhong, Z.-J. Zhao, J. Li, T. Wang and J. Gong, Angew. Chem., 2021, 133, 15472–15475 CrossRef.
- Y. Zeng, B. Wang, F. Yan, W. Xu, G. Bai, Y. Li, X. Yan and L. Chen, ChemCatChem, 2022, 14, e202200311 CrossRef CAS.
Footnotes |
| † Electronic supplementary information (ESI) available. See DOI: https://doi.org/10.1039/d2ra08306j |
| ‡ These authors contributed equally to this work. |
| This journal is © The Royal Society of Chemistry 2023 |

