
 Open Access Article
 This Open Access Article is licensed under a Creative Commons Attribution-Non Commercial 3.0 Unported Licence
On-line pre-column FRAP-based antioxidant reaction coupled with HPLC-DAD-TOF/MS for rapid screening of natural antioxidants from different parts of Polygonum viviparum†
Zheng-ming Qian ab,
Xin-jie Chengcd,
Qiao Wangb,
Qi Huang*b,
Li-ling Jinb,
Ya-fei Mac,
Jia-sheng Xiee and
De-qiang Li*c
ab,
Xin-jie Chengcd,
Qiao Wangb,
Qi Huang*b,
Li-ling Jinb,
Ya-fei Mac,
Jia-sheng Xiee and
De-qiang Li*c
aCollege of Medical Imaging Laboratory and Rehabilitation, Xiangnan University, Chenzhou 423000, Hunan Province, China
bDongguan HEC Cordyceps R&D Co., Ltd., No. 368, Zhen'an Middle Road, Chang'an Town, Dongguan 523850, Guangdong Province, China. E-mail: liqilingssz@163.com
cDepartment of Pharmacy, The Second Hospital of Hebei Medical University, No. 215, Heping West Road, Shijiazhuang 050000, Hebei Province, China. E-mail: deqli@163.com
dNational Cancer Center/National Clinical Research Center for Cancer/Hebei Cancer Hospital, Chinese Academy of Medical Sciences, Langfang, China
eGuangdong Mige Sunshine Technology Co. Ltd., Guangzhou 510700, Guangdong Province, China
First published on 23rd March 2023
Abstract
Polygonum viviparum L. (PV) is a widely used resource plant with high medicinal, feeding and ecological values. Our studies show that PV has strong antioxidant activity. However, up to date, the antioxidant activity and components in other parts were not fully elucidated. In the present study, a new online pre-column ferric ion reducing antioxidant power (FRAP)-based antioxidant reaction coupled with high performance liquid chromatography-diode array detector-quadrupole-time-of-flight mass spectrometry (HPLC-DAD-TOF/MS) was developed for rapid and high-throughput screening of natural antioxidants from three different parts of PV including stems and leaves, fruits and rhizomes. In this procedure, it was assumed that the peak areas of compounds with potential antioxidant activity in HPLC chromatograms would be greatly diminished or vanish after incubating with the FRAP. The online incubation conditions including mixed ratios of sample and FRAP solution and reaction times were firstly optimized with six standards. Then, the repeatability of the screening system was evaluated by analysis of the samples of stems and leaves of PV. As a result, a total of 21 compounds mainly including flavonoids and phenolic acids were screened from the three parts of PV. In conclusion, the present study provided a simple and effective strategy to rapidly screen antioxidants in natural products.
1. Introduction
Free radicals, which participate in oxidation in the body, can benefit the body in the right amount, but too much is worse than not enough. Excessive accumulation of free radicals in the body will lead to the occurrence of various diseases, including tumors, coronary heart disease, diabetes, etc.1,2 Therefore, antioxidants that inhibit free radical oxidation are likely to have therapeutic effects on these diseases. Over the years, a large number of antioxidants have been identified in natural products, such as flavonoids, polysaccharides, peptides, acids, and vitamins, and it has been found that antioxidants abundant in natural products are easy to obtain with good activity and few side effects on the body.3 Hence, screening antioxidants with potential therapeutic effects from natural products has good prospects for application.Polygonum viviparum (PV), also named “ranbu” in Tibetan medicine, is the rhizomes of Polygonum viviparum L. which mainly grows under the hillside forest, in the alpine or subalpine meadow, at an altitude of 1200–5100 meters. It has the functions of relieving diarrhea, strengthening the stomach and regulating menstruation.4 Modernization studies have shown that PV contains volatile oils, organic acids, flavonoids, sterols, polysaccharides and other components.5–7 Our previous studies demonstrated that PV exhibits significant antioxidant activity, which is mainly attributed to the contribution of organic acids and flavonoids.8,9 However, up to date, the antioxidant activity and components in other parts have not been thoroughly elucidated. Thus, in order to completely develop the application potential of this medicinal material, it is necessary to fully explore the antioxidant activities and components of different parts.
It is well recognized that such a medicinal material is a complex system consisting of hundreds or even thousands of different compounds, making it a difficult task to rapidly discover the active ingredients.10 As an alternative to the traditional chemical separation approach, several analytical strategies by post-column11 or pre-column derivatization12 coupled with the techniques of sample separation and identification were fortunately developed for rapid screening of natural antioxidants in a complex mixture. For rapid identification of antioxidants, the fast post-column chemical detection based on a single relatively stable reagent such as 1,1-diphenyl-2-picrylhydrazyl (DPPH˙) and 2,2′-azino-bis-(3-ethylbenzothiozoline-6-sulfonic acid) (ABTS˙+) combined with a separation technique like HPLC as well as the on-line rapid identification of active constituents by DAD, MS and NMR detection is popularly used.11 Although it incorporates the separation, identification and antioxidant activity assessment of chemical components, it suffers from limited reaction time, constant introduction of reagents and a complex establishment process. On the other hand, HPLC analysis coupled with pre-column antioxidant assay has been successfully applied in several natural products.12–14 This method involves chromatographic evaluation after spiking the extract with DPPH· solution and the ability of antioxidant constituents to be transformed after reaction with radical species is relied upon. On this basis, the chromatogram of spiked extracts shows a reduction or disappearance in the peak area of the bioactive compounds, while the inactive components are not affected by any modifications. Nevertheless, the off-line mix mode prior to separation is commonly completed manually, which is time-consuming and consumes large amounts of samples as well as reagents. Therefore, developing a rapid, effective and cost-saving screening platform technique to elucidate the antioxidant active components is necessary.
In the present study, thus, in order to further explore the antioxidants activity of PV and to rapidly identify the active ingredients, the antioxidant capabilities of different parts (stems and leaves, fruits and rhizomes) of PV were firstly assessed by traditional off-line antioxidant tests (ABTS, DPPH and FRAP methods). Then, mixed standards and samples of stems and leaves were used to optimize and test the on-line pre-column FRAP-HPLC system (Fig. S1†), respectively. Finally, the antioxidant compounds of different parts of PV were rapidly characterized by the newly developed on-line pre-column antioxidant assay.
2. Materials and methods
2.1 Reagents and materials
The standards including chlorogenic acid, neochlorogenic acid, quercetin-3-O-glucuronide, avicularin, rutin, and hyperoside (purity of HPLC >98%) were purchased from the Ronghe Biotechnology Co. Ltd. (Shanghai, China). 2,2′-Azinobis (3-ethylbenzothiazoline-6-sulfonic acid ammonium salt) (ABTS), 2,2-diphenyl-1-picrylhydrazyl (DPPH), 2,4,6-tri(2-pyridyl)-1,3,5-triazine (TPTZ), anhydrous ferric chloride, and potassium persulfate were supplied by Aladdin Biochemical Technology Co. Ltd. (Shanghai, China). Formic acid (analytical grade) was provided by Thermo Fisher Technology Co. Ltd. (Shanghai, China). HPLC-grade methanol, ethanol, and acetonitrile were obtained from Merck (Darmstadt, Germany). Ultrapure water used in this study was obtained by a Milli-Q water purification system (Millipore, Billerica, MA, USA). All other chemicals and reagents used were of analytical grade.PV (from Nyingchi, Tibet, China) was donated by Dongguan Dongyangguang Cordyceps Research and Development Co., Ltd. and identified as the stem and leaf, fruit, and rhizome of Polygonum viviparum L. in the Polygonaceae family by the author, Qian Zhengming, a senior engineer at the key research office of the State Administration of Traditional Chinese Medicine, Dongguan, Guangdong, China.
2.2 Solutions preparations
![[thin space (1/6-em)]](https://www.rsc.org/images/entities/char_2009.gif) :1:10.
:1:10.2.3 Sample preparations
:20, g mL−1) was added to mix evenly. The samples were sonicated for 30 min, and the supernatant was collected after centrifugation for 10 min (5000 rpm). The residue was repeatedly extracted once, and the supernatant was combined to be evaporated and concentrated in a constant temperature water bath to dry. As a result, 1.15 g stem and leaf extract, 1.53 g fruit extract, and 1.32 g rhizome extract were obtained, respectively. The three extracts were then dissolved with 50% ethanol or methanol into a series of concentration sample solutions (2.00–0.00375 μg mL−1) for offline antioxidant determination of ABTS, DPPH and FRAP.2.4 Antioxidant activity assay of different parts of PV
where, A0, A1, and A2 represent the absorbance of the blank without extract, extract, and the control without ABTS, respectively. With rutin as control, the clearance rate and 50% inhibition rate (IC50) were calculated.

where, A0, A1, and A2 represent the absorbance of the blank with absence of extract, extract, and the control without DPPH, respectively.
2.5 Analytical conditions
The Agilent 1260 liquid chromatography system (Agilent, USA), equipped with a G1311C quaternary solvent delivery system, a G1329B auto-sampler, a G1316A column compartment and a G1315D diode array detector, was used to analyze the chemical compounds of different parts. The chromatographic separation was performed on an Agilent Poroshell 120 EC-C18 (150 mm × 4.6 mm, 2.7 μm), and the column temperature was kept at 25 °C. The mobile phase was composed of 0.1% aqueous formic acid (A) and acetonitrile (B) at a flow rate of 1 mL min−1 with a gradient elution procedure as following: 0–5 min, 10–11% B; 5–10 min, 11–16% B; 10–30 min, 16–25% B; 30–35 min, 25–80% B. The effluents from HPLC were monitored by a diode array detector (DAD) at 340 nm and the injection volume for off-line samples was 5 μL.Half of the eluent from analytical column was split into Q-TOF-MS for qualitative detection. The mass spectrometer with an ESI source was operated in negative scan mode from m/z 100 to m/z 10–1000. The electrospray ionization MS conditions were as follows: capillary voltage, 3500 V; collisions-induced dissociation voltage, 120 V; drying gas (N2) flow rate, 8 L min−1; drying gas temperature, 350 °C; nebulizer pressure, 38 psi; sheath gas flow rate, 11 L min−1.
2.6 Antioxidants screening by on-line pre-column FRAP-based antioxidant reaction coupled with HPLC-DAD-TOF/MS
In this study, pre-column derivatization analysis of oxidation solution was carried out by the mixture injection procedure of Agilent HPLC (Fig. S1†). Firstly, the mixing parameters were set in the HPLC mixing procedure, that is, 5 μL of PV ultrasonic extract from each part of the sample was mixed with 15 μL FRAP working solution for 5 times. After standing for 6 min, the samples were determined according to “2.5 Analytical conditions”. The FRAP solution was replaced with 50% methanol and the other operations were performed in parallel. The peak area of each chromatographic peak at 340 nm was calculated according to HPLC peak area normalization method, and then the relative reduction of peak area was calculated. The relative reduction of peak area allowed comparison of the antioxidant difference among substances can be compared. All samples were determined three times.| Relative reduction of peak area = [(peak area before A reaction − peak area after A reaction)/peak area before A reaction] × 100% |
2.7 Statistical analysis
All assays were conducted in triplicate. The values were expressed as means ± standard deviation (n = 3). One-way ANOVA followed by Tukey's test was applied using GraphPad Prism 8.0 for the analysis of the data. The different levels of comparison for the determination of significance were *P < 0.05, and ***P < 0.001.3. Results and discussion
3.1 Antioxidant activities of different parts of PV
To compare the antioxidant activities of different parts of PV, three different antioxidant assays including ABTS method, DPPH method and FRAP method were adopted. Using rutin as controls, different parts of PV displayed different inhibitory efficiencies. It can be seen from Fig. 1A, by ABTS method, the inhibitions of ABTS radicals of different parts of PV were in the order of rhizomes (IC50 = 0.029 ± 0.001 mg mL−1) > fruits (IC50 = 0.063 ± 0.003 mg mL−1) > stems and leaves (IC50 = 0.079 ± 0.004 mg mL−1); using DPPH method (Fig. 1B), the inhibitions of DPPH radicals of them were in the order of rhizomes (IC50 = 0.118 ± 0.005 mg mL−1) > fruits (IC50 = 0.336 ± 0.016 mg mL−1) > stems and leaves (IC50 = 0.433 ± 0.021 mg mL−1). With FRAP method, the standard curve was drawn with FeSO4 as the standard substance, and the regression equation was Y = 0.6686X − 0.0009, the correlation coefficient was R2 = 0.9999. The order of FRAP reducing ability of PV in different parts was as follows: rhizomes (1.757 ± 0.012 mM) > fruits (1.059 ± 0.004 mM) > stems and leaves (0.496 ± 0.003 mM) (Fig. 1C). Consistent results were obtained using all the three antioxidant assays, and different parts all showed obvious antioxidant activities with the rhizomes of PV showing the strongest antioxidant activity. | ||
| Fig. 1 Antioxidant activities of different parts of PV ((A) ABTS method; (B) DPPH method; (C) FRAP method). | ||
Antioxidant capacity results for three parts of PV samples were as follows: rhizomes > fruits > stems and leaves. This result is consistent with the traditional use of PV in that rhizomes are medicinal herbs, fruits are functional foods, but stems and leaves are rarely used. Medicinal parts (rhizomes) process the best antioxidant activity than non-medicinal parts. It is said that fruits, stems and leaves cannot be used the same as rhizomes, but they also have an opportunity to become a new source of medicinal resources. The safety of fruit has been reported, which has been used as a functional food for many years.18,19 The toxicity of stem and leaf has not yet been reported and needs further study.
3.2 Optimization of ultrasonic extraction (UAE)
Taking stems and leaves of PV as an example, the UAE parameters including different methanol concentrations, solid–liquid ratios, and extraction time were optimized by using the single-factor method. First, methanol solutions with different concentrations (25%, 50%, 75%, and 100%) were investigated. The result showed that the separation effect of chromatographic peaks had little differences using various methanol concentrations (Fig. S2A†). The chromatographic peak was lower when 100% methanol was used, while the extracted solution with 25% methanol was with greater viscosity and 75% methanol contained more organic solvents. Therefore, 50% methanol solution was selected as the extraction solvent. Then, the different solid–liquid ratios (1:10/20/30/40/50, g mL−1) were compared. The result illustrated that all the condition can extract the components well (Fig. S2B†). Under solid–liquid rate 1:20, the chromatographic peaks height was moderate, so it was used in current experiment. In addition, we compared the extraction time (10, 20, 30 and 40 min), finding that 10 min ultrasonic extraction time could complete the efficiency extraction for the chemical components of samples (Fig. S2C†). So, an ultrasonic extraction time of 10 min was finally adopted.
3.3 HPLC-QTOF-MS/MS analysis of the compounds in different parts of PV
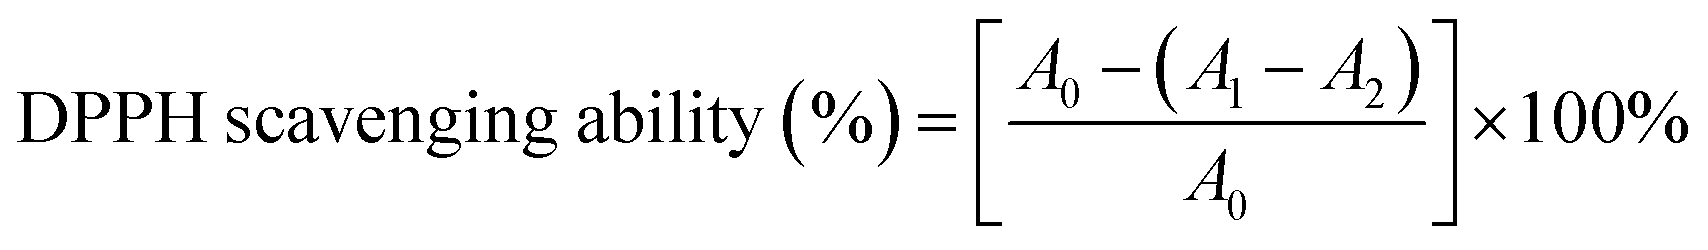
For sample analysis, the mobile phase, column temperature and detection wavelength of HPLC were first optimized. By comparing different mobility (0.1% aqueous formic acid–acetonitrile, 0.2% aqueous acetic acid–acetonitrile, and water–acetonitrile), the results displayed that when the mobile phase was water–acetonitrile, the chromatographic peak separation effect was significantly decreased and the peak shape is also poor. When the mobile phase is 0.1% aqueous formic acid–acetonitrile and 0.2% aqueous acetic acid–acetonitrile, there was no difference in the separation of the chromatographic peaks, but when the mobile phase was 0.1% aqueous formic acid–acetonitrile, the separation effect of individual peaks was better. As a result, 0.1% aqueous formic acid–acetonitrile was selected as the mobile phase. At the same time, different column temperatures (25 °C, 30 °C, 35 °C) and different detection wavelengths (254 nm and 340 nm) were compared. The results showed that the resolution of chromatographic peak was slightly better when the column temperature was 25 °C, while there was no difference between the detection wavelengths of 254 nm and 340 nm. However, when the detection wavelength was 340 nm, the chromatographic baseline was stable and the chromatographic peak response value was good. Therefore, 340 nm was selected as the experimental detection wavelength.As for mass spectrometry analysis, the pre-experiment results showed the chemical components of PV had less interference and higher response in the negative ion mode than positive ion mode. Therefore, the negative ion mode was used in this experiment. The HPLC chromatograms were shown in Fig. 2(A1–D1), and the HPLC-MS chromatograms (Fig. S3†) and the data of compounds were summarized in Table 1. According to the results, twenty-one chromatographic peaks from different parts of PV were marked by UAE. Five chromatographic peaks were unambiguously identified as neochlorogenic acid (peak 3), chlorogenic acid (peak 6), rutin (peak 12), hyperoside (peak 13), and quercetin-3-O-glucuronide (peak 14) based on the retention time and mass spectrometric data of chromatographic peaks of reference substances. Furthermore, by checking each chromatographic peak mass spectrometry data with literatures, eleven of chromatographic peaks were tentatively identified as gallic acid hexoside (peak 1), gallic acid (peak 2), catechin (peak 7), caffeic acid (peak 8), quercetin-3-O-vicianoside (peak 9), quercetin-4′-O-glucuronide (peak 10), rutin isomers (peak 11), isoquercitrin (peak 15), kaempferol-3-O-glucuronide (peak 16), baicalin (peak 19), and hispidulin-7-O-glucuronide (peak 20), and five unknown peaks for further identification.
 | ||
| Fig. 2 Chromatograms of the mixed standard and UAE extracts of different parts of PV. (*: avicularin, and it was not identified in the samples; A1, B1, C1, D1 represent the chromatograms before reaction with FRAP, A2, B2, C2, D2 represent the chromatograms after reaction with FRAP). | ||
| No | Molecular formula | [M–H]− (m/z) | Fragmentation (m/z) | Identification | Different parts | Ref. | ||
|---|---|---|---|---|---|---|---|---|
| Stems-leaves | Fruits | Rhizomes | ||||||
| a “√” and “—” mean the presence and absence this component, respectively. | ||||||||
| 1 | C13H16O10 | 331.0647 | 271.0445, 211.0227, 124.0147 | Gallic acid hexoside | — | √ | √ | 20 |
| 2 | C7H6O5 | 169.0134 | 125.0234, 79.0172 | Gallic acid | √ | √ | √ | 20 |
| 3 | C16H18O9 | 353.0869 | 191.0545, 179.0112, 135.0444 | Neochlorogenic acid | √ | √ | √ | 20 |
| 4 | N/A | 359.0160 | 268.8860, 168.9963, 151.0012 | Unknown 1 | — | √ | — | — |
| 5 | N/A | 503.0210 | 323.0047, 233.9942, 160.9841 | Unknown 2 | — | √ | — | — |
| 6 | C16H18O9 | 353.0874 | 191.0554, 179.0353, 135.0427 | Chlorogenic acid | √ | √ | √ | 20 |
| 7 | C15H14O6 | 289.0714 | 245.0205, 203.0800, 109.0264 | Catechin | √ | √ | √ | 20 |
| 8 | C9H8O4 | 179.0349 | 179.0240, 135.0460 | Caffeic acid | — | √ | — | 20 |
| 9 | C26H28O16 | 595.1305 | 300.0262, 271.0258 | Quercetin-3-O-vicianoside | √ | — | — | 20 |
| 10 | C21H20O12 | 463.0838 | 301.0356, 271.0236, 151.0032 | Quercetin-4′-O-glucopyranoside | — | — | √ | 20 |
| 11 | C27H30O16 | 609.1457 | 300.0264, 271.0254 | Rutin isomers | √ | — | — | 20 |
| 12 | C27H30O16 | 609.1456 | 301.0302, 179.0003, 151.0042 | Rutin | √ | √ | √ | 20 |
| 13 | C21H20O12 | 463.0884 | 300.0268, 271.0255 | Hyperoside | √ | — | — | 21 |
| 14 | C21H18O13 | 477.0649 | 477.0652, 301.0345, 255.0285, 178.9985, 151.0030 | Quercetin-3-O-glucuronide | √ | √ | √ | 20 |
| 15 | C21H20O12 | 463.0878 | 463.0852, 300.0263, 271.0244 | Isoquercitrin | √ | √ | √ | 22 |
| 16 | C21H18O12 | 461.0710 | 285.0382, 199.0388, 133.0294 | Kaempferol-3-O-glucuronide | √ | — | — | 20 |
| 17 | N/A | 505.0894 | 505.0869, 301.0361, 300.0267 | Unknown 3 | √ | — | — | — |
| 18 | C21H20O11 | 447.0933 | 447.0897, 300.0260, 271.0238, 151.0035 | Unknown 4 | √ | — | — | — |
| 19 | C21H18O11 | 445.0774 | 445.0753, 269.0433, 251.0078, 195.0598 | Baicalin | √ | — | — | 23 |
| 20 | C22H20O12 | 475.0866 | 299.0549, 284.0308 | Hispidulin-7-O-glucuronide | √ | — | — | 20 |
| 21 | N/A | 533.0936 | 489.0958, 300.0278, 271.0245 | Unknown 5 | √ | √ | — | — |
3.4 Establishment of the on-line mixed injection FRAP-HPLC system
In the present study, an on-line mixed injection HPLC-FRAP antioxidant analysis was established for the first time with six standards using the mixing injection program that comes with the Agilent HPLC machine, and the reaction ratio and reaction time of the sample with the oxidizing solution were investigated using the machine's own mixing injection program. As shown in Table 2, the antioxidant reaction effect was more obvious when the reaction ratio of mixed-standard solution and FRAP working solution was 1:3, and the antioxidant effect was more obvious as the time was extended. To save the reaction time, the reaction ratio of sample and FRAP was finally selected as 1:3 and the reaction time was 6 min. In previous reports, pre-column HPLC-DPPH antioxidant systems were mostly used to screen the components with antioxidant activity in herbal medicines, by which the samples usually mixed and reacted with the oxidation solution for 20–40 min before HPLC analysis, and the components with antioxidant activity were then screened by the changes in peak area of each components before and after the reaction between the samples and the oxidation solution.12 In contrast, the present method showed the advantages of simplicity, convenience and accuracy.
| No | tR/min | Compounds | Different mixed ratios | Different reaction time | |||||||
|---|---|---|---|---|---|---|---|---|---|---|---|
| 1:1 |
1:2 |
1:3 |
2:1 |
0 min | 2 min | 4 min | 6 min | 8 min | |||
| a Peak area relative reduction (PARR%) = ((Abefore reaction − Aafter reaction)/Abefore reaction) × 100%. | |||||||||||
| 1 | 4.020 | Neochlorogenic acid | 20.67 | 30.14 | 37.38 | 9.89 | 26.54 | 33.59 | 42.76 | 46.25 | 48.39 |
| 2 | 6.686 | Chlorogenic acid | 23.27 | 33.08 | 40.84 | 12.36 | 33.13 | 40.03 | 47.87 | 50.74 | 52.69 |
| 3 | 16.691 | Rutin | 8.44 | 14.91 | 21.92 | 3.65 | 18.56 | 20.82 | 24.56 | 25.26 | 25.73 |
| 4 | 17.211 | Hyperoside | 10.90 | 19.07 | 28.45 | 5.80 | 22.88 | 27.49 | 32.62 | 33.82 | 34.34 |
| 5 | 17.638 | Quercetin-3-O-glucuronide | 9.68 | 16.88 | 24.69 | 5.70 | 22.25 | 26.75 | 30.88 | 32.46 | 33.64 |
| 6 | 20.991 | Avicularin | 2.65 | 6.83 | 12.10 | 1.02 | 9.85 | 10.44 | 13.17 | 13.92 | 14.08 |
3.5 Repeatability of the on-line mixed injection FRAP-HPLC system
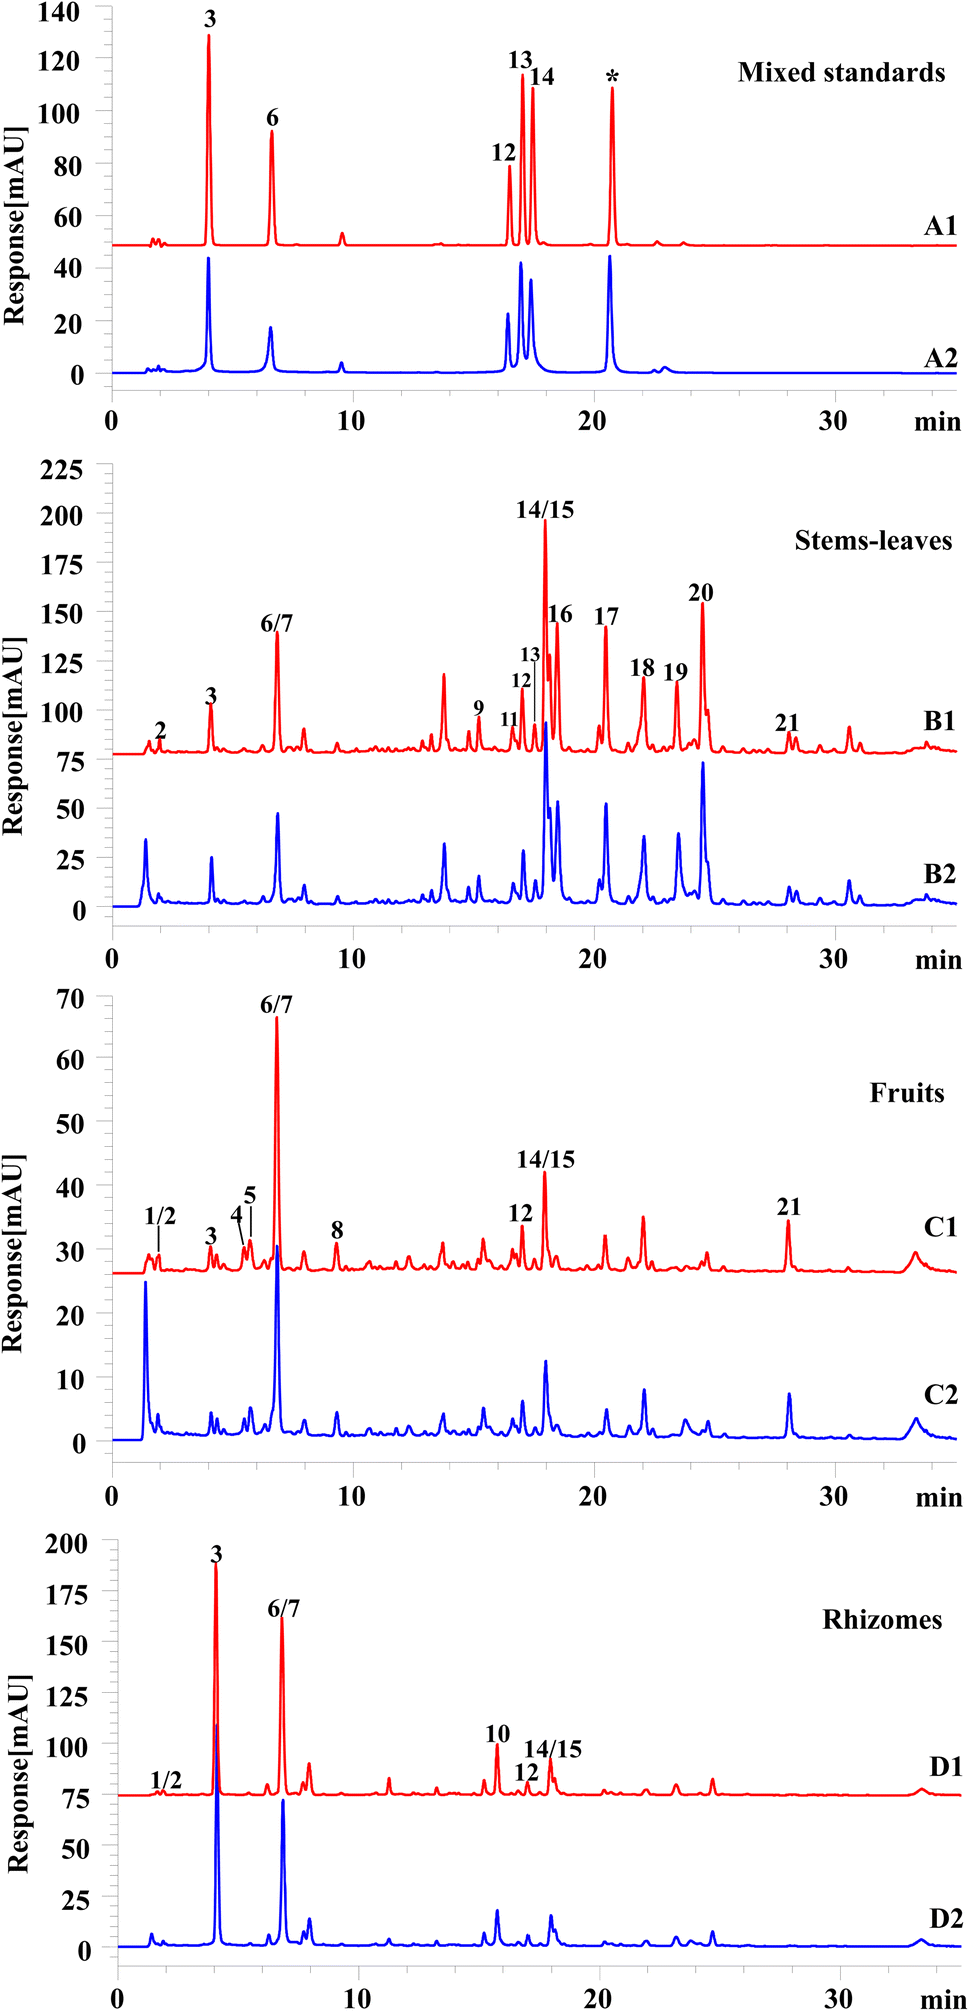
To verify the repeatability of the established on-line screening system, three parallel samples of stems and leaves were prepared and analyzed according to “Section 2.3.2” and “Section 2.6”, respectively. The chromatograms were shown in Fig. 3 and the variants (RSDs) of peak areas and retention time of the compounds in parallel test and control samples were calculated. The results in Tables 3 and 4 uncovered that the RSDs of peak area and retention time of the same compounds in blank group or experiment group were less than 3%, indicating that the chromatographic system has well stability and repeatability. | ||
| Fig. 3 Chromatograms of repeatability investigation ((A) blank group; (B) experiment group). | ||
| No | Group 1 | Group 2 | Group 3 | RSD (%) | ||||
|---|---|---|---|---|---|---|---|---|
| Retention time | Peak area | Retention time | Peak area | Retention time | Peak area | Retention time | Peak area | |
| 1 | 4.080 | 199.062 | 4.087 | 202.590 | 4.113 | 192.287 | 0.42 | 2.64 |
| 2 | 6.799 | 549.423 | 6.800 | 553.452 | 6.832 | 558.226 | 0.28 | 0.80 |
| 3 | 16.979 | 222.358 | 16.967 | 233.539 | 16.998 | 229.786 | 0.09 | 2.49 |
| 4 | 18.392 | 516.310 | 18.413 | 527.044 | 18.418 | 525.621 | 0.07 | 1.11 |
| 5 | 20.405 | 465.723 | 20.400 | 484.883 | 20.424 | 474.124 | 0.06 | 2.02 |
| 6 | 21.958 | 462.212 | 21.960 | 462.526 | 21.964 | 454.606 | 0.01 | 0.98 |
| 7 | 23.318 | 336.188 | 23.327 | 335.322 | 23.337 | 341.449 | 0.04 | 0.98 |
| 8 | 24.371 | 817.602 | 24.387 | 837.288 | 24.390 | 837.452 | 0.04 | 1.30 |
| No | Group 1 | Group 2 | Group 3 | RSD (%) | ||||
|---|---|---|---|---|---|---|---|---|
| Retention time | Peak area | Retention time | Peak area | Retention time | Peak area | Retention time | Peak area | |
| 1 | 4.107 | 151.239 | 4.073 | 152.516 | 4.087 | 158.075 | 0.42 | 2.36 |
| 2 | 6.846 | 442.551 | 6.799 | 439.018 | 6.813 | 459.302 | 0.35 | 2.42 |
| 3 | 17.033 | 190.036 | 16.991 | 189.222 | 16.980 | 198.688 | 0.16 | 2.72 |
| 4 | 18.439 | 385.161 | 18.438 | 378.099 | 18.420 | 390.898 | 0.06 | 1.67 |
| 5 | 20.453 | 382.193 | 20.464 | 377.597 | 20.433 | 383.880 | 0.08 | 0.85 |
| 6 | 22.033 | 407.970 | 22.011 | 409.596 | 22.006 | 400.804 | 0.07 | 1.15 |
| 7 | 23.393 | 270.126 | 23.390 | 262.541 | 23.360 | 270.971 | 0.08 | 1.73 |
| 8 | 24.432 | 791.769 | 24.450 | 760.633 | 24.413 | 796.090 | 0.08 | 2.47 |
3.6 Antioxidants screening of different parts of PV by the on-line mixed injection FRAP-HPLC system
The maximum absorbance of antioxidant will change significantly after reaction with FRAP. The compounds have antioxidant activity could be found by comparing the peak area of their peak areas or height between before and after reaction with FRAP solution. The peak areas or height of compounds with antioxidant effect would be significantly decreased, while compounds with weak or no antioxidant effect will show little change in peak areas or height. In present study, the antioxidant active components in different parts of PV were screened by comparing the chromatograms before and after the reaction between the sample and FRAP solution. As could be seen from Fig. 2 and Table 5, a total of 21 compounds were found from various parts of PV, and among them, except for peaks 5 and 20, the peak areas and peak heights of the other 19 peaks have certain changes after being treated with FRAP working solutions, so the 19 compounds are considered to have certain antioxidant activities. The activities of some compounds were proved by reference substances (peaks 6 and 14) and literature (peaks 1, 2, 7, and 15).24,25 For detail, 16 components from stems and leaves displayed antioxidant activity, including gallic acid, neochlorogenic acid, chlorogenic acid, catechin, quercetin-3-O-vicianoside, rutin isomers, rutin, hyperoside, quercetin-3-O-glucuronide, isoquercitrin, kaempferol-3-O-glucuronide, baicalin, and hispidulin-7-O-glucuronide, as well as 3 unknown components. There are 12 antioxidant active components in the fruits, which are respectively gallic acid hexoside, gallic acid, neochlorogenic acid, chlorogenic acid, catechin, caffeic acid, rutin, quercetin-3-O-glucuronide and isoquercitrin, and 3 other unknown compounds with antioxidant activity; 9 antioxidant active ingredients were found in rhizomes, which are gallic acid hexoside, gallic acid, neochlorogenic acid, catechin, chlorogenic acid, quercetin-4′-O-glucuronide, rutin, quercetin-3-O-glucuronide and isoquercetin. Apparently, the newly established on-line mixed injection HPLC-FRAP system can be used as a rapid, effective and convenient tool for the discovery of antioxidant active ingredients in complex mixtures such as medical herbs, with the advantages of automation, short reaction time as well as small consumption of sample and reagent.| No | tR/min | Compounds | Peak area relative reduction (%, n = 3) | ||
|---|---|---|---|---|---|
| Stems-leaves | Fruits | Rhizomes | |||
| a “—” mean does not have this component or other component. | |||||
| 1 + 2 | 1.947 | Gallic acid hexoside + gallic acid | —a | 24.80 | 23.08 |
| 2 | 1.947 | Gallic acid | 14.22 | — | — |
| 3 | 4.086 | Neochlorogenic acid | 26.33 | 25.93 | 23.74 |
| 4 | 5.473 | Unknown 1 | — | 25.55 | — |
| 5 | 5.720 | Unknown 2 | — | 0.54 | — |
| 6 + 7 | 6.840 | Chlorogenic acid + catechin | 29.59 | 26.88 | 28.09 |
| 8 | 9.326 | Caffeic acid | — | 15.83 | — |
| 9 | 15.199 | Quercetin-3-O-vicianoside | 13.91 | — | — |
| 10 | 15.753 | Quercetin-4′-O-glucopyranoside | — | — | 17.15 |
| 11 | 16.599 | Rutin isomers | 17.05 | — | — |
| 12 | 17.006 | Rutin | 11.93 | 10.65 | 9.33 |
| 13 | 17.519 | Hyperoside | 17.38 | — | — |
| 14 + 15 | 17.959 | Quercetin-3-O-glucuronide + isoquercitrin | 22.60 | 21.44 | 20.24 |
| 16 | 18.139 | Kaempferol-3-O-glucuronide | 21.91 | — | — |
| 17 | 20.472 | Unknown 3 | 18.42 | — | — |
| 18 | 22.039 | Unknown 4 | 7.12 | — | — |
| 19 | 23.418 | Baicalin | 10.80 | — | — |
| 20 | 24.485 | Hispidulin-7-O-glucuronide | 0.86 | — | — |
| 21 | 28.065 | Unknown 5 | 11.04 | 12.41 | — |
PV has the function of relieving diarrhea and strengthening the stomach as a medicine and food homology plant. The whole herb categories of PV are available and have high economic values. Nowadays, the research on chemical composition and biological activity of PV mainly focuses on its medicinal part “rhizome”, while the research on its non-medicinal parts “fruit and stem-leaf” is rare. As the active pharmaceutical ingredient (API) of Zhuyaliao Zhixie Keli, the main feed of Hepialus larva which is host of Cordyceps sinensis, and the auxiliary feed of most herbivores, thousands of tons of the rhizomes from PV are consumed every year. In the meantime, a large amount of non-medicinal parts from PV are discarded as waste because they are not used. Besides, human over-excavation and unreasonable abandonment lead to the wild PV resources increasing scarcity and destruction of ecologic environment. Our research found that the non-medicinal parts of PV have similar chemical components and active effects with its rhizome, which suggested that they could be used as substitutes in some product development or application. The results have important guiding significance for improving the reuse of PV resources.
4. Conclusion
In this study, the antioxidant activities of different parts of PV were initially investigated through three classic antioxidant analyses to explore the potential of the whole plant as natural antioxidant. The findings revealed that the main part of which played an antioxidant role was the rhizome, which provided a scientific basis and technical reference for the rational utilization of the medicinal parts (rhizomes) and non-medicinal parts (fruits, stems and leaves) of PV in the future. Then, 21 main compounds in different parts were undoubtedly or tentatively identified. Finally, in order to rapidly screen the antioxidants, an on-line mixed injection FRAP-HPLC detection system was established. Through the relative reduction of peak area, 19 components with antioxidant activity were found in all parts of PV. This method has the advantages of rapid separation of components of complex mixture, efficient screening and identification of antioxidant active components, and cost-saving. Generally speaking, this developed approach was a rapid, effective, and convenient screening system for the antioxidant active constituents of traditional Chinese medicine.Ethical statement
This article does not contain any studies with human participants or animals performed by any of the authors.Author contributions
Zheng-ming Qian: conceptualization, methodology, funding acquisition. Xin-jie Cheng and Qi Huang: revising-original draft, data-processing. Qiao Wang and Ya-fei Ma: writing-original draft. Li-ling Jin: review and editing. Jia-sheng Xie: conceptualization. De-qiang Li: supervision, project administration, funding acquisition.Conflicts of interest
All the authors declare that they have no conflicts of interest.Acknowledgements
This work was supported by the foundation of the Second Hospital of Hebei Medical University (2HN202101), Fourteenth Five Year Plan of Clinical Medicine Innovation Team of Hebei Medical University (2022LCTD-B10), DGSTB-GDST-FDCT Projects (2022A0505020031).References
- H. Alkadi, A review on free radicals and antioxidants, Infect. Disord.: Drug Targets, 2020, 20, 16–26 CAS.
- S. Di Meo and P. Venditti, Evolution of the knowledge of free radicals and other oxidants, Oxid. Med. Cell. Longevity, 2020, 2020, 9829176 CrossRef PubMed.
- N. Chakrabarty, H.-J. Chung, R. Alam, N. U. Emon, S. Alam, M. F. Kabir, M. M. Islam, S.-T. Hong, T. Sarkar, M. M. Sarker and M. M. Rahman, Chemico-pharmacological screening of the methanol extract of Gynura nepalensis D.C. deciphered promising antioxidant and hepatoprotective potentials: Evidenced from in vitro, in vivo, and computer-aided studies, Molecules, 2022, 27, 3474 CrossRef CAS PubMed.
- C.-X. Zhang, Y.-L. Li and F.-Z. Hu, Studies on the chemical constituents from herba Polygonum viviparum L, Nat. Prod. Res. Dev., 2005, 17, 177–178 CAS.
- Z.-F. Gong, G.-L. Yang, Z.-T. Yan and J.-S. Xie, Survey of chemical constituents and bioactivity of Polygonum L. plants, Chin. Tradit. Herb. Drugs, 2002, 33, 82–84 CAS.
- C.-X. Zhang, Y.-L. Li and F.-Z. Hu, Chemical constituents of fruits of Polygonum viviparum, Acta Bot. Boreali-Occident. Sin., 2005, 25, 386–387 CAS.
- S.-Z. Zheng, K.-L. Li, J.-X. Wang, T. Shen and X.-W. Shen, Two new flavone glycosides from Polygonum viviparum L., Indian J. Chem., Sect. B: Org. Chem. Incl. Med. Chem., 2001, 40, 167–169 Search PubMed.
- Q.-Z. Xiao and Y.-H. Wang, The scavenging effect of flavonoids from Polygonum viviparum on DPPH, Guangzhou Chem., 2012, 37, 16–19 Search PubMed.
- Z.-M. Qian, L. Chen, M.-Q. Wu and D.-Q. Li, Rapid screening and characterization of natural antioxidants in Polygonum viviparum by an on-line system integrating the pressurised liquid micro-extraction, HPLC-DAD-QTOF-MS/MS analysis and antioxidant assay, J. Chromatogr. B: Anal. Technol. Biomed. Life Sci., 2020, 1137, 121926 CrossRef CAS PubMed.
- D.-q. Li, J. Zhao, D. Wu and S.-P. Li, Discovery of active components in herbs using chromatographic separation coupled with online bioassay, J. Chromatogr. B: Anal. Technol. Biomed. Life Sci., 2016, 1021, 81–90 CrossRef CAS PubMed.
- S.-Y. Shi, Y.-P. Zhang, X.-Y. Jiang, X.-Q. Chen, K.-L. Huang and H.-H. Zhou, Coupling HPLC to on-line, post-column (bio) chemical assays for high-resolution screening of bioactive compounds from complex mixtures, TrAC, Trends Anal. Chem., 2009, 28, 865–877 CrossRef CAS.
- X. Zhang, S. Zhang, B. Gao, Z. Qian, J. Liu, S. Wu and J. Si, Identification and quantitative analysis of phenolic glycosides with antioxidant activity in methanolic extract of Dendrobium catenatum flowers and selection of quality control herb-markers, Food Res. Int., 2019, 123, 732–745 CrossRef CAS PubMed.
- D. Fraisse, A. Bred, C. Felgines and F. Senejoux, Screening and characterization of antiglycoxidant anthocyanins from Vaccinium myrtillus fruit using DPPH and methylglyoxal pre-column HPLC assays, Antioxidants, 2020, 9, 512 CrossRef CAS PubMed.
- E. Sommella, G. M. Conte, E. Salviati, G. Pepe, A. Bertamino, C. Ostacolo and P. Campiglia, Fast profiling of natural pigments in different spirulina (arthrospira platensis) dietary supplements by DI-FT-ICR and evaluation of their antioxidant potential by pre-column DPPH-UHPLC assay, Molecules, 2018, 23, 1152 CrossRef PubMed.
- C. Puangbanlang, K. Sirivibulkovit, D. Nacapricha and Y. Sameenoi, A paper-based device for simultaneous determination of antioxidant activity and total phenolic content in food samples, Talanta, 2019, 198, 542–549 CrossRef CAS PubMed.
- Y.-T. Wu, Y.-F. Huo, L. Xu, Y.-Y. Xu, X.-L. Wang and T. Zhou, Purification, characterization and antioxidant activity of polysaccharides from Porphyra haitanensis, Int. J. Biol. Macromol., 2020, 165, 2116–2125 CrossRef CAS PubMed.
- D. M. Grochowski, S. Uysal, A. Aktumsek, S. Granica, G. Zengin, R. Ceylan, M. Locatelli and M. Tomczyk, In vitro enzyme inhibitory properties, antioxidant activities, and phytochemical profile of Potentilla thuringiaca, Phytochem. Lett., 2017, 20, 365–372 CrossRef CAS.
- C.-X. Zhao, W.-J. Fan, L. Niu, X.-D. Wang, W.-S. Wang and H.-W. Yang, Research on acute toxicity and genetic toxicity of polygonum viviparum fruit powder, Chin. J. Health Lab. Technol., 2016, 26, 1572–1574 Search PubMed.
- C.-X. Zhao, H.-W. Yang and L. Niu, Research on the subchronic toxicity of polygonum viviparum fruit, Chin. J. Health Lab. Technol., 2016, 26, 2461–2463 Search PubMed.
- Q. Wang, Q.-H. Shen, Q. Huang, J.-J. Xie, W.-J. Li, Z.-M. Qian and K. Nie, HPLC analysis of chemical components in different parts of Polygonum viviparum L. by online gradient extraction, Lishizhen Med. Mater. Med. Res., 2021, 32, 2084–2087 Search PubMed.
- Y. Dai, Z. Dou, R. Zhou, L. Luo, L. Bian, Y. Chen, J. Tao and Z. Chen, Quality evaluation of Artemisia capillaris Thunb. based on qualitative analysis of the HPLC fingerprint and UFLC-Q-TOF-MS/MS combined with quantitative analysis of multicomponents, J. Anal. Methods Chem., 2021, 2021, 5546446 Search PubMed.
- Z.-C. Cai, H.-Y. Liao, C.-C. Wang, J.-L. Chen, M.-X. Tan, Y.-Q. Mei, L.-F. Wei, H. Chen, R. Yang and X.-H. Liu, A comprehensive study of the aerial parts of Lonicera japonica Thunb. based on metabolite profiling coupled with PLS-DA, Phytochem. Anal., 2020, 31, 786–800 CrossRef CAS PubMed.
- Z. Yan, S. Liqiong, Y. Yingduo, Q. Jin and Y. Boyang, Application of multi-dimensional and multi-informational (MD-MI) integrated xanthine oxidase and superoxide anion fingerprint in quality evaluation of Scutellariae Radix, J. Pharm. Biomed. Anal., 2020, 191, 113595 CrossRef CAS PubMed.
- Y. K. Fang, Z. M. Shang, G. Q. Sun, M. S. Zhang, G. Wang, D. L. Xu, Y. Zhou, C. X. Sun and S. J. Xiao, Glucosyloxybenzyl 2-isobutylmalates and phenolic glycosides from the flowers of Bletilla striata, Fitoterapia, 2022, 160, 105220 CrossRef CAS PubMed.
- Z. M. Qian, L. Chen, M. Q. Wu and D. Q. Li, Rapid screening and characterization of natural antioxidants in Polygonum viviparum by an on-line system integrating the pressurised liquid micro-extraction, HPLC-DAD-QTOF- MS/MS analysis and antioxidant assay, J. Chromatogr. B: Anal. Technol. Biomed. Life Sci., 2020, 1137, 121926 CrossRef CAS PubMed.
Footnote |
| † Electronic supplementary information (ESI) available. See DOI: https://doi.org/10.1039/d2ra08247k |
| This journal is © The Royal Society of Chemistry 2023 |