 Open Access Article
Molten salt electrolytic synthesis of porous carbon from SiC and its application in supercapacitors
Kai Zheng a,
Wenbo Luoa,
Shaolei Longa,
Xiao Long
 a,
Cuilian Shia,
Pengcheng Liua,
Jierui Li*a and
Wubin Li*b
aSchool of Materials and Energy Engineering, Guizhou Key Laboratory for Preparation of Light Metal Materials, Guizhou Institute of Technology, Guiyang 550003, China. E-mail: 529021108@qq.com; 18798005157@163.com
bGuizhou Academy of Sciences, Guiyang, 550014, China. E-mail: lht785241@126.com
First published on 22nd May 2023
Abstract
Nanoscale porous carbide-derived carbon (CDC) microspheres were successfully synthesized via the electrolysis etching of nano-SiC microsphere powder precursors with a particle diameter of 200 to 500 nm in molten CaCl2. Electrolysis was conducted at 900 °C for 14 h in argon at an applied constant voltage of 3.2 V. The results show that the obtained product is SiC-CDC, which is a mixture of amorphous carbon and a small quantity of ordered graphite with a low degree of graphitization. Similar to the SiC microspheres, the obtained product retained its original shape. The specific surface area was 734.68 m2 g−1. The specific capacitance of the SiC-CDC was 169 F g−1, and it exhibited excellent cycling stability (98.01% retention of the initial capacitance after 5000 cycles) at a current density of 1000 mA g−1.
1. Introduction
Energy is an essential part of our lives that we often take for granted. However, in recent years, environmental pollution and the exhaustion of fossil fuels have directly threatened the survival and development of human society.1,2 To mitigate these issues, the development of novel and efficient energy storage devices has attracted tremendous interest, such as supercapacitors.3–8 Supercapacitors can be classified into two categories: pseudocapacitors and electric double-layer capacitors (EDLCs).9–12 EDLCs generally exhibit a high-power density, high charge efficiency, long cyclic life, wide operating temperature range, low environmental impact, and enhanced safety due to the electrostatic charge accumulation at the interface of the electrolyte and the porous electrode materials with a sufficiently large surface area and high electrical conductivity.13–18 Nowadays, supercapacitors are starting to be used to supplement lithium-ion batteries in several pivotal applications.19 Supercapacitors are also promising energy storage devices that can meet the explosive power demands of devices such as hybrid electric vehicles or fuel-cell electric vehicles.20 The performance of a supercapacitor is highly dependent on the electrode materials.21 Many materials, including carbon-based materials, transition metal oxides, and conducting polymers, have been investigated for use as electrode materials in supercapacitors.21–28 Among the various electrode materials available for supercapacitors, nanostructured porous carbon exhibits a superior electrochemical performance compared to other carbon allotropes due to its large surface area, microstructures, functional groups, pore sizes, low price, and stable physical and chemical properties.29–35Carbide-derived carbons (CDCs) are a new class of nanoporous carbon material. They are defined as carbon materials produced by the selective extraction of metal or metalloid atoms from carbide crystal lattices, such as ZrC, TiC, B4C, Ti3SiC2, and Ti3AlC2.36 Unlike commercial microporous carbon, CDCs are a type of carbon with easily tuned structures, as well as intrinsic carbon structures that can be controlled via the selective etching of crystalline metal carbides and temperature control during synthesis.37,38 Therefore, CDCs exhibit several prominent advantages over traditional activated porous carbons such as a tunable pore structure, narrow pore size distribution, and maintenance of the shape and size of precursor particles.39 Because of their various unique properties, they have found considerable potential applications in fields such as supercapacitors, catalyst supports, and adsorbents for gases. Several chemical reactions and physical processes can be used for CDC synthesis such as supercritical water, thermal decomposition, and chlorination.40 Halogenation (especially chlorination) is one of the most promising methods for the large-scale production of CDCs. Unfortunately, chlorination involves Cl2 gas, which is classified as hazardous and poisonous.41 Nowadays, because of the environmental impact of the chlorination process, it is difficult to meet the rising demand for CDCs.42 Our work aims to improve the present situation by developing a novel and effective CDC fabrication method based on the chlorination process.
In this study, we successfully develop an efficient approach to prepare nanoporous carbon microspheres using a nano-SiC powder precursor as the template at 3.2 V and 900 °C in a molten CaCl2 system. Compared with the chlorination of metal carbides, this novel method is much safer, less expensive, and more environmentally friendly. The microstructure and adsorption capability of the as-prepared SiC-CDC are systematically investigated.
2. Experimental section
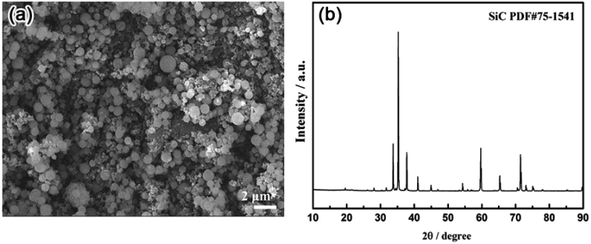
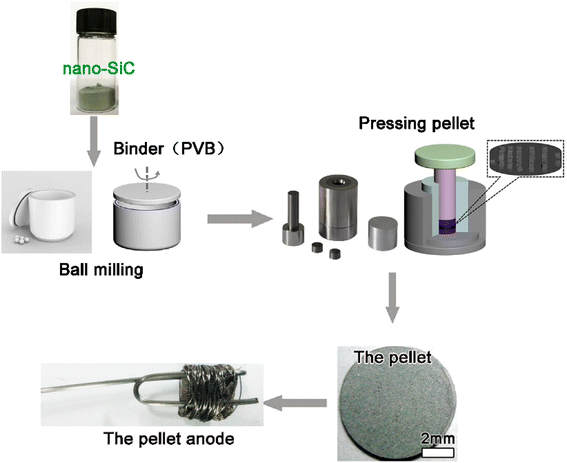
The starting precursor material for all experiments was SiC powder with a 200 to 500 nm particle size. Fig. 1 shows a scanning electron microscopy (SEM) image and X-ray diffraction (XRD) pattern of the SiC precursor (Forsman, 98%).The SiC powder was thoroughly milled in a balling machine with anhydrous alcohol and 20 wt% of a binder (polyvinyl butyral PVB) for approximately 12 h. SiC powder (approximately 0.5 g) was pressed under 30 MPa into a pellet with a diameter of approximately 10 mm and thickness of 2 mm. The pellet was wrapped with porous nickel foil and attached to a Mo wire to assemble the anode.43–45 A schematic of the anode fabrication process is shown in Fig. 2.
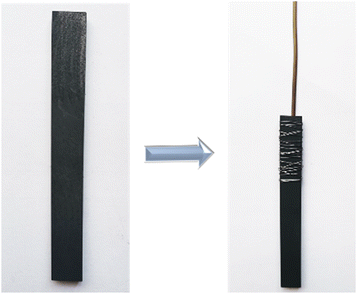
A graphite plate (120 mm length × 10 mm width × 2 mm thickness) was wrapped with Mo wire employed as the cathode for the electrochemical process, as shown in Fig. 3. Approximately 110 g of CaCl2 was dried at 500 °C under a vacuum for 24 h and used as a supporting electrolyte.
The assembled anode and cathode were placed in an alumina crucible containing molten analytical-grade anhydrous CaCl2 as the electrolyte to form an electrolytic cell. The temperature was increased to approximately 900 °C, which is above the molting point of CaCl2, at a rate of 3 °C min−1 under a dry Ar flow of 0.05 L min−1. A constant voltage of 3.2 V was applied between the anode and cathode. The experimental apparatus and schematic of the electrochemical etching process are shown in Fig. 4. After the molten salt process, the electrolytic samples were cooled to room temperature in a furnace before removal from the alumina furnace reactor in an argon atmosphere and then retrieved from the solidified salt by washing with distilled water and drying in air at 100 °C for 4 h.
 | ||
| Fig. 4 Schematic of the (a) electrolytic cell and (b) synthesis process of nanoporous carbon from the SiC precursor. | ||
The phase compositions of the samples were analyzed by XRD using a D8 Advance X-ray diffractometer (Bruker Co. Germany). The surface morphology and elemental composition of the anode products were acquired using a JEOL JSM-7500F and an energy dispersive X-ray spectrometer (EDS) attached to the SEM. Transmission electron microscopy (TEM) analysis was performed using a JEOL JEM-2100F. Raman spectroscopy was performed on a Renishaw inVia Raman microspectrometer using an Ar-ion laser (514.5 nm). Gas adsorption–desorption measurements were performed in the liquid nitrogen temperature range using a surface area and pore size analyzer (Micromeritics ASAP 2020 comptometer). The specific surface area was calculated using the Brunauer–Emmett–Teller (BET) method, and the pore size distributions were calculated using the desorption branch of the isotherms and the Barrett–Joyner–Halenda (BJH) method.
The electrochemical properties of all samples were investigated in a symmetrical two-electrode cell with a cellulose separator using a LIR2032 coin cell at room temperature. The testing electrodes were prepared using a slurry composed of 80 wt% SiC-CDC powder, 10 wt% carbon black, and 10 wt% PTFE (60 wt% suspension in water). The slurry was uniformly cast on the nickel foil and then dried in a vacuum oven at 80 °C for 24 h. An electrolyte containing 6 M KOH was used to study the capacitive behavior of the prepared electrodes. Cyclic voltammetry (CV) studies were performed in the potential range of 0 to 1.0 V at scan rates of 10 to 200 mV s−1. A Biologic HCP-803 electrochemical workstation was used to control the experiments and record the current–time curves during the electroreduction process as well as to perform galvanostatic charge–discharge and CV experiments. Galvanostatic charge–discharge tests were conducted with a cutoff voltage of 0 to 1.0 V (NEWARE, China). The specific capacitance was calculated using Cs = 4It/Vm, where I is the discharge current (A), t is the discharge time (s), V is the voltage change (V) excluding the voltage drop during the discharge process, and m is the total mass of the active material (g).
3. Results and discussion
The current–time curve is depicted in Fig. 5a, which was recorded during the electrochemical etching process at a constant voltage of 3.2 V for 14 h. As shown in Fig. 5a, after undergoing electrolysis for 14 h, the current converged to a small level (approximately 10 mA), which indicates that the electrolysis process required only approximately 14 h to completely electrolyze the pellet. Fig. 5b shows the powder XRD results in the wide-angle region of the electrolysis-obtained products in CaCl2 at 3.2 V after 14 h. The XRD patterns show reflections corresponding to the graphite (002) and (101) planes at ∼26° and ∼43°, respectively, which are attributed to SiC-CDC. Moreover, the broad and weak graphite peak at ∼26° appeared on the pattern of the produced SiC-CDC, which further indicates the amorphous nature of the as-prepared carbon materials and may greatly improve the electrical conductivity of this system.46 Further, no SiC was present in the produced SiC-CDC. In addition, further analysis suggests that the reaction mechanism of the etching process can be generally expressed as the reactions, i.e., SiC − 4e− → Si4+ + C (SiC-CDC) and Si4+ + 4e− → Si.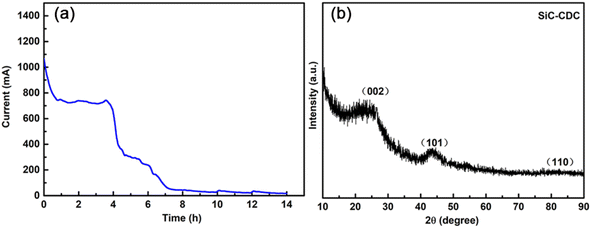 | ||
| Fig. 5 (a) Current–time curve of the electro-etching process for the SiC powder precursor. (b) XRD patterns of the obtained SiC-CDC products. | ||
Raman spectroscopy is a suitable method for determining the degree of order of the carbon materials. In general, the ration of the D-band intensity to the G-band intensity (ID/IG) may be used to determine the degree of disorder in relation to graphitization.47 Fig. 6a shows the Raman spectroscopy analysis results, and there are four Raman spectra characteristic peaks of the as-synthesized SiC-CDC samples. As shown in Fig. 6a, the G-band at 1348 cm−1 corresponds to the in-plane bond-stretching motion of carbon atoms in the sp2 configuration with E2g symmetry. The D-band at 1577 cm−1 is a breathing mode with A1g symmetry, which is not present in pristine graphite and becomes active in disordered graphite structures. The intensity of the D-mode is higher than that of the G-mode for the produced SiC-CDC.48 The indicated 2D-band at 2683 cm−1 and the (D + G)-band at 2909 cm−1 were also detected. The ID/IG value of the SiC-CDC product was 1.04. This ratio demonstrated that SiC-CDC exhibited lower graphitization than some commercially available porous activated carbons. The isotherms of the SiC-CDC samples are shown in Fig. 6b. There is a small hysteresis in the isotherm of the sample, which is generally associated with the mesopore structures. The SiC-CDC sample displays a BET specific surface area of 734.68 m2 g−1 and a total pore volume of 0.67 cm3 g−1. Moreover, from Fig. 6c, we can observe that the pore sizes calculated using the BJH method exhibit a wide pore size distribution with an average pore diameter of 2 nm, suggesting the existence of mesopores. The SiC-CDC prepared under electro-etching conditions exhibited similar nanopores.
 | ||
| Fig. 6 (a) Raman spectrum of the SiC-CDC products. (b) N2 adsorption–desorption isotherms of the obtained SiC-CDC products. (c) Pore size distribution of the obtained SiC-CDC products. | ||
Fig. 7a shows the optical microscopic images of the SiC precursor and SiC-CDC product pellet, Fig. 7b and c display SEM images of the obtained products, and Fig. 7d shows the EDS spectrum of the obtained products corresponding to Fig. 7c. Fig. 7a shows photographs of the surface of the SiC precursor pellets before and after electrolysis. The green SiC pellet gradually transformed into a black SiC-CDC pellet after electrolysis. Similar to the precursor microspheres, the obtained SiC-CDC pellet retained its original shape, as shown in the SEM image (Fig. 7b). Fig. 7c shows that the surface of the SiC-CDC pellet was rough, exhibiting evident pores, cracks, and crumpling. The transformation of SiC to C is known to be conformal at both the micrometer and nanometer scales, and the observed conservation of shape was expected. The EDS analysis results (Fig. 7d) further confirmed that the product contained only C. The EDS and XRD analyses suggest that the synthesized product was SiC-CDC.
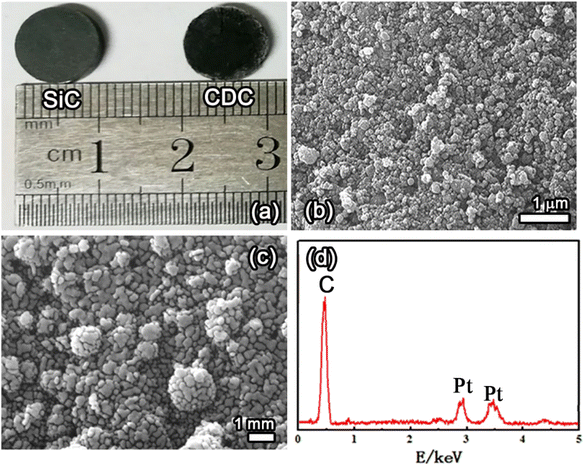 | ||
| Fig. 7 (a) Images of the SiC precursor pellet and SiC-CDC product pellet. (b and c) SEM images and (d) EDS spectrum corresponding to (c) of the obtained products. | ||
Fig. 8a and b show the typical transmission electron microscopy (TEM) image and high resolution TEM (HRTEM) image of the SiC nanosphere precursor. Fig. 8c shows a TEM image of the SiC-CDC particles that are spheroidal in shape with 100 to 500 nm diameters, which are identical to those of the SiC nanosphere precursor (Fig. 8a). Fig. 8d shows a high-resolution TEM image revealing the highly disordered microstructure of the produced SiC-CDC, which corresponds to the XRD and Raman spectroscopy patterns. These images directly indicate that the fabricated SiC-CDC sample is a mixture of amorphous carbon and an ordered graphite phase with a high degree of graphitization.
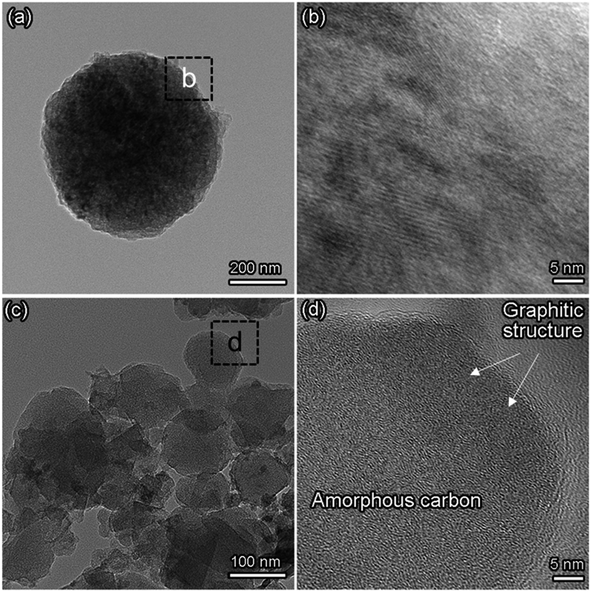 | ||
| Fig. 8 (a) Typical TEM image and (b) HR-TEM image of the SiC precursor. (c) TEM and (d) HR-TEM images of the as-synthesized SiC-CDC products. | ||
Fig. 9 shows the electrochemical properties of the SiC-CDC electrode in supercapacitor applications. Fig. 9a shows the nearly rectangular CV curve of the SiC-CDC sample at different scan rates ranging from 10 to 200 mV s−1. The CV curves of the SiC-CDC electrode exhibit a near-mirror-image current response upon voltage reversal without distinct peaks in the 0 to 1.0 V window in the 6 M KOH electrolyte. This was observed even at 200 mV s−1, indicating ideal capacitive behavior. In addition, the galvanostatic charge–discharge technique was used to study the electrochemical performance. Fig. 9b shows the total galvanostatic charge–discharge curves measured at current densities ranging from 1000 to 3000 mA g−1, in which all curves exhibit nearly triangular shapes, indicating the excellent double-layer capacitance behavior of the fabricated systems. The calculated specific capacitance of the SiC-CDC system was 169 F g−1 at a current density of 1000 mA g−1, which is significantly higher than the maximum specific capacitance of samples synthesized by the chlorination of carbides in the literature (138.3 F g−1) and the carbon NWs without mesopores (112 F g−1).47–50 Fig. 9c shows the variation in the specific capacitance of as-prepared samples as a function of current density. The specific capacitance decreases with an increase in the current density from 1000 to 3000 mA g−1. The long-cycle-life of supercapacitors is a crucial parameter affecting their practical applications.51 The long-term cyclic stability of the SiC-CDC system was also evaluated in this study by repeating the GCD test between 0 and 1.0 V (vs. Ag/AgCl) at a current density of 1000 mA g−1 for 5000 cycles. The specific capacitance as a function of the cycle number is presented in Fig. 9d, which also shows that 98.01% of the initial capacitance was retained after 5000 cycles. These results suggest that the as-prepared SiC-CDC electrode can achieve high capacitance and prolonged stability in supercapacitors. The electrode exhibited an excellent long-cycle-life over the entire number of evaluation cycles. After 5000 cycles, the capacitance decreased by only approximately 2% of the initial capacitance, demonstrating that the as-prepared SiC-CDC exhibited excellent electrochemical stability and a very high degree of reversibility during repetitive charge/discharge cycling.
4. Conclusions
Nanoporous SiC-CDC microspheres were successfully synthesized from silicon carbide microsphere powder via electrolysis in molten CaCl2 at 3.2 V, 900 °C for 14 h, and their microstructures, specific surface areas, and pore sizes were analyzed. The obtained SiC-CDC is a mixture of amorphous carbon and ordered graphite phase with a low degree of graphitization and maintained the shape of the SiC particles. SiC-CDC is a mixture of amorphous carbon and an ordered graphite phase with a low degree of graphitization. This method of producing SiC-CDC exhibits considerable potential because it is a novel technique not only for the preparation of SiC-CDC, but also for the mass production of high-quality carbon materials.Author contributions
Kai Zheng: funding acquisition, project administration, resources, supervision, writing-review & editing. Wenbo Luo: data curation, formal analysis, investigation, methodology, visualization. Shaolei Long: data curation, formal analysis, investigation, methodology, visualization. Xiao Long: data curation, formal analysis, investigation. Cuilian Shi: data curation, formal analysis, investigation. Pengcheng Liu: data curation, formal analysis, investigation. Jierui Li: conceptualization, methodology, project administration, writing-review & editing. Wubin Li: conceptualization, methodology, project administration.Conflicts of interest
There are no conflicts to declare.Acknowledgements
This work was supported by the Guizhou Province Science and Technology Planning Project (No. [2020]1Y220), the Youth Science and Technology Talent Growth Project of Education Department of Guizhou Province, P. R. China (No. [2021]264, [2022]352), the Research Project for High-level Talents of Guizhou Institute of Technology (No. XJGC20190960), the Overseas Talents Selection Fund of Guizhou Province, P. R. China (No. [2020]11).References
- J. Lilloja, E. Kibena-Põldsepp, A. Sarapuu, J. C. Douglin, M. Käärik, J. Kozlova, P. Paiste, A. Kikas, J. Aruväli, J. Leis, V. Sammelselg, D. R. Dekel and K. Tammeveski, ACS Catal., 2021, 11, 1920–1931 CrossRef CAS PubMed.
- Z. Pang, G. Li, X. Xiong, L. Ji, Q. Xu, X. Zou and X. Lu, J. Energy Chem., 2021, 10, 622–640 CrossRef.
- H. Liu, Y. Zou, L. Tao, Z. Ma, D. Liu, P. Zhou, H. Liu and S. Wang, Small, 2017, 13, 1700758 CrossRef PubMed.
- Y. Zhang, Z. Ma, D. Liu, S. Dou, J. Ma, M. Zhang, Z. Guo, R. Chen and S. Wang, J. Mater. Chem. A, 2017, 5, 512–518 RSC.
- Z. Ma, L. Tao, D. Liu, Z. Li, Y. Zhang, Z. Liu, H. Liu, R. Chen, J. Huo and S. Wang, J. Mater. Chem. A, 2017, 5, 9412–9417 RSC.
- C. Li, S. Liu, C. Shi, G. Liang, Z. Lu, R. Fu and D. Wu, Nat. Commun., 2019, 10, 1–9 CrossRef PubMed.
- Q. Zhang, F. Li, J. Huang and H. Li, Adv. Funct. Mater., 2018, 28, 1804589 CrossRef.
- J. Wu, X. Zhang, Z. Li, C. Yang, W. Zhong, W. Li, C. Zhang, N. Yang, Q. Zhang and X. Li, Adv. Funct. Mater., 2020, 30, 2004348 CrossRef CAS.
- L. Zhang and X. Zhao, Chem. Soc. Rev., 2009, 38, 2520–2531 RSC.
- S. Zhang and N. Pan, Energy Mater., 2015, 5, 2520–2531 Search PubMed.
- J. R. Miller and P. Simon, Science, 2008, 321, 651–652 CrossRef CAS PubMed.
- H. K. Kim, A. R. Kamali, K. C. Roh, K. B. Kim and D. J. Fray, Energy Environ. Sci., 2016, 9, 2249–2256 RSC.
- T. Thomberg, A. Jänes and E. Lust, Electrochim. Acta, 2010, 55, 3138–3143 CrossRef CAS.
- Y. Hou, L. Chen, A. Hirata, T. Fujita and M. Chen, Scr. Mater., 2016, 116, 76–81 CrossRef CAS.
- P. Yan, J. Xu, C. Wu, Y. Gu, X. Zhang, R. Zhang and Y. Song, Scr. Mater., 2016, 189, 16–21 CAS.
- B. Dyatkin, O. Gogotsi, B. Malinovskiy, Y. Zozulya, P. Simon and Y. Gogotsi, J. Power Sources, 2016, 306, 32–41 CrossRef CAS.
- A. Laheäär, A. Jänes and E. Lust, Electrochim. Acta, 2011, 56, 9048–9055 CrossRef.
- J. Leis, M. Arulepp, A. Kuura, M. Lätt and E. Lust, Carbon, 2006, 44, 2122–2129 CrossRef CAS.
- J. Yin, W. Zhang, N. A. Alhebshi, N. Salah and H. N. Alshareef, Small Methods, 2020, 4, 1900853 CrossRef CAS.
- L. Permann, M. Lätt, J. Leis and M. Arulepp, Electrochim. Acta, 2006, 51, 1274–1281 CrossRef CAS.
- L. Liu, Z. Niu and J. Chen, Chem. Soc. Rev., 2016, 45, 4340–4363 RSC.
- Y. Zhu, S. Murali, M. D. Stoller, K. J. Ganesh, W. Cai, P. J. Ferreira, A. Pirkle, R. M. Wallace, K. A. Cychosz, M. Thommes, D. Su, E. A. Stach and R. S. Ruoff, Science, 2011, 332, 1537–1541 CrossRef CAS PubMed.
- Y. Huang, J. Liang and Y. Chen, Small, 2012, 8, 1805–1834 CrossRef CAS PubMed.
- W. Li, J. Liu and D. Zhao, Nat. Rev. Mater., 2016, 1, 1–17 CrossRef.
- X. Lang, A. Hirata, T. Fujita and M. Chen, Nat. Nanotechnol., 2011, 6, 232–236 CrossRef CAS PubMed.
- C. D. Lokhande, D. P. Dubal and O. S. Joo, Curr. Appl. Phys., 2011, 11, 255–270 CrossRef.
- K. Wang, J. Huang and Z. Wei, J. Phys. Chem. C, 2010, 114, 8062–8067 CrossRef CAS.
- Q. Qu, Y. Zhu, X. Gao and Y. Wu, Adv. Energy Mater., 2012, 2, 950–955 CrossRef CAS.
- H. Chen, X. Lu, H. Wang, D. Sui, F. Meng and W. Qi, J. Energy Chem., 2020, 49, 348–357 CrossRef.
- M. Feng, H. Li, M. Huang, J. Kang, H. Feng, Q. Su, F. Zhang and G. Du, Mater. Res. Bull., 2018, 99, 429–435 CrossRef CAS.
- Q. Wang, J. Yan and Z. Fan, Energy Environ. Sci., 2016, 9, 729–762 RSC.
- J. Chmiola, G. Yushin, R. Dash and Y. Gogotsi, J. Power Sources, 2006, 158, 765–772 CrossRef CAS.
- M. Endo, Y. J. Kim, H. Ohta, K. Ishii, T. Inoue, T. Hayashi, Y. Nishimura, T. Maeda and M. S. Dresselhaus, Carbon, 2002, 40, 2613–2626 CrossRef CAS.
- J. Gamby, P. L. Taberna, P. Simon, J. F. Fauvarque and M. Chesneau, J. Power Sources, 2001, 101, 109–116 CrossRef CAS.
- J. Wang, M. Chen, C. Wang, J. Wang and J. Zheng, J. Power Sources, 2011, 196, 550–558 CrossRef CAS.
- M. Kormann, H. Gerhard and N. Popovska, Carbon, 2009, 47, 242–250 CrossRef CAS.
- S. H. Yeon, W. Ahn, K. H. Shin, C. S. Jin, K. N. Jung, J. D. Jeon, S. Lim and Y. Kim, Korean J. Chem. Eng., 2015, 32, 867–873 CrossRef CAS.
- I. W. Almanassra, T. Al-Ansari, I. Ihsanullah, V. Kochkodan, A. Chatla, M. A. Atieh, T. Shanableh and T. Laoui, Chemosphere, 2022, 307, 135953 CrossRef CAS PubMed.
- S. Urbonaite, S. Wachtmeister, C. Mirguet, E. Coronel, W. Zou, S. Csillag and G. Svensson, Carbon, 2007, 45, 2047–2053 CrossRef CAS.
- B. Anasori, M. R. Lukatskaya and Y. Gogotsi, Nat. Rev. Mater., 2017, 2, 1–17 Search PubMed.
- H. Zhang, C. Hu, J. Lv, S. Grasso, M. Mishra, M. Estili, Y. Yamauchi, B. Kim and Y. Sakka, Mater. Lett., 2014, 130, 188–191 CrossRef CAS.
- L. Zhang, X. Qin, G. Shao, Z. Ma, S. Liu and C. He, Mater. Lett., 2014, 122, 78–81 CrossRef CAS.
- K. Zheng, X. Zou, X. Xie, C. Lu, S. Li and X. Lu, J. Electrochem. Soc., 2018, 165, D190–D195 CrossRef CAS.
- Z. Pang, X. Zou, X. Xiong, S. Wang, L. Ji, H. Hsu, G. Wu, Q. Xu and X. Lu, ACS Sustainable Chem. Eng., 2019, 7, 12938–12947 CrossRef CAS.
- W. Qian, F. Sun, Y. Xu, L. Qiu, C. Liu, S. Wang and F. Yan, Energy Environ. Sci., 2014, 7, 379–386 RSC.
- S. Bai, G. Tan, X. Li, Q. Zhao, Y. Meng, Y. Wang, Y. Zhang and D. Xiao, Chem.–Asian J., 2016, 11, 1828–1836 CrossRef CAS PubMed.
- X. Zou, L. Ji, H. Hsu, K. Zheng, Z. Pang and X. Lu, J. Mater. Chem. A, 2018, 6, 12724–12732 RSC.
- Y. Korenblit, M. Rose, E. Kockrick, L. Borchardt, A. Kvit, S. Kaskel and G. Yushin, ACS Nano, 2010, 4, 1337–1344 CrossRef CAS PubMed.
- R. Dash, J. Chmiola, G. Yushin, Y. Gogotsi, G. Laudisio, J. Singer, J. Fischer and S. Kucheyev, Carbon, 2006, 44, 2489–2497 CrossRef CAS.
- Y. Zhao, W. Wang, D. Xiong, G. Shao, W. Xia, S. Yu and F. Gao, Int. J. Hydrogen Energy, 2012, 37, 19395–19400 CrossRef CAS.
- P. Simon and Y. Gogotsi, Nat. Mater., 2008, 7, 845–854 CrossRef CAS PubMed.
| This journal is © The Royal Society of Chemistry 2023 |

