 Open Access Article
Synthesis of copper–silver–zinc oxide nanocomposites for 4-nitrophenol reduction: doping and heterojunction†
Buzuayehu Abebe *,
Bontu Kefale and
Dereje Tsegaye Leku*
Adama Science and Technology University, Department of Applied Chemistry, Adama, 1888, Ethiopia. E-mail: buzea8@gmail.com; detsegaye@gmail.com
First published on 2nd February 2023
Abstract
The charge transfer and visible-light absorption capacities of stable materials are crucial in several applications, such as catalysis, absorption, sensors, and bioremediation. Copper–silver–zinc oxide nanocomposites (NCs) were synthesized using PVA as a capping agent and urea as a stabilizing agent. DTG analysis confirmed 500 °C was the optimum temperature for the total decomposition of PVA after capping the nanoparticles (NPs) to yield a pure composite. The XRD analysis showed the presence of copper inclusions in the ZnO lattice and the formation of Ag and CuO heterojunctions with ZnO. The photoluminescence (PL) analysis confirmed the more significant visible light absorption and charge transfer properties of the composite compared to those of single ZnO NPs. Foam-type porosity occurred during gas evolution at many of the points shown in the SEM/TEM images. Slight lattice fringe differences between the composite and ZnO NPs due to copper inclusion were confirmed from the HRTEM image and XRD pattern analysis. The crystallinity of the NPs and NCs was confirmed by the XRD pattern and SAED analysis. The diffusion-controlled charge transfer process was witnessed through CV electrochemical analysis. Thus, the energy- and time-efficient solution combustion synthesis (SCS) approach has a crucial future outlook, specifically for an industrial, scalable application. The NCs demonstrated more potential than ZnO NPs in an organic catalytic reduction reaction of 4-nitrophenol to 4-aminophenol.
1. Introduction
Human health is negatively impacted by the contamination of water caused by the emission of hazardous organic pollutants like 4-nitrophenol (4-NP).1 4-NP is employed in a variety of fields, including the manufacturing of a number of materials, as an indicator, and as a corrosion inhibitor. So far, the largest advancements have been made in the catalytic reduction of the hazardous 4-nitrophenol to the less hazardous 4-aminophenol (4-AP) on a catalyst surface, specifically employing sodium borohydride as a reducing agent.1,2 An emerging technology, nanotechnology, offers to produce heterogeneous catalyst nanomaterials, which is crucial in different applications.3,4 Nanoscale-sized zinc oxide (ZnO) is a potential semiconductor material that exhibits superior properties due to its chemical stability, environmental friendliness, and novel catalytic properties, although with some drawbacks such as low surface area, photocorrosion, and electron–hole recombination.5,6 The doping and forming a heterojunction with different bandgap materials such as silver and copper address the ZnO drawbacks.5,7 Doping is either substitutional or interstitial insertion of the dopant in the host lattice, resulting in tuning the optical, electrical, and magnetic properties. The hard and soft (Lewis) acids and bases (HSAB) theory is crucial for regulating the host-dopant reactivity balance.8,9 The heterojunction is a band alignment between two or more semiconductors with different band gaps. Heterojunction between semiconductors boosts the surface area, charge transfer, and optoelectrical properties. The charge transfer process reduces electron–hole recombination, which is critical for several applications, such as catalysis and photocatalysis.10 The coupling of noble metals such as silver allows for light–matter interaction, which improves visible light absorption and charge transfer properties due to the formation of a Schottky barrier. Forming a heterojunction between ZnO and CuO also assists the charge transfer process within the interface5,11Recently, some silver and copper doped ZnO NCs works were reported.5,7,12 Xu et al. described the formation of Ag/Cu–ZnO heterojunction synthesized from the zinc-/copper-acetate and silver nitrate precursors by the sol–gel method. The synthesized materials showed enhanced charge transfer and better visible light absorption capacity compared to ZnO NPs, which also showed direct effect on the dye degradation potential.7 Manjari et al. reported Cu–Ag NPs decorated ZnO composites by green synthesis method for electrochemical sensor and pollutant reduction/degradation applications. The synthesized composites showed enhanced catalytic and sensing capacity due to the synergistic effect of Cu–Ag NPs with ZnO.12 Xu et al. synthesized Ag/CuO/ZnO heterostructure composite by chemical- and photochemical-deposition methods. The synthesized composite showed improved methyl orange and Rhodamine B degradation capacity compared to the single ZnO. The enhanced degradation capacity of the composites is due to enhancement in the surface area, charge transfer, and visible light absorption capacity than ZnO.5 Besides, using the co-precipitation method, the Ag-decorated copper-doped ZnO microcrystal was synthesized by Wan and his groups. The copper ion was used as a dopant and morphology controller in this study. The synthesized Ag-decorated copper-doped ZnO microcrystals showed superior photocatalytic activity compared to single ZnO as a result of intensive light absorption improvement and Schottky barrier formation.13 Here in the aforementioned studies, materials properties improvement as a result of doping/heterojunction was well reported. However, the doping interpretation, specifically based on the XRD pattern peak shift was scarce. Besides, the energy-/time-efficient solution combustion synthesis (SCS) approach based on the critical LaMer's nanocrystal development model and HSAB host-dopant reactivity balance theory was not reported.
This study gives insight into the chemistry of doping and heterojunction on the silver–copper–zinc oxide NCs material synthesized by the SCS approach. The chemistry of doping and heterojunction is interpreted based on LaMer's nanocrystal development model and HSAB host-dopant reactivity balance theory. As confirmed by the XRD pattern and HRTEM analysis, the SCS approach allows the reduction of silver NPs to form a heterojunction with ZnO without inclusion in the ZnO lattice. However, copper was doped in the ZnO lattice as-well-as form a heterojunction. Thus, the copper-doped ZnO and silver–copper oxide–zinc oxide heterojunction (Cu–ZnO/CuO/Ag) is the synthesized NCs materials. The SEM/TEM image confirmed the occurrence of greater porosity for NCs than ZnO. The doping and heterojunction-induced charge transfer and visible light absorption capacity of NCs than ZnO were confirmed from PL analysis. The overall characterization improvement towards NCs compared to the ZnO NPs were proved on catalytic reduction of 4-NP to 4-AP. This investigation confirmed that NCs had a higher catalytic reduction capacity than ZnO NPs, just within 210 seconds. In this regard, the SCS is a promising approach for producing a porous and catalytically efficient material within a short time and using less energy.
2. Experimental
2.1. Reagents and chemicals
The reagents and chemicals that are employed are silver nitrate (AgNO3, 99%), copper(II) nitrate trihydrate (Cu(NO3)2·3H2O, 99%), zinc nitrate (Zn(NO3)2·6H2O, 99.5%), polyvinyl alcohol ([–CH2CHOH–]n, Mw: 85![[thin space (1/6-em)]](https://www.rsc.org/images/entities/char_2009.gif) 000–124
000–124![[thin space (1/6-em)]](https://www.rsc.org/images/entities/char_2009.gif) 000), urea (CH4N2O, 99.0%), and distilled water. The chemicals and reagents were employed immediately after purchase without further purification.
000), urea (CH4N2O, 99.0%), and distilled water. The chemicals and reagents were employed immediately after purchase without further purification.
2.2. Synthesis of NPs and NCs
The NPs and NCs were synthesized by forming a complex between metal precursors and the fuel/surfactant. The procedures were adopted by combining the previous reports14,15 with slight modifications. In detail, the ternary composites were synthesized by mixing a stoichiometric amount of silver, copper, and zinc salt precursors in 5![[thin space (1/6-em)]](https://www.rsc.org/images/entities/char_2009.gif) :
:![[thin space (1/6-em)]](https://www.rsc.org/images/entities/char_2009.gif) 5
5![[thin space (1/6-em)]](https://www.rsc.org/images/entities/char_2009.gif) :
:![[thin space (1/6-em)]](https://www.rsc.org/images/entities/char_2009.gif) 90 ratios (5% silver, 5% copper, and 90% zinc salts), respectively, in 50 mL of poly(vinyl alcohol) (PVA)-distilled water solution. The PVA-distilled water solution was prepared by dissolving 1 g of the PVA polymer in hot distilled water (80 °C) for about 20 minutes. The nitrate salt precursor is the best choice due to its novel solubility, oxidizing properties, and stability.16,17 Herein, the host-dopant reactivity balance was selected based on the hard and soft acids and bases (HSAB) theory.8,9 The mixture was dissolved at a reduced temperature (50 °C) by continuously stirring on the hot plate-magnetic stirrer for about 15 minutes.
90 ratios (5% silver, 5% copper, and 90% zinc salts), respectively, in 50 mL of poly(vinyl alcohol) (PVA)-distilled water solution. The PVA-distilled water solution was prepared by dissolving 1 g of the PVA polymer in hot distilled water (80 °C) for about 20 minutes. The nitrate salt precursor is the best choice due to its novel solubility, oxidizing properties, and stability.16,17 Herein, the host-dopant reactivity balance was selected based on the hard and soft acids and bases (HSAB) theory.8,9 The mixture was dissolved at a reduced temperature (50 °C) by continuously stirring on the hot plate-magnetic stirrer for about 15 minutes.
During the dissolution of the salt precursor, a stoichiometric amount (0.158 mol L−1) of CH4N2O was continuously added from the burette. The dissolved mixture was dehydrated by raising the hot plate temperature in the range of 90–115 °C for about 4–5 hours. The dry precursor fuel/surfactant gel temperature then further increased to the approximate complex ignition temperature range of 160–260 °C within 15–25 minutes. Finally, the combusted foam-type by-product was crushed to powder and calcined at 500 °C for three hours. 500 °C is the temperature at which PVA decomposed completely after stabilizing the NPs, which is optimized on the TGA-DTA analysis. The single silver metal, copper oxide, and zinc oxide NPs were also synthesized by following similar procedures except for adding an appropriate amount of each salt precursors.
2.3. Catalytic reduction of 4-NP
The 4-NP to 4-AP reduction procedures on the surface of NPs and NCs were adapted from a recent study.18 To give a rich yellow color, 1.10 mL of 0.01 M (1.1 × 10⁻⁴ M) 4-NP was mixed with 0.38 g/100 mL (0.1 M) of excess sodium borohydride (NaBH4). In this case, NaBH4 was used to reduce 4-NP to the 4-nitrophenolate ion. After adding 10 mg of the catalyst to the mixture, a UV-vis spectrophotometer (P9 UV/Visible double-beam spectrophotometer) was used to track the conversion of 4-NP to 4-AP.2.4. Characterization
The TGA-DTA technique (DTG, DTG-60H) was used to characterize the thermal stability of NPs and NCs in a nitrogen atmosphere at a flow rate of 20.0 mL min−1 and a ramp temperature of 50 °C min−1. The materials' crystallinity was studied by XRD pattern analysis (XRD-7000, Shimadzu), at a voltage of 40.0 kV, a current of 30.0 mA, and a scan speed of 3.0 deg min−1. The materials' optical properties were characterized by photoluminescence (PL) spectroscopic techniques (Agilent, Eclipse fluorescence spectrophotometer). The scanning electron microscope (SEM) (JCM-6000Plus) and transmission electron microscopy (TEM) (JEOL TEM 2100 HRTEM) techniques were used to understand the morphological characteristics. The compositional analysis of the materials was characterized by energy-dispersive X-ray (EDAX) analysis. Materials' electrochemical properties were analyzed by cyclic voltammetry (with a CH 660E potentiostat, an electrochemical analyzer) in a three-electrode system. The catalyst paste is formed by mixing silicon oil, graphite powder, and NPs/NCs in 3![[thin space (1/6-em)]](https://www.rsc.org/images/entities/char_2009.gif) :
:![[thin space (1/6-em)]](https://www.rsc.org/images/entities/char_2009.gif) 14
14![[thin space (1/6-em)]](https://www.rsc.org/images/entities/char_2009.gif) :
:![[thin space (1/6-em)]](https://www.rsc.org/images/entities/char_2009.gif) 3 ratios. The NPs and NCs paste, Ag/AgCl, and platinum wire were used as working, reference, and counter electrodes, respectively. The UV-vis spectrophotometer (P9 UV/Visible double-beam spectrophotometer) was used to control the 4-NP reduction to 4-AP.
3 ratios. The NPs and NCs paste, Ag/AgCl, and platinum wire were used as working, reference, and counter electrodes, respectively. The UV-vis spectrophotometer (P9 UV/Visible double-beam spectrophotometer) was used to control the 4-NP reduction to 4-AP.
3. Results and discussion
3.1. Characterizations
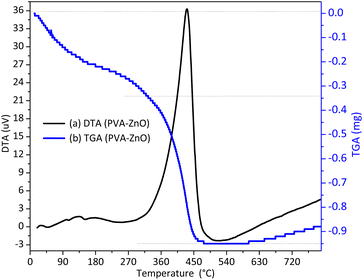
The materials stability and appropriate calcination temperature selection were done by the TGA-DTA analysis. Fig. 1 shows the DTG spectra for the PVA-ZnO composite before calcination. Mainly two decompositions processes took-place; the first decomposition occurred in the temperature range of 135–215 °C is due to the surface or/and interstitial/crystal absorbed water molecules.The second decomposition, which occurred in the temperature range of 305–505 °C is as a result of PVA polymer total degradation.15
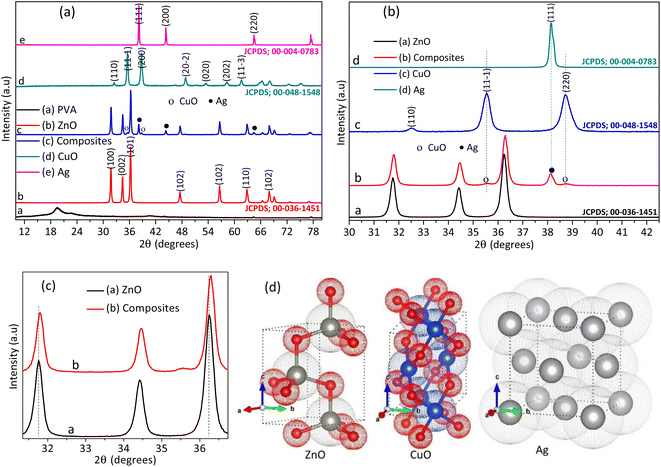
The purity and crystallinity of PVA polymer, NPs, and NCs were understood by XRD pattern analysis, as shown in Fig. 2(a). The XRD pattern analysis show 2θ peaks for raw PVA at 19.4 corresponding to the (101) plane of the crystal lattice (JCPDS, File No. 00-053-1847).19 After calcination, no PVA and additional impurity XRD peaks were detected on the NPs and NCs. The absence of additional peak indicates the total decomposition of PVA and impurities during calcination at 500 °C. The single ZnO XRD pattern showed 2θ peaks corresponding with a hexagonal phase of wurtzite ZnO (JCPDS, File No. 00-036-1451).20
The XRD pattern for single copper(II) oxide and silver metal shows a monoclinic (JCPDS, File No. 00-048-1548)21 and face-centered-cubic (JCPDS, File No. 00-004-0783) phase,22 respectively. The XRD pattern of doped composites showed additional peaks for silver metal and copper oxide. The detected additional peak reveals the availability of separate silver and copper oxide crystallites. This is probably by forming a heterojunction with ZnO (see Fig. 2(b)). However, the composites XRD pattern showed higher angle shift compared to the single ZnO (Fig. 2(c)), which reveals the presence of doping in addition to the heterojunction. In general, silver is reduced by reducing gaseous products such as hydrogen and ammonia during combustion.14,23 Thus, the shift is probably due to the interstitial inclusion of copper dopant in the ZnO lattice.24 The XRD pattern analysis confirms the formation of Cu-doped ZnO/Ag/CuO (Cu–ZnO/Ag/CuO) NCs. The general host-dopant reaction of the complex during combustion is given in eqn (1), where z is the amount of dopant and ρ is the oxygen spillover valence.25 The crystal structure of silver, copper oxide and zinc oxide, which developed from the American mineralogist crystal structure database (AMCSD), CIF data, is depicted in Fig. 2(d). The crystal structure is drawn using the visualization for electronic structural analysis (VESTA) software.
| zCu(NO3)2·3H2O + (1 − z)Zn(NO3)2·6H2O + PVA/oxidant → CuzZn(1−z)O(2−ρ) + gaseous products | (1) |
The optical properties of as-synthesized NPs and NCs were characterized by photoluminescence (PL) spectroscopic technique (Agilent, eclipse fluorescence spectrophotometer), as shown in Fig. 3(a). The first intense near-band edge transition peak detected at a wavelength of 396 nm is a result of photon-induced electron–hole recombination. The other peaks detected in the visible region are due to extrinsic and intrinsic defects.26 The composite's PL spectra show intensity reduction compared to single ZnO spectra, which indicates the reduction of the photon-induced electron–hole recombination process.27 The process of diminishing the electron–hole recombination has valuable benefits in different applications, such as photocatalysis, and the production of the hydroxyl radical, an oxidizing agent, due to the reaction of oxygen and water with electron and hole.5,7 The NPs and NCs spectra were further deconvoluted to see the effects of light absorption capacity, as shown in Fig. 3(b and c), respectively. The visible light absorption capacity of the composite increased more than ZnO (see the pink ellipse curve). The violet and blue emissions are increased for NCs as the UV emission decreases. This visible light absorption enhancement for the NCs results from the development of doping or/and heterojunction between metal/metal oxides.
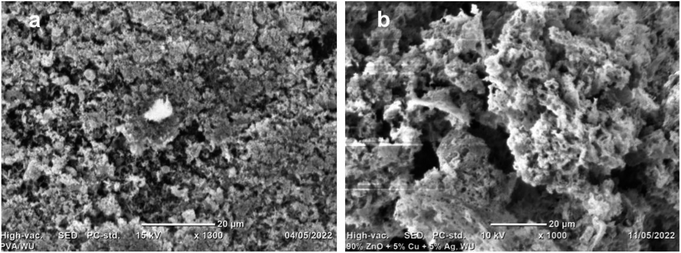
The materials' morphology, crystallinity, and porosity are understood from the SEM and TEM image analysis, as shown in Fig. 4–6. Fig. 4 shows the SEM images of ZnO NPs and composite (at 20 nm scale bar). The composite showed better porosity than single ZnO. The greater porosity of the composite may confirm the formation of better fuel/surfactant complexes within the composite salt precursors than the zinc precursor alone. The respective inset image in Fig. 4(a) and (b) are the magnified images at 5 nm scale bar. The morphology of the composites has a spongy, foam-type morphology, which indicates the gas evolution is from many points.28 The EDAX analysis was used to confirm the presence of an expected elemental composition of Zn, Ag, Cu, and O as prominent peaks at around 1, 3, 0.9, and 0.5 keV, respectively (Fig. S1†). The standard employed during analysis is likely to blame for the presence of elemental carbon. The probable source for elemental nitrogen is urea decomposition. The obtained weight percent and atomic percent compositional analysis findings are displayed in the inset table of Fig. S1.†
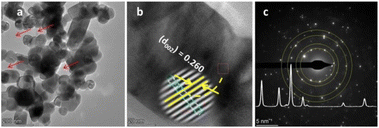
The pore generation during gaseous product evolution was further confirmed from the TEM image, as shown in Fig. 5(a) and 6(a) (red arrows). The lattice fringes of ZnO NPs and composite were calculated from the HRTEM images (Fig. 5(b) and 6(b), respectively). The slight lattice fringe value differences between ZnO NPs (0.265 nm) and composite (0.260 nm) are probably due to the inclusion of copper in the ZnO lattice, which is due to the slight crystal distortion.29,30 The bright spots on the SAED rings of NPs and NCs show their crystallinity (Fig. 5(c) and 6(c)). The diffraction rings on the ZnO NPs confirm its crystal planes, consistent with XRD interpretation. However, the SAED ring detected for the NCs is not as good as that of the NPs, probably due to crystal lattice distortion during interstitial copper inclusion.24
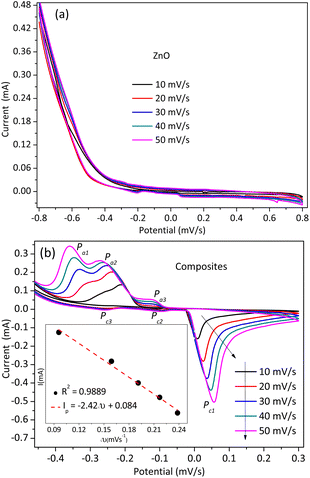
The electrochemical properties of the NPs and composites were analyzed by cyclic voltammetry (with CH 660E potentiostat, an electrochemical analyzer) in a three-electrode system, as shown in Fig. 7. Fig. 7(a) shows the cyclic voltammogram for ZnO NPs, in which no visible redox peak was detected. However, the cyclic voltammogram for the composites has reversible reduction and oxidation peaks (Fig. 7(b)). The oxidation/anodic (Pa1) and reduction/cathodic (Pc1) peaks are observed at different peak potential points. These potential peaks indicate the presence of an improvement in the electronic conductivity and catalytic properties of the NCs over the ZnO NPs.31 These reversible redox peaks of the composites result from the material porosity. The porous nature of the materials facilitates charge intercalation and de-intercalation processes.32 The shifting of the potential with increasing scan rate (from 10–50 mV s−1) and the well-fitting of the peak current versus square root of the potential linear plot (see Fig. 7(b) inset) indicates the free diffusion of species without adsorption and the diffusion-controlled charge transfer processes, respectively.31,33
3.2. 4-NP catalytic reduction
Fig. 8 depicts the NPs- and NCs-catalyzed organic catalytic reduction process of 4-NP to 4-AP in the presence of NaBH4 as a reducing agent. According to Fig. S2,† the greatest wavelength peak of the 4-NP is at about 316 nm. Then, the 4-nitrophenolate ion peak at 400 nm is created when 4-NP reacts with NaBH4, which causes the 4-NP peak to completely vanish at 316 nm. Then, when 4-NP reacts with the catalyst, the 4-nitrophenolate ion is reduced and converted to 4-AP, which causes the creation of a new peak with a maximum wavelength value of 299 nm. The isotope points (marked by arrows) show a conversion process without any undesirable byproducts.34 During the reaction, the 4-AP, 4-nitrophenolate ion, and 4-NP exhibit colorless, deep yellow, and yellow colors, respectively. On the 4-NP, the NCs demonstrated quick and effective reduction potential in just 210 seconds, compared to the ZnO NPs.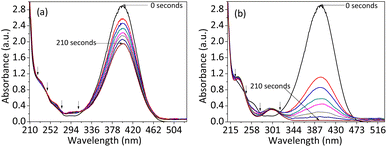 | ||
| Fig. 8 4-NP catalytic reduction plots of (a) ZnO NPs and (b) silver–copper–zinc composite: The NCs show complete reduction of the 4-nitrophenol to the 4-aminophenol within 210 seconds. | ||
Using recently available literature,1,2,35 the probable mechanism for the 4-NP catalytic reduction process to 4-aminophenol was suggested. First, a small number of bubbles appear when NaBH4 is added to water as a result of hydrogen production; this is a reduction reaction between water and NaBH4. A metal hydride complex then forms during the catalyst's addition. More bubbles develop during this catalyst addition step, most likely as a result of increased hydrogen production. At the same time, 4-NP adsorbed on the catalyst surface, and hydrogen transferred from the catalytic hydride complex to 4-NP (Fig. 9). Based on the mass spectrometry and density functional theory analyses, Kong et al. described in detail the processes of hydrogen absorption, the production of water molecules, and their elimination by a sequential hydroxyl dehydration process.35 The 4-nitrophenolate ion peak at 400 nm then gradually diminished, and the 4-AP peak at 299 nm progressively emerged. The 4-hydroxyl aminophenol transition state occurred during the 4-nitrophenolate ion-to-4-AP reduction process.2 The entire conversion of the 4-NP ion to the 4-AP ion is shown by the creation of a colorless solution. In the end, 4-AP desorption takes place, which helps with catalyst recycling.
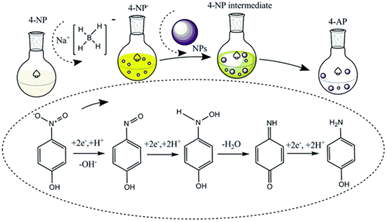 | ||
| Fig. 9 Possible understanding of the conversion of 4-nitrophenol to 4-aminophenol using NaBH4 and metal NPs as an H2 source and catalyst, respectively. Reproduced/Adapted from ref. 1 with permission from The Royal Society of Chemistry. | ||
4. Conclusions
Thus, the combustion synthesis approach produced pure porous nanoscale-sized (30–70 nm) Cu-doped ZnO/CuO/Ag NCs. The material porosity resulted from gaseous product ejection during the combustion of the complex formed between the fuel/PVA and metal precursors. The XRD pattern analysis confirmed the doping and heterojunction formation. The SEM and TEM image analysis show the generated foam-type pores of the materials. The slight d-spacing differences between the NPs and composites are due to copper inclusion in the ZnO host. The PL analysis clearly showed the presence of charge transfer and visible light absorption improvement for the composites than single ZnO. The CV analysis reveals the diffusion-controlled type charge transfer process. Compared to the ZnO NPs, the copper–silver–zinc oxide NCs showed a much better reduction of 4-nitrophenol to 4-aminophenol.Author contributions
Writing – original draft and Investigation by Buzuayehu Abebe. Laboratory work by Bontu Kefale the writing – review & editing by Dereje Tsegaye. All authors read in detail and approved the final manuscript.Conflicts of interest
There are no conflicts to declare.Acknowledgements
This study was supported by the Adama Science and Technology University (grant no. ASTU/AS-R/052/2022).Notes and references
- Y. R. Mejía and N. K. Reddy Bogireddy, RSC Adv., 2022, 12, 18661–18675 RSC.
- Z. Wang, R. Su, D. Wang, J. Shi, J.-X. Wang, Y. Pu and J.-F. Chen, Ind. Eng. Chem. Res., 2017, 56, 13610–13617 CrossRef CAS.
- B. C. Hodges, E. L. Cates and J.-H. Kim, Nat. Nanotechnol., 2018, 13, 642–650 CrossRef CAS PubMed.
- X. Hai, S. Xi, S. Mitchell, K. Harrath, H. Xu, D. F. Akl, D. Kong, J. Li, Z. Li, T. Sun, H. Yang, Y. Cui, C. Su, X. Zhao, J. Li, J. Pérez-Ramírez and J. Lu, Nat. Nanotechnol., 2022, 17, 174–181 CrossRef CAS PubMed.
- K. Xu, J. Wu, C. F. Tan, G. W. Ho, A. Wei and M. Hong, Nanoscale, 2017, 9, 11574–11583 RSC.
- S. Mustapha, J. O. Tijani, M. M. Ndamitso, S. A. Abdulkareem, D. T. Shuaib, A. K. Mohammed and A. Sumaila, Sci. Rep., 2020, 10, 13068 CrossRef CAS PubMed.
- M. Xu, Y. Chen, W. Y. Hu, Y. T. Liu, Q. P. Zhang, H. Yuan, X. Y. Wang, J. X. Zhang, K. Y. Luo, J. Li and G. Xiong, J. Phys. D: Appl. Phys., 2020, 53, 025106 CrossRef CAS.
- R. Buonsanti and D. J. Milliron, Chem. Mater., 2013, 25, 1305–1317 CrossRef CAS.
- B. Abebe and H. C. A. Murthy, RSC Adv., 2022, 12, 5816–5833 RSC.
- T. L. Yusuf, B. O. Orimolade, D. Masekela, B. Mamba and N. Mabuba, RSC Adv., 2022, 12, 26176–26191 RSC.
- J. Yu, S. Zhuang, X. Xu, W. Zhu, B. Feng and J. Hu, J. Mater. Chem. A, 2015, 3, 1199–1207 RSC.
- G. Manjari, S. Saran, S. Radhakrishanan, P. Rameshkumar, A. Pandikumar and S. P. Devipriya, J. Environ. Manage., 2020, 262, 110282 CrossRef CAS PubMed.
- X. Wan, X. Liang, C. Zhang, X. Li, W. Liang, H. Xu, S. Lan and S. Tie, Chem. Eng. J., 2015, 272, 58–68 CrossRef CAS.
- Y. Gao, F. Meng, X. Li, J. Z. Wen and Z. Li, Catal. Sci. Technol., 2016, 6, 7800–7811 RSC.
- B. Liu, Y. You, H. Zhang, H. Wu, J. Jin and H. Liu, RSC Adv., 2016, 6, 110349–110355 RSC.
- S. J. Kim, S. Yoon and H. J. Kim, Jpn. J. Appl. Phys., 2014, 53, 02BA02 CrossRef CAS.
- B. Abebe, D. Tsegaye and H. C. Ananda Murthy, RSC Adv., 2022, 12, 24374–24389 RSC.
- H. M. Ali, S. M. Ibrahim, E. F. Abo Zeid, A. F. Al-Hossainy and M. A. El-Aal, RSC Adv., 2022, 12, 16496–16509 RSC.
- J. Selvi, S. Mahalakshmi, V. Parthasarathy, C. Hu, Y. Lin, K. Tung, R. Anbarasan and A. A. Annie, Polym. Compos., 2019, 40, 3737–3748 CrossRef CAS.
- F. Paraguay-Delgado, L. A. Hermida-Montero, J. E. Morales-Mendoza, Z. Durán-Barradas, A. I. Mtz-Enriquez and N. Pariona, RSC Adv., 2022, 12, 9898–9908 RSC.
- Y.-T. Kwon, Y.-S. Kim, S. Kwon, M. Mahmood, H.-R. Lim, S.-W. Park, S.-O. Kang, J. J. Choi, R. Herbert, Y. C. Jang, Y.-H. Choa and W.-H. Yeo, Nat. Commun., 2020, 11, 3450 CrossRef CAS PubMed.
- S. Kaenphakdee, S. Yodyingyong, J. Leelawattanachai, W. Triampo, N. Sanpo, J. Jitputti and D. Triampo, Mater. Sci. Forum, 2020, 1007, 143–147 Search PubMed.
- Y. Cai, H. Fan, M. Xu and Q. Li, Colloids Surf., A, 2013, 436, 787–795 CrossRef CAS.
- A. H. Rakhsha, H. Abdizadeh, E. Pourshaban, M. R. Golobostanfard, V. R. Mastelaro and M. Montazerian, Materialia, 2019, 5, 100212 CrossRef CAS.
- R. Gupta, N. KrishnaRao Eswar, J. M. Modak and G. Madras, RSC Adv., 2016, 6, 85675–85687 RSC.
- Y. Ma, T.-W. Choi, S. H. Cheung, Y. Cheng, X. Xu, Y.-M. Xie, H.-W. Li, M. Li, H. Luo, W. Zhang, S. K. So, S. Chen and S.-W. Tsang, Nanoscale, 2019, 11, 8736–8743 RSC.
- F. A. Alharthi, A. A. Alghamdi, N. Al-Zaqri, H. S. Alanazi, A. A. Alsyahi, A. El Marghany and N. Ahmad, Sci. Rep., 2020, 10, 20229 CrossRef CAS PubMed.
- H. H. Nersisyan, J. H. Lee, J.-R. Ding, K.-S. Kim, K. V. Manukyan and A. S. Mukasyan, Prog. Energy Combust. Sci., 2017, 63, 79–118 CrossRef.
- M. A. Majeed Khan, R. Siwach, S. Kumar, M. Ahmed and J. Ahmed, J. Mater. Sci.: Mater. Electron., 2020, 31, 6360–6371 CrossRef CAS.
- J. Kazmi, P. C. Ooi, S. R. A. Raza, B. T. Goh, S. S. A. Karim, M. H. Samat, M. K. Lee, M. F. Mohd, R. Wee, M. F. M. Taib and M. A. Mohamed, J. Alloys Compd., 2021, 872, 159741 CrossRef CAS.
- C.-F. Tang, S. A. Kumar and S.-M. Chen, Anal. Biochem., 2008, 380, 174–183 CrossRef CAS PubMed.
- J. Liu, T. Xu, X. Sun, J. Bai and C. Li, J. Alloys Compd., 2019, 807, 151652 CrossRef CAS.
- R. Suresh, K. Giribabu, R. Manigandan, A. Stephen and V. Narayanan, RSC Adv., 2014, 4, 17146 RSC.
- Y. Mei, Y. Lu, F. Polzer, M. Ballauff and M. Drechsler, Chem. Mater., 2007, 19, 1062–1069 CrossRef CAS.
- X. Kong, H. Zhu, C. Chen, G. Huang and Q. Chen, Chem. Phys. Lett., 2017, 684, 148–152 CrossRef CAS.
Footnote |
| † Electronic supplementary information (ESI) available. See DOI: https://doi.org/10.1039/d2ra07845g |
| This journal is © The Royal Society of Chemistry 2023 |

