 Open Access Article
Creative Commons Attribution 3.0 Unported Licence
Bioconversion of spent coffee grounds to prebiotic mannooligosaccharides – an example of biocatalysis in biorefinery
Mihle Magengelele a,
Samkelo Malgas
 b and
Brett I. Pletschke
 *a
*a
aEnzyme Science Programme (ESP), Department of Biochemistry and Microbiology, Rhodes University, Makhanda (Grahamstown) 6140, Eastern Cape, South Africa. E-mail: b.pletschke@ru.ac.za
bDepartment of Biochemistry, Genetics and Microbiology, University of Pretoria, Hatfield 0002, Gauteng, South Africa
First published on 26th January 2023
Abstract
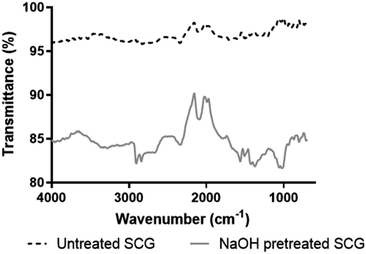
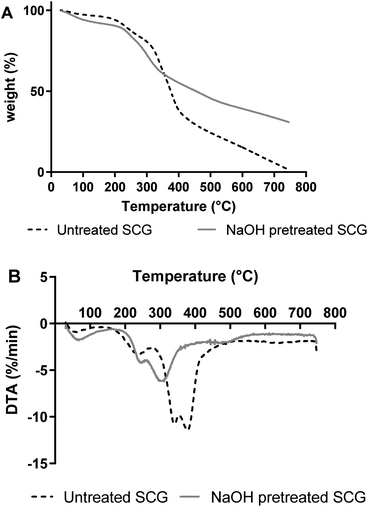
Spent coffee ground (SCG), an agro-industrial waste, have a high content of polysaccharides such as mannan, making it ideal for utilisation for the production of nutraceutical oligosaccharides. Recently, there has been growing interest in the production of mannooligosaccharides (MOS) for health promotion in humans and animals. MOS are reported to exhibit various bioactive properties, including prebiotic and antioxidant activity. In this study, SCG was Vivinal pretreated using NaOH, characterized and hydrolysed using a Bacillus sp. derived endo-β-1,4-mannanase, Man26A, for MOS production. Structural analyses using Fourier-transform infrared spectroscopy (FT-IR) and thermogravimetric analysis (TGA) were conducted to assess the efficacy of the pretreatment. Lignin removal by the pretreatment from SCG was clearly shown by TGA. FT-IR, on the other hand, showed the presence of α-linked D-galactopyranoside (812 cm−1) and β-linked D-mannopyranoside residues (817 cm−1) in both SCG samples, signifying the presence of mannan. Hydrolysis of pretreated SCG by Man26A produced mannobiose and mannotriose as the main MOS products. The effect of simulated gastric conditions on the MOS was investigated and showed this product to be suitable for oral administration. Finally, the prebiotic effect of the MOS on the growth of selected beneficial bacteria was investigated in vitro; showing that it enhanced Lactobacillus bulgaricus, Bacillus subtilis and Streptococcus thermophilus growth. These findings suggest that SCG is a viable source for the production of MOS which can be orally administered as prebiotics for effecting luxuriant growth of probiotic bacteria in the host's digestive tract, leading to a good health status.
1 Introduction
Coffee is currently the second most popular beverage globally, after water.1,2 During the preparation of coffee, coffee beans are first roasted and then ground. After this, the coffee is extracted via a thermal water extraction technique at 100 and 180 °C.3 The resulting water-soluble solids are evaporated and dried either by spray drying or freeze-drying to obtain instant coffee.3 The waste, which is the insoluble material, referred to as spent coffee ground (SCG), is then discarded.3 Approximately 6 megatons of coffee beans are produced annually across the globe, with a ton of beans usually resulting in 650 kilograms of SCG waste during coffee processing.4Among the SCG components, galactomannan is the major polysaccharide in SCG that accounts for 20–30% dry matter, which is responsible for the high viscosity of the coffee extract.5,6 Galactomannan is made up of linear chains of β-1,4-linked mannopyranoside residues substituted by galactopyranoside units at C-6 via α-1,6-linkages.5 Galactomannans are used in foods as thickening and binding agents, stabilizers in products such as ice cream, dietary fibre and as precursors for the production of nutraceutical mannooligosaccharides (MOS).1,7
It is reported that prebiotic oligosaccharides can be found naturally in foods or, alternatively, they can be produced by enzymatic or chemical synthesis from disaccharides or other substrates, as well as by hydrolysis of polysaccharides.8 Hydrolysis of polysaccharides is normally the most reliable choice for oligosaccharide production on a large scale, due to its reproducibility and high yield. Endo-β-1,4-mannanases (Enzyme Commission number 3.2.1.78) randomly hydrolyse internal β-1,4-glycosidic bonds in the β-mannan backbone, resulting in the production of MOS.1,4,9 Endo-β-1,4-mannanases are currently allotted in glycoside hydrolase (GH) families 5, 26, 45, 113 and 134 in the Carbohydrate-Active enZyme (CAZy) database (https://www.cazy.org) based on sequence similarities.
Before enzymatic hydrolysis, lignocellulosic biomass needs to be pretreated to remove lignin which hampers hydrolysis.10 The availability of lignin in SCG prevents CAZymes from accessing and degrading the carbohydrate fraction for the production of free sugars.11 This, therefore, necessitates pretreatment of agro-industrial wastes to lower their recalcitrance against enzymatic digestion. Among pretreatment procedures, alkaline pretreatment has low severity and results in more reducing sugars compared to other methods, such as acid pretreatment.11,12 Sodium hydroxide (NaOH) pretreatment is reported to result in pores on the surface of SCG, allowing enzymes access for its effective degradation.11
MOS have also been reported to have anti-oxidant activity, anti-inflammatory and anti-cancer effects.9,13 Chiyanzu et al.14 reported that MOS can be produced enzymatically using a mannanase and cellulase cocktail from steam pretreated SCG. Nguyen et al.2 also demonstrated that enzymatic hydrolysis of delignified and defatted SCG resulted in mannobiose (M2) and mannohexaose (M6) as the predominant sugars produced. Wongsiridetchai et al.11,15 demonstrated that enzymatic hydrolysis of pretreated SCG using a Bacillus subtilis GA2 (1) derived mannanase resulted in the production of M2 and mannotriose (M3) as predominant sugars. The MOS produced from both studies enhanced the growth of beneficial bacteria, such as Lactobacillus acidophilus, L. casei and L. plantarum.
This paper investigated the prebiotic properties of MOS produced enzymatically from NaOH pretreated SCG using an endo-1,4-β-mannanase from a Bacillus sp., including the ability of the MOS to tolerate in vitro gastrointestinal conditions and thermal tolerance, which has not been assessed to date. This study showed that the SCG derived MOS indeed exhibited prebiotic effects, including probiotic growth enhancement, their biofilm formation and auto-aggregation improvement, and short chain fatty acid production, which are required by the probiotic for competing with pathogens in the gastrointestinal tract.
2 Results and discussion
2.1. Pretreatment of SCG
SCG was pretreated using NaOH to make it easier for the endo-1,4-β-mannanase to hydrolyse its mannan, by creating pores and increasing the surface area of the biomass.11 There was a significant weight reduction of SCG after pretreatment, from 50 g to 30.3 g; while the untreated SCG mass only marginally decreased from 50 g to 47.14 g during incubation in hot water. This mass decrease in the pretreated SCG (39.41% (w/w)) is likely due to the removal of lipids and polyphenolics as reported in a previous study on the saponification of SCG.11 Tsai et al.16 reported that SCG contains 39.4% total lignin, while Ballesteros et al.17 reported that 23.90% lignin is contained in SCG. We suspect that the alkaline pretreatment was responsible for removal of the lignin from the SCG in the current study. On the other hand, McNutt & He18 reported that polysaccharides make up 50% of dry mass of SCG. Furthermore, the SCG polysaccharides are fractionated to 12.40% cellulose and 39.10% hemicellulose, respectively.17 The slight mass decrease in untreated SCG (5.72% (w/w)) is most likely due to loss of extractives.2.2. Structural analysis of SCG
2.3. Analysis of SCG hydrolysis products by HPLC
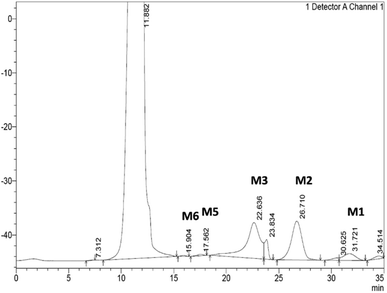
From the hydrolysis of 40 mg mL−1 of SCG by the Bacillus sp. derived Man26A over 48 hours, approximately 1.8 mg mL−1 of reducing sugars was detected using the DNS assay and 2.47 mg mL−1 of MOS could be quantified by HPLC (Table 1). The hydrolysis products of Man26A action against SCG were qualitatively and quantitatively analysed using HPLC. The hydrolysis of this agro-industrial waste using the Bacillus sp. Man26A released M2 and M3 as the predominant MOS species (Table 1). This agreed with the findings of Chauhan et al.,22 who also reported that M2 and M3 were the predominant MOS produced from coffee extract using a Bacillus nealsonii PN-11 β-mannanase. Wongsiridetchai et al.11,15 also reported that SCG hydrolysis, using a Bacillus sp. GA2 (1) mannanase, results in M2 and M3 as the predominant products. It is worth mentioning that the MOS yield from SCG hydrolysis by Man26A in this study is an underestimate, as there were two major peaks at 23.8 minutes and 30.6 min, respectively, which were unidentified (Fig. 3). We suspect these two products to be galactosyl substituted MOS, such as galactosyl-mannose and galactosyl-mannobiose. Our previous work has reported on the ability of GH26 endo-β-1,4-mannanases to generate galactosyl substituted MOS during the hydrolysis of galactomannans.9 The various sizes of oligosaccharides produced from SCG show that the Bacillus sp. derived endo-β-1,4-mannanase is suitable for MOS production from the inexpensive and abundant SCG.| Mannooligosaccharide (MOS) product | Content (mg mL−1) |
|---|---|
| Mannose | 0.18 ± 0.03 |
| Mannobiose | 1.04 ± 0.03 |
| Mannotriose | 1.20 ± 0.04 |
| Mannotetraose | Nd |
| Mannopentaose | 0.03 ± 0.00 |
| Mannohexaose | 0.02 ± 0.00 |
| Galactosyl-MOS | + |
| Total reducing sugars | 1.80 |
2.4. Gastrointestinal tolerance of MOS
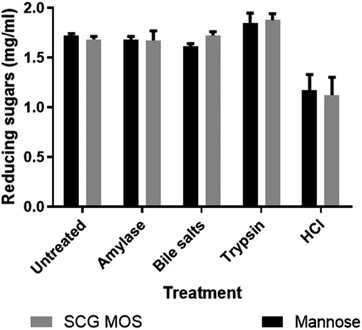
Prebiotics must also have several other important characteristics, such as tolerance to acids, bile salts and digestive enzymes that may be present in the gastrointestinal tract of the host, in order to reach the bacteria which, they ought to influence in the small intestines. The effects of these chemicals and digestive enzymes on MOS were investigated in vitro (Fig. 4).The SCG derived MOS showed resistance to decomposition by these gastrointestinal products. The results agreed with the findings by Asano et al.,23 who showed that thermally produced MOS were resistant to human salivary amylase, artificial gastric juice, porcine pancreatic enzymes and rat intestinal mucous protein. The ability of MOS to tolerate the simulated gastrointestinal conditions shows that they are likely indigestible in vivo and would reach the large intestine without losing their structural integrity and, hence, maintain their prebiotic bioactivity.
2.5. TGA analysis of MOS
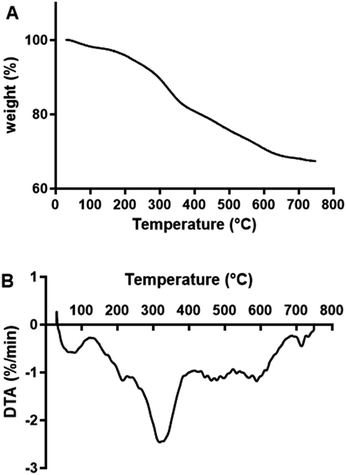
TGA and DTA analysis were performed on freeze-dried MOS to establish their thermal stability (Fig. 5). MOS exhibited a slight loss in weight at approximately 50 °C due to moisture removal, followed by a more drastic weight loss between 150 and 400 °C. Similarly, López-Sanz et al.24 observed weight loss peaks for Vivinal galacto-oligosaccharides (GOS) at 36, 90 and 135 °C.2.6. Prebiotic activity of MOS
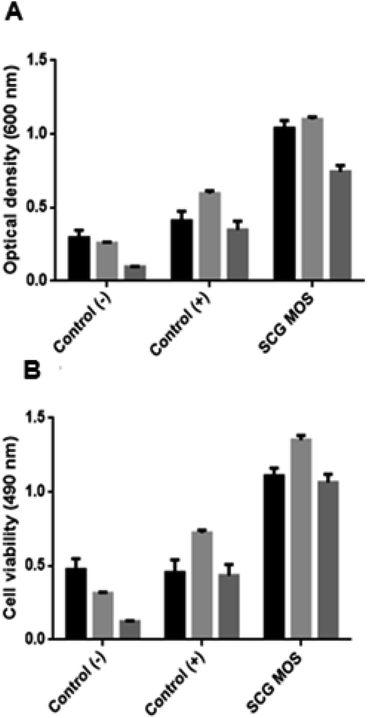
The MOS were further tested for their effect on the growth of beneficial bacteria (Fig. 6). The MOS promoted the growth of L. bulgaricus, S. thermophilus and B. subtilis. And the viability of these beneficial bacteria after incubation with MOS correlates with the optical density, which means that the cells did not die upon MOS consumption.Cao et al.25 and Srivastava et al.26 demonstrated similar findings when testing the effect of commercial MOS on L. plantarum and low DP MOS (M2 and M3) on seven Lactobacillus sp. Pan et al.27 also reported that MOS enhance the growth of Lactobacilli and Bifidobacteria, while inhibiting Enterococcus and Enterobacteriaceae. Magengelele et al.9 also reported that MOS derived from ivory nut mannan (INM), locust bean gum (LBG) and guar gum (GG) enhance the growth of B. subtilis and S. thermophilus. Numerous studies have reported that MOS inhibit the proliferation of pathogenic bacteria in the digestive tract of mammals in many ways which include the production of short-chain fatty acids (SCFAs) by beneficial bacteria, which contributes to the decrease in pH and inhibition of pathogens from attaching to the intestinal walls.28,29
2.7. Detection of SCFA production as a result of MOS fermentation
SCFAs are well-known for decreasing the pH in the digestive tract, resulting in the competitive exclusion of pathogens as well as triggering a host immune response.30 We proceeded to assess the fermentability of MOS to SCFAs by the beneficial bacteria; B. subtilis, L. bulgaricus and S. thermophilus (Table 2). S. thermophilus and B. subtilis failed to produce SCFAs in the negative control (carbon source free media). However, L. bulgaricus did produce SCFAs; this was expected as it is a lactic acid-producing bacterium.27,28 Audisio et al.31 and Baurhoo et al.29 reported that Lactobacillus sp. and Bifidobacterium could utilise glucose and produce lactic acid and acetic acid in the gut of birds. Production of these acids prevents pathogens from attaching to the host's intestinal walls.28| Carbon source | Putative SCFAs (mM) | ||
|---|---|---|---|
| B. subtilis | S. thermophiles | L. bulgaricus | |
| Glucose | 0.12 ± 0.03 | 0.06 ± 0.01 | 0.08 ± 0.01 |
| No sugar | ND | ND | 0.04 ± 0.01 |
| SCG MOS | 0.42 ± 0.03 | 0.34 ± 0.01 | 0.46 ± 0.02 |
All bacterial cells produced and secreted compounds bearing a carbonyl functional group, which we attributed to be the presence of SCFAs, to the media in the presence of the MOS. SCFAs, such as butyric acid, have been reported to inhibit the activity of pathogens like Salmonella and Clostridium perfringens in mammals. Wu et al.30 reported that supplementation of mice drinking water with acetate, butyrate and propionate reduces their susceptibility to Klebsiella pneumoniae infections. Our results are also in agreement with the findings of Pan et al.,32 who reported that MOS intake by Bifidobacteria and Lactobacilli improves the amount of SCFAs (butyrate, propionate and acetate) produced. The presence of SCFAs in the gut leads to a decrease in free fatty acids, reducing the risks of getting type-2 diabetes.33 Diabetes mellitus is one of the top ten leading causes of death globally. The ability of L. bulgaricus, B. subtilis and S. thermophilus to produce SCFAs after MOS utilisation will increase insulin sensitivity by reducing free fatty acids and ghrelin (the hunger hormone), reducing the risk of developing type-2 diabetes.33 Further studies are required to determine which type of SCFAs were produced by which bacteria and to quantify each SCFA, because these beneficial bacteria could be producing different SCFAs, which may have different functions in the gut.
2.8. Bacterial biofilm formation and auto-aggregation in the presence of MOS
The effect of MOS obtained from SCG on the formation of biofilms and auto-aggregation of beneficial bacteria was investigated. The results in Table 3 show biofilm growth normalised with total cell growth (OD540/OD600), and auto-aggregation percentage (%) for each bacterium. In terms of auto-aggregation influence, L. bulgaricus, B. subtilis and S. thermophilus grown in SCG derived MOS showed aggregation percentages of 18.21, 20.98 and 17.99%, respectively, and were better than cultures grown in the absence of a carbon source. Cao et al.25 reported that MOS enhanced the auto-aggregation of L. plantarum with a rate of auto-aggregation of 23.76%, which is slightly higher than that of L. bulgaricus, B. subtilis and S. thermophilus reported in the current study. The variations in the rate of auto-aggregation could be due to the use of different beneficial bacterial species. The DP of the commercial MOS used by Cao et al.25 may also be different from the MOS used in this study. These three probiotic bacteria were also able to form biofilms in the presence of MOS. It has been reported that the ability of beneficial bacteria to attach to surfaces, i.e., epithelial cells, provides them with an opportunity to block pathogens from also attaching to these surfaces.34 Magengelele et al.9 also showed that MOS derived from INM, LBG and GG improved biofilm formation in S. thermophilus and B. subtilis. There is no literature available on the effect of SCG-derived MOS on auto-aggregation and biofilm formation of bacteria. However, Cao et al.25 reported that commercial MOS enhanced auto-aggregation of L. plantarum ATCC14917. MOS also had a positive effect on biofilm formation of L. plantarum ATCC14917 on mucin (24.65%) and Caco-2 cells (14.71%).25 SCG-derived MOS enhanced the ability of S. thermophilus, B. subtilis and L. bulgaricus to form microcolonies and produce biofilms.| Carbon source | L. bulgaricus | B. subtilis | S. thermophilus |
|---|---|---|---|
| Biofilm formation (OD540/OD600) | |||
| No sugar | 0.79 ± 0.01 | 0.63 ± 0.03 | 0.62 ± 0.02 |
| Glucose | 0.94 ± 0.40 | 0.55 ± 0.06 | 0.66 ± 0.01 |
| SCG MOS | 2.19 ± 0.44 | 1.28 ± 0.14 | 1.19 ± 0.11 |
![[thin space (1/6-em)]](https://www.rsc.org/images/entities/char_2009.gif) |
|||
| Auto-aggregation (%) | |||
| No sugar | 1.63 ± 0.13 | 1.79 ± 0.43 | 4.19 ± 0.34 |
| Glucose | 3.06 ± 0.19 | 2.72 ± 0.23 | 4.70 ± 0.24 |
| SCG MOS | 18.21 ± 1.35 | 20.98 ± 2.21 | 17.99 ± 2.73 |
3 Experimental
3.1. Pretreatment of SCG
SCG was supplied by National Brands Limited (Island, South Africa). For the pretreatment of SCG, 12.5 g of NaOH, 1 L of distilled water and 50 g of SCG were added in a 1 L Schott bottle. The slurry was incubated at 70 °C with occasional stirring for 4 hours in a 6 Litre water bath (Labnet International. Inc, Woodbridge, USA). After incubation, the slurry was cooled down to room temperature, filtered using a cheesecloth and washed three times with 500 mL of distilled water. The SCG was then dried at 50 °C until a constant weight was obtained. Dried NaOH treated SCG was pulverised using a pestle and mortar, passed through a sieve (mesh size 0.5 mm) and kept at room temperature until use. Untreated SCG (50 g) was also washed, dried and pulverised as the pretreated SCG.3.2. Structural analysis of SCG
3.3. Enzymatic generation of MOS from SCG
Prior to hydrolysis, the pretreated SCG was pre-wetted in 50 mM phosphate buffer (pH 7.0) for 5 hours. After this, 4% (w/v) or 40 mg mL−1 SCG was hydrolysed by 0.25 mg protein per g SCG of Bacillus sp. derived mannanase, Man26A (Megazyme, Bray, Ireland). The reaction mixture also contained 1 mg mL−1 of bovine serum albumin to minimise non-productive binding of the enzyme to the non-carbohydrate fraction of SCG. The reaction mixtures were incubated at 50 °C for 48 hours, with agitation at 70 rpm. After this, the reaction was stopped by incubating the samples at 100 °C for 5 minutes. The samples were then centrifuged at 16![[thin space (1/6-em)]](https://www.rsc.org/images/entities/char_2009.gif) 060 × g for 5 minutes using a Biofuge pico Heraeus centrifuge (Hanau, Germany) and the supernatant subsequently quantified for reducing sugar release using the DNS method as described in literature.35
060 × g for 5 minutes using a Biofuge pico Heraeus centrifuge (Hanau, Germany) and the supernatant subsequently quantified for reducing sugar release using the DNS method as described in literature.35
3.4. Analysis of SCG hydrolysis products by high-performance liquid chromatography (HPLC)
The MOS were identified and quantified using a CarboSep CHO 411 column (Concise Separations, San Jose, USA) connected to a Shimadzu HPLC system with a refractive index detector (Shimadzu Corp, Kyoto, Japan) as described in our previous work.93.5. Gastrointestinal tolerance test of MOS
Bile salts (0.3% w/v), α-amylase (1 mg mL−1) and trypsin (1 mg mL−1) (Sigma-Aldrich, St. Louis, USA) were prepared in 50 mM phosphate buffer (pH 7.0). The prepared solutions of bile salts, α-amylase and trypsin were mixed with MOS derived from SCG (1.7 mg mL−1 reducing sugar basis), in a 1![[thin space (1/6-em)]](https://www.rsc.org/images/entities/char_2009.gif) :
:![[thin space (1/6-em)]](https://www.rsc.org/images/entities/char_2009.gif) 1 ratio. A 50 mM phosphate buffer (pH 7.0) was used as the negative control. For hydrochloric acid, the phosphate buffer that was used to prepare SCG MOS was removed using a Centrivap vacuum concentrator system (Labconco, Boston, New York), and 1 mL of 0.1 M HCl (pH 1.5) was used to resuspend the MOS. The solutions were all incubated at 37 °C for 4 h. After incubation, the Eppendorf tubes with α-amylase and trypsin were incubated at 100 °C for 5 minutes to inactivate the enzymes, and the HCl was removed using the Centrivap vacuum concentrator system and replaced with 1 mL of phosphate buffer. The reducing sugars were quantified using the DNS method described before. A known amount of mannose (1.7 mg mL−1 reducing sugar basis) was used in under the assayed conditions to correct for sugar losses.
1 ratio. A 50 mM phosphate buffer (pH 7.0) was used as the negative control. For hydrochloric acid, the phosphate buffer that was used to prepare SCG MOS was removed using a Centrivap vacuum concentrator system (Labconco, Boston, New York), and 1 mL of 0.1 M HCl (pH 1.5) was used to resuspend the MOS. The solutions were all incubated at 37 °C for 4 h. After incubation, the Eppendorf tubes with α-amylase and trypsin were incubated at 100 °C for 5 minutes to inactivate the enzymes, and the HCl was removed using the Centrivap vacuum concentrator system and replaced with 1 mL of phosphate buffer. The reducing sugars were quantified using the DNS method described before. A known amount of mannose (1.7 mg mL−1 reducing sugar basis) was used in under the assayed conditions to correct for sugar losses.
3.6. TGA analysis of SCG MOS
TGA was performed on the produced MOS, after lyophilization, using a PerkinElmer analyser as described in Section 3.2.2.3.7. Prebiotic activity determination of MOS
Bacterial cells (1 mL) stored in Luria broth were harvested by centrifugation at 16![[thin space (1/6-em)]](https://www.rsc.org/images/entities/char_2009.gif) 060 × g using a Biofuge pico Heraeus (Hanau, Germany) desktop centrifuge for 5 minutes and resuspended in saline (0.9% (w/v) NaCl) before measuring their optical density at 600 nm. The in vitro fermentation of probiotics was performed in 1× M9 minimal media (3.4% (w/v) K2HPO4; 1.5% (w/v) KH2PO4; 0.5% (w/v) NH4Cl; 0.25% (w/v) NaCl) with a pH of 7.4. The samples were supplemented with MOS at a final concentration of 0.2% ((w/v), reducing sugar content). The initial absorbance (600 nm) of the reaction mixture was adjusted to 0.1 for all the samples. This was followed by incubation of the samples at 37 °C for 7 hours, with shaking at 150 rpm. The positive control was supplemented with 0.4% (w/v) glucose, while the negative control was sugar-free. The optical density of the samples was measured. The viability of the cells was subsequently tested by adding 50 μL of 0.02% (w/v) of iodonitrotetrazolium chloride into a 96-well plate containing 200 μL of the cells that were grown for 7 hours with the different carbon sources (no carbon source or glucose and/or MOS). The plate was incubated for 1 hour and the absorbance measured at 490 nm.
060 × g using a Biofuge pico Heraeus (Hanau, Germany) desktop centrifuge for 5 minutes and resuspended in saline (0.9% (w/v) NaCl) before measuring their optical density at 600 nm. The in vitro fermentation of probiotics was performed in 1× M9 minimal media (3.4% (w/v) K2HPO4; 1.5% (w/v) KH2PO4; 0.5% (w/v) NH4Cl; 0.25% (w/v) NaCl) with a pH of 7.4. The samples were supplemented with MOS at a final concentration of 0.2% ((w/v), reducing sugar content). The initial absorbance (600 nm) of the reaction mixture was adjusted to 0.1 for all the samples. This was followed by incubation of the samples at 37 °C for 7 hours, with shaking at 150 rpm. The positive control was supplemented with 0.4% (w/v) glucose, while the negative control was sugar-free. The optical density of the samples was measured. The viability of the cells was subsequently tested by adding 50 μL of 0.02% (w/v) of iodonitrotetrazolium chloride into a 96-well plate containing 200 μL of the cells that were grown for 7 hours with the different carbon sources (no carbon source or glucose and/or MOS). The plate was incubated for 1 hour and the absorbance measured at 490 nm.
3.8. Influence of MOS on short chain fatty acids (SCFAs) synthesis by bacteria
After the prebiotic study, a liquid–liquid extraction was performed to extract SCFAs from the culture broths using diethyl-ether and NaOH as described previously.36 The SCFAs were quantified by absorbance reading at 210 nm with butyric acid used as a suitable standard.3.9. Influence of MOS on auto-aggregation of bacteria
The influence of MOS on the auto-aggregation nature of bacteria was studied as described previously.28 Bacterial cells were harvested by centrifugation at 16![[thin space (1/6-em)]](https://www.rsc.org/images/entities/char_2009.gif) 060 × g for 5 minutes and the pellet was resuspended in 1× M9 minimal media. The absorbance of the bacteria was adjusted to an optical density reading of 0.5 ± 0.05 in test tubes using 0.4% (w/v) glucose and 0.2% (w/w) MOS derived from SCG hydrolysis. Then, the bacterial suspensions were incubated at room temperature, the absorbance readings were measured at t = 0 and t = 1 h. Auto-aggregation percentage is expressed as follows:
060 × g for 5 minutes and the pellet was resuspended in 1× M9 minimal media. The absorbance of the bacteria was adjusted to an optical density reading of 0.5 ± 0.05 in test tubes using 0.4% (w/v) glucose and 0.2% (w/w) MOS derived from SCG hydrolysis. Then, the bacterial suspensions were incubated at room temperature, the absorbance readings were measured at t = 0 and t = 1 h. Auto-aggregation percentage is expressed as follows:| Autoaggregation = [1 − At/A0] × 100 |
3.10. Biofilm formation influence of MOS on bacteria
The ability of MOS to influence biofilm formation was monitored by using sterile 96-well flat-bottom microtiter plates. Briefly, the plates were prepared for each strain with four replicates of 1× M9 minimal media supplemented with different 0.2% (w/v) sugars (buffer alone, glucose, SCG MOS) (final bacterial OD read of 0.5). A plate for each strain was covered and incubated without shaking at 37 °C for 24 h. After the incubation period, the wells in each plate were washed three times with phosphate-buffered saline (PBS) solution to remove unbound cells. The cells attached to the wall of each well were stained for 20 min with 250 μL of 0.1% (w/v) crystal violet in water and washed again three times with the PBS solution to remove unbound crystal violet. Bound cells were quantified by adding 250 μL of acetone/ethanol (20![[thin space (1/6-em)]](https://www.rsc.org/images/entities/char_2009.gif) :
:![[thin space (1/6-em)]](https://www.rsc.org/images/entities/char_2009.gif) 80 (v/v)), followed by measuring absorbance at 540 nm. For comparison of biofilm formation among strains in each medium, the total growth was monitored first by measuring optical density in each well, and then normalizing the biofilm growth with its total cell growth values.
80 (v/v)), followed by measuring absorbance at 540 nm. For comparison of biofilm formation among strains in each medium, the total growth was monitored first by measuring optical density in each well, and then normalizing the biofilm growth with its total cell growth values.
4 Conclusions
MOS were successfully produced from NaOH pretreated SCG using a Bacillus sp. derived endo-1,4-β-mannanase, with M2 and M3 as the predominant products. TGA and simulated gastrointestinal tolerance analysis showed that the MOS exhibit good properties for application as functional foods. Finally, the MOS exhibited the ability to enhance the growth of beneficial bacteria (L. bulgaricus, B. subtilis and S. thermophilus), which, in turn, produced SCFAs. During this, the MOS improved the ability of the beneficial bacteria to adhere to surfaces, which could be useful measure in offering protection against environmental stress.Author contributions
Mihle Magengelele: methodology, formal analysis, investigation, visualization, writing – original draft. Samkelo Malgas: conceptualization, formal analysis, investigation, methodology, project administration, supervision, validation, writing – review & editing. Brett I. Pletschke: conceptualization, formal analysis, funding acquisition, methodology, project administration, resources, supervision, validation, writing – review & editing.Conflicts of interest
There are no conflicts to declare.Acknowledgements
We would like to thank the National Research Foundation of South Africa (NRF) for funding; MM (CPRR Grant UID 113312), as well as Rhodes University and University of Pretoria. Any opinion, findings and conclusions or recommendations expressed in this material are those of the author(s) and therefore the NRF does not accept any liability in regard thereto.References
- N. Hlalukana, M. Magengelele, S. Malgas and B. I. Pletschke, Foods, 2021, 10(9), 2010 CrossRef CAS PubMed.
- Q. A. Nguyen, E. J. Cho, D. S. Lee and H. J. Bae, Bioresour. Technol., 2019, 272, 209–216 CrossRef CAS PubMed.
- T. Jooste, M. P. García-Aparicio, M. Brienzo, W. H. Van Zyl and J. F. Görgens, Appl. Biochem. Biotechnol., 2013, 169, 2248–2262 CrossRef CAS PubMed.
- Q. A. Nguyen, E. J. Cho, D. S. Lee and H. J. Bae, Bioresour. Technol., 2019, 272, 209–216 CrossRef CAS PubMed.
- R. Redgwell and M. Fischer, Braz. J. Plant Physiol., 2006, 18, 165–174 CrossRef CAS.
- A. Sachslehner, G. Foidl, N. Foidl, G. Gübitz and D. Haltrich, J. Biotechnol., 2000, 80, 127–134 CrossRef CAS PubMed.
- V. D. Prajapati, G. K. Jani, N. G. Moradiya, N. P. Randeria, B. J. Nagar, N. N. Naikwadi and B. C. Variya, Int. J. Biol. Macromol., 2013, 60, 83–92 CrossRef CAS PubMed.
- F. J. Moreno, N. Corzo, A. Montilla, M. Villamiel and A. Olano, Curr. Opin. Food Sci., 2017, 13, 50–55 CrossRef.
- M. Magengelele, N. Hlalukana, S. Malgas, S. H. Rose, W. H. van Zyl and B. I. Pletschke, Enzyme Microb. Technol., 2021, 150, 109893 CrossRef CAS PubMed.
- P. Alvira, E. Tomás-Pejó, M. Ballesteros and M. J. Negro, Bioresour. Technol., 2010, 101, 4851–4861 CrossRef CAS PubMed.
- C. Wongsiridetchai, W. Chiangkham, N. Khlaihiran, T. Sawangwan, P. Wongwathanarat, T. Charoenrat and S. Chantorn, J. Agric. Nat. Resour., 2018, 52, 222–227 Search PubMed.
- C. E. Wyman, V. Balan, B. E. Dale, R. T. Elander, M. Falls, B. Hames, M. T. Holtzapple, M. R. Ladisch, Y. Y. Lee, N. Mosier, V. R. Pallapolu, J. Shi, S. R. Thomas and R. E. Warner, Bioresour. Technol., 2011, 102, 11052–11062 CrossRef CAS PubMed.
- U. K. Jana and N. Kango, Int. J. Biol. Macromol., 2020, 149, 931–940 CrossRef CAS.
- I. Chiyanzu, M. Brienzo, M. P. García-Aparicio and J. F. Görgens, Appl. Biochem. Biotechnol., 2014, 172, 3538–3557 CrossRef CAS PubMed.
- C. Wongsiridetchai, V. Jonjaroen, T. Sawangwan, T. Charoenrat and S. Chantorn, LWT-Food Sci. Technol., 2021, 148, 111717 CrossRef CAS.
- W.-T. Tsai, S.-C. Lui and C.-H. Hsieh, J. Anal. Appl. Pyrolysis, 2012, 93, 63–67 CrossRef CAS.
- L. F. Ballesteros, M. A. Cerqueira, J. A. Teixeira and S. I. Mussatto, Carbohydr. Polym., 2015, 127, 347–354 CrossRef CAS PubMed.
- J. McNutt and Q. He, J. Ind. Eng. Chem., 2019, 71, 78–88 CrossRef CAS.
- A. E. Atabani, S. M. Mercimek, S. Arvindnarayan, S. Shobana, G. Kumar, M. Cadir and A. H. Al-Muhatseb, J. Air Waste Manage. Assoc., 2018, 68, 196–214 CrossRef CAS PubMed.
- S. Pandey, J. Y. Do, J. Kim and M. Kang, Int. J. Biol. Macromol., 2020, 143, 60–75 CrossRef CAS PubMed.
- M. Carrier, A. Loppinet-Seran, D. Denux, J.-M. Lasnier, F. Ham-Pichavant, F. Cansell and C. Aymonier, Biomass Bioenergy, 2011, 35, 298–307 CrossRef CAS.
- P. S. Chauhan, P. Sharma, N. Puri and N. Gupta, Bioprocess Biosyst. Eng., 2014, 37, 1459–1467 CrossRef CAS PubMed.
- I. Asano, M. Umemura, S. Fujii, H. Hoshino and H. Iino, Food Sci. Technol. Res., 2004, 10(1), 93–97 CrossRef CAS.
- S. López-Sanz, R. Moreno, M. J. de La Mata, F. J. Moreno and M. Villamiel, J. Food Qual., 2018, 1–9 CrossRef.
- P. Cao, L. Wu, D. Pan, X. Zeng, Y. Guo and L. Lian, J. Dairy Sci., 2019, 102, 2863–2872 CrossRef CAS PubMed.
- P. K. Srivastava, D. Panwar, K. V. H. Prashanth and M. Kapoor, J. Agric. Food Chem., 2017, 65, 2827–2838 CrossRef CAS PubMed.
- X. Pan, T. Wu, L. Cai and Z. Song, Lett. Appl. Microbiol., 2009, 48, 362–367 CrossRef CAS PubMed.
- M. F. A. Chacher, Z. Kamran, U. Ahsan, S. Ahmad, K. C. Koutoulis, H. G. Qutab Ud DIn and O. Cengiz, Worlds Poult. Sci. J., 2017, 73(4), 831–844 CrossRef.
- B. Baurhoo, A. Letellier, X. Zhao and C. Ruiz-Feria, Poult. Sci., 2007, 86, 2509–2516 CrossRef CAS PubMed.
- T. Wu, F. Xu, C. Su, H. Li, N. Lv, Y. Liu, Y. Gao, Y. Lan and J. Li, Front Immunol, 2020, 11(1331), 1–13 Search PubMed.
- M. C. Audisio, G. Oliver and M. C. Apella, J Food Prot., 2000, 63(10), 1333–1337 CrossRef PubMed.
- X. D. Pan, F. Q. Chen, T. X. Wu, H. G. Tang and Z. Y. Zhao, J. Zhejiang Univ. Sci. B, 2009, 10, 258–263 CrossRef CAS PubMed.
- W. van den Ende, D. Peshev and L. de Gara, Trends Food Sci. Technol., 2011, 22, 689–697 CrossRef CAS.
- A. Balakrishna, Braz. Arch. Biol. Technol., 2013, 56, 793–800 CrossRef.
- G. L. Miller, Anal. Chem., 1959, 31, 426–428 CrossRef CAS.
- S. de Baere, V. Eeckhaut, M. Steppe, C. de Maesschalck, P. de Backer, F. van Immerseel and S. Croubels, J. Pharm. Biomed. Anal., 2013, 80, 107–115 CrossRef CAS PubMed.
| This journal is © The Royal Society of Chemistry 2023 |

