 Open Access Article
Experimental and theoretical studies on the extraction behavior of Cf(III) by NTAamide(C8) ligand and the separation of Cf(III)/Cm(III)†
Yi-lin Wanga,
Feng-feng Lia,
Zhe Xiaoa,
Cong-zhi Wangb,
Yang Liub,
Wei-qun Shi b and
Hui He
 *a
*a
aDepartment of Radiochemistry, China Institute of Atomic Energy, Beijing 102413, P. R. China. E-mail: hehui401@126.com
bLaboratory of Nuclear Energy Chemistry, Institute of High Energy Physics, Chinese Academy of Sciences, Beijing 100049, P. R. China
First published on 26th January 2023
Abstract
In this work we studied the extraction behaviors of Cf(III) by NTAamide (N,N,N′,N′,N′′,N′′-hexaocactyl-nitrilotriacetamide, C8) in nitric acid medium. Influencing factors such as contact time, concentration of NTAamide(C8), HNO3 and NO3− as well as temperature were considered. The slope analysis showed that Cf(III) should be coordinated in the form of neutral molecules, and the extraction complex should be Cf(NO3)3·2L (L = NTAamide(C8)), which can achieve better extraction effect under the low acidity condition. When the concentration of HNO3 was 0.1 mol L−1, the separation factor (SFCf/Cm) was 3.34. The extractant has application prospect to differentiate the trivalent Cf(III) and Cm(III) when the concentration of nitric acid is low. On the other hand, density functional theory (DFT) calculations were conducted to explore the coordination mechanism of NTAamide(C8) ligands with Cf/Cm cations. The NTAamide(C8) complexes of Cf(III)/Cm(III) have similar geometric structures, and An(III) is more likely to form a complex with 1![[thin space (1/6-em)]](https://www.rsc.org/images/entities/char_2009.gif) :
:![[thin space (1/6-em)]](https://www.rsc.org/images/entities/char_2009.gif) 2 stoichiometry (metal ion/ligands). In addition, bonding property and thermodynamics analyses showed that NTAamide(C8) ligands had stronger coordination ability with Cf(III) over Cm(III). Our work provides meaningful information with regard to the in-group separation of An(III) in practical systems.
2 stoichiometry (metal ion/ligands). In addition, bonding property and thermodynamics analyses showed that NTAamide(C8) ligands had stronger coordination ability with Cf(III) over Cm(III). Our work provides meaningful information with regard to the in-group separation of An(III) in practical systems.
1. Introduction
Californium, with atomic number 98, is located in the second half of the actinide series of the periodic table and is a man-made transuranic element. It has broad application prospects in industrial process control, material detection, cancer treatment, neutron radiography and other fields, and its main application is the manufacture of small neutron sources.1–5 Currently, californium is mainly produced in special nuclear reactors (i.e. the HFIR at Oak Ridge National Laboratory), and its purification process involves the separation of californium from other actinides and impurities.6–9 252Cf is the main product of Cf production by this method, and its alpha decay half-life is 2.645 years, so the chemical purity of 252Cf will also be affected by its decay product 248Cm.10,11 Therefore, it is of great practical significance to conduct basic chemical experiments on californium for further research and to obtain data with practical value.Nevertheless, due to their similar chemical properties and ionic radii, californium is difficult to be separated from other trivalent transplutonium elements, as well as the lanthanides.4,5,7,12 A number of procedures and extractants have been developed to achieve the purification of californium. For example, α-hydroxyammonium isobutyrate (α-HIBA) was first used 30 years ago and is still used by Oak Ridge National Laboratory to separate californium from other actinides.7,13–15 At the end of the last century, acetylacetone, TOPO, HDEHP, DHDECMP and other reagents have been studied and their ability to extract transplutonium have been evaluated, respectively.16–20 Most extraction processes can be considered to be able to separate californium from americium/curium or the lighter actinides, but in fact they still have limitations in practical applications. Taking into account previous separation studies, continuous efforts to design and synthesize novel extractants to achieve even higher separation coefficient and better selectivity are still necessary with respect to the californium separation chemistry.
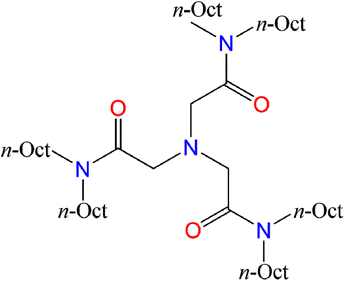
N,N,N′,N′,N′′,N′′-Hexaoctyl-nitrilotriacetamide ligands (HRNTA) have attracted more and more attention in recent years for the separation of Am/Cm/Ln due to their excellent extraction performance.21–26 NTAamide(C8) with alkyl chain of –C8H17 belongs to this compound family, and is a triamide compound with an N-triangular structure. Its chemical structure is shown in Fig. 1. The ligand excels in extraction reaction parameters such as kinetics, selectivity, acid resistance, loading capacity, stripping and reusability. In contrast to other N-donor ligands, there is no N-heterocycle in NTAamide(C8) molecular structure, suggesting better hydrolysis and irradiation stability.27–29 Nevertheless, some fundamental chemical information such as the coordination behavior of NTAamide(C8) with actinides, especially trivalent transplutonium, is still insufficient. To better clarify the coordination and separation mechanisms of Cf(III)/Cm(III) with NTAamide ligand, we explored the extraction performance of this ligand for Cf3+ under different extraction conditions, and then used the slope method to analyze the experiment data.
Although experimental studies have provided useful information for probing the mechanism of actinide and lanthanide extraction with NTAamide(C8), unfortunately, there is still no report on the crystal structure of the extracted Cf(III) complexes so far.30 Compared with extensive experimental work, quantum chemistry is considered to be an efficient method to explore actinide systems at the molecular level, which can provide detailed information on the structure of actinide complexes. In order to understand the extraction mechanism of this ligand and An(III), we systematically studied the bonding and thermodynamic properties of Cf3+/Cm3+ complexes with NTAamide(C8) in nitric acid solution by quantum chemical calculations.31–37
2. Experimental
2.1. Chemical reagents and instruments
NTAamide(C8) reagent was purchased from Sichuan University. Before the experiment, it was washed 3 times with 0.1 mol L−1 HNO3, 0.1 mol L−1 NaOH solution and saturated brine in turn for purification.24–26 After the solution was neutral, it was diluted with kerosene. Kerosene is provided by Jinxi Kerosene Chemical Plant. Dodecane, HNO3, NaNO3 are provided by Sinopharm Chemical Reagent Co., Ltd. All chemicals are of analytical grade (AR). The nitric acid solution of californium was provided by the China Institute of Atomic Energy (CIAE). The radioactivity of the original californium-252 nitric acid solution is about 100 kBq g−1, and its acidity is about 1.0 mol L−1. We use glass containers to hold the solution and store them in a lead tank. When using, we dilute it to less than 2000 cpm/100 μL according to the experimental requirements. All of the radioactive experiments (with californium) were carried out in a radiological facility that followed established safety protocols.JA5003N electronic balance (Sartorius Scientific Instruments Co., Ltd); LPD2500 multi-tube vortex mixer (Leopard Scientific Instruments (Beijing) Co., Ltd) and TDL80-2B desktop electric centrifuge (Shenzhen Anke Hi-Tech Co., Ltd) for mixing and separation of organic phases and aqueous phase in batch extraction experiments. Acidity was determined using a G20s automatic potentiometric titrator (Mettler Toledo International). Tricarb 2910tr liquid scintillator (PerkinElmer) was used to analyze californium concentration. The temperature condition experiment used MSC-100 constant temperature mixer (Beijing Jiayuan Xingye Technology Co., Ltd).
2.2. Liquid extraction
In the liquid–liquid extraction experiment, the extraction of Cf(III) by NTAamide(C8)/kerosene was carried out in a 15 mL centrifuge tube at room temperature (25 ± 0.5 °C). The organic phase was pre-equilibrated three times with corresponding concentrations of nitric acid. The aqueous phase is Cf(III) in about 0.1 mol L−1 HNO3. After stirring the mixture, the two phases were centrifuged. Appropriate Cf(III) aliquots were removed from the two phases and analyzed for equilibrium concentrations of Cf(III) by liquid scintillation counting using Ultima Gold scintillation cocktail.2.3. Analysis
Samples of the aqueous and organic phases were analyzed by a Tricarb 2910tr liquid scintillator. The distribution ratio is defined as the ratio of the total analytical concentration of metal ions in the organic phase to the analytical concentration of the aqueous phase after equilibrium, and the extraction rate is defined as the ratio of the total analytical concentration of metal ions in the organic phase after equilibrium to the total analytical concentration of the original aqueous phase.
 | (1) |
 | (2) |
co and ca are the radioactivity of Cf(III) in the organic and aqueous phases after equilibrium, respectively. Vo and Va represent the volumes of the organic and aqueous phases, respectively, and the volumes of the organic and aqueous phases are equal in this experiment. D is the distribution ratio of Cf(III) extracted with NTAamide(C8). E is the extraction rate of Cf(III) extracted by NTAamide(C8).
Here we use liquid scintillation counting to represent the concentration of 252Cf in the two phases. The principle of liquid scintillation measurement is to directly count the radioactive samples dispersed in the scintillation fluid. Most of the energy of the α or β particles emitted by the sample is first absorbed by the solvent, causing the ionization and excitation of the solvent molecules. Then count the number of photons emitted in an instant when the partially excited solvent molecules are de-excited. Due to its measurement principle, it is impossible to distinguish 252Cf and 248Cm produced by its decay from the counting results, but we checked the difference in nuclear properties between 252Cf and its only decay daughter 248Cm. Since the difference in specific radioactivity between the two is 105, it is believed that a small amount of 248Cm in the liquid phase will not affect the 252Cf to be measured in the experiment.5,7,38–40
2.4. Stripping research
In order to recover Cf(III) in the centrifuge tube after the reaction, we comprehensively used NTAamide(C8), TODGA and other reagents to carry out the Cf(III) stripping experiment. In previous studies, it was shown that N,N,N′,N′-tetraoctyl diglycolamide (TODGA) had a strong ability to extract actinide ions at high acidity, but decreased at low acidity.41–46 Taking advantage of the difference in properties between this reagent and NTAamide(C8), we obtained a Cf(III) aqueous solution with low acidity and high radioactivity through stripping experiments.The following are the main steps of the stripping experiment. The extraction and stripping of each step are fully shaken. First, the aqueous phase and organic phase after multiple extraction experiments were uniformly collected into a separatory funnel, and then the liquids were separated. 0.1 mol L−1 NTAamide(C8)/kerosene was added to the aqueous phase, and the extracted organic phase was mixed with the organic phase collected in the previous step. 3 mol L−1 HNO3 was added to the organic phase, so that Cf(III) was mainly concentrated in the aqueous phase, and then the aqueous and organic phases was separated. 0.1 mol L−1 TODGA/kerosene was added to the aqueous phase, and Cf(III) was extracted into the organic phase, followed by liquid separation. Next, about 15 mL of 0.1 mol L−1 HNO3 was added to the organic phase, and the Cf(III) was stripped into the aqueous phase.
2.5. Computation details
To simplify the calculations, we considered the simplified reagent with a shorter alkyl chain NTAamide(C4).47 In the Gaussian 16 program,48 all complexes of AnL(NO3)3 and AnL2(NO3)3 (L = NTAamide(C4); An = Cm, Cf) were calculated using density functional theory (DFT) with the hybrid functional. This method can effectively reduce the computational cost. Based on previous studies, we believe that the selectivity of this ligand for actinide mainly depends on the coordination bond between the metal ion and the ligand, rather than the hydrophobicity of the alkyl chain. This is because the alkyl chain length of the extraction ligand affects its ability to extract metal ions but has little effect on the selectivity for actinide ions, as indicated by some studies.26,32,49,50 The PBE0 functional can better reflect the interaction of the transplutonium complexes.40,51,52 Therefore optimization and frequency calculations were performed at the theoretical level of PBE0/6-31G(d)/RECP.53 The Cf and Cm atoms were treated with the quasi-relativistic effective core potential ECP60MWB and the corresponding valence basis sets ECP60MWB-SEG,54–56 and the light atoms C, H, O, N were treated with the 6-31G(d) basis set.56 According to previous studies, the sextet and octet states were chosen as the ground states of Cf(III) and Cm(III), respectively.57 Based on the optimized structures, the chemical bonding properties of the complexes were analyzed at the same theoretical. Using Multiwfn3.8 software, the chemical bond properties of actinide complexes, electrostatic potential (ESP) and partial density of states (PDOS) analyses of the complexes were analyzed by quantum theory of atoms in molecules (QTAIM).58–603. Results and discussion
3.1. Solvent extraction studies
The equilibrium of NTAamide(C8) extracting Cf(III) from HNO3 solution in the extraction system, L represents the ligand NTAamide(C8) molecule:
 | (3) |
The extraction equilibrium constant can be expressed as:
 | (4) |
The distribution ratio of Cf(III) can be expressed as:
 | (5) |
(Cf(NO3)3−ss·nL)o is the concentration of Cf(III) complexes in the organic phase after extraction, CCf3+ is the total analytical concentration of metal ions Cf(III) in the aqueous phase, and βi is the stability constant of Cf(III) nitrate complexes.24,25
In order to determine the extraction equilibrium time, experiments were carried out using 0.1 mol L−1 NTAamide(C8)/kerosene in the environment of 0.1 mol L−1 HNO3, and the effect of contact time on the distribution ratio was evaluated. The contact time was gradually increased from 2 minutes to 20 minutes at room temperature (25 ± 0.5 °C). The experimental results are shown in Fig. 2. The extraction process rapidly approached equilibrium in about 2 minutes. When the phase contact time exceeds 10 minutes, the extraction rate has reached 98%, and there is no significant change in the data after that, which means that the extraction equilibrium has been reached. In order to ensure extraction equilibrium, the contact time in subsequent extraction experiments was selected as 15 min.
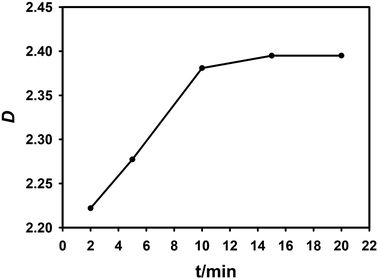 | ||
| Fig. 2 Effect of two-phase contact time on distribution ratio. Organic phase: 0.1 mol L−1 NTAamide(C8), diluent is kerosene; aqueous phase: Cf(III) solution with acidity of about 0.1 mol L−1. | ||
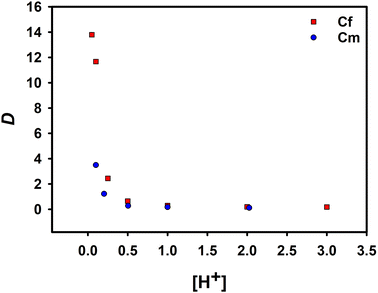
The effect of the concentration of HNO3 in the aqueous phase on the distribution ratio of extracted Cf(III) was studied by changing the concentration of HNO3. The experimental results were compared with the data of the extraction of Cm(III) by NTAamide(C8) in the past research. Both diluents were n-dodecane, and the experimental conditions are the same.
Under the same acidity, the extraction ability of NTAamide(C8) for Cf(III) is much greater than that for Cm(III) found in the past research. As shown in Fig. 3, the red data points represent the distribution ratio data of Cf(III) recorded in the experiment, and the blue data points represent the extraction distribution ratio of the ligand to Cm(III) under the same conditions. When the acidity was 0.1 mol L−1, the SF(Cf/Cm) was 3.34. The results clearly show that the extractant has a high ability to extract Cf(III). With the increase of HNO3 concentration, the distribution ratio of Cf(III) decreased from 16.22 to 0.17. The decrease in the distribution ratio can be attributed to the protonation of the N-donor at the center of the backbone, which was not conducive to the extraction reaction.
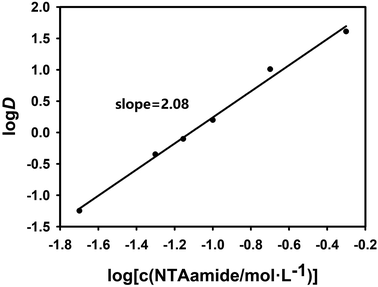
In order to explore the coefficient of the extraction reaction and make the results more convincing, two sets of experiments were carried out with NTAamide(C8) concentration as the variable. In the two sets of experiments set up, the acidity of the aqueous phase was maintained at 0.25 mol L−1 and 1.0 mol L−1, respectively, and the organic phase used different concentrations of NTAamide(C8) ligand, all using kerosene as the diluent. The distribution ratio of Cf(III) was measured under the same temperature. The effect of NTAamide(C8) concentration on the distribution ratio of Cf(III) is shown in Fig. 4 and 5. The concentration of NTAamide(C8) was between 0.02 and 0.5 mol L−1, and the distribution ratio gradually increased with the increase of the concentration. This means that Cf(III) can be more easily extracted into NTAamide(C8)/kerosene with high concentration.
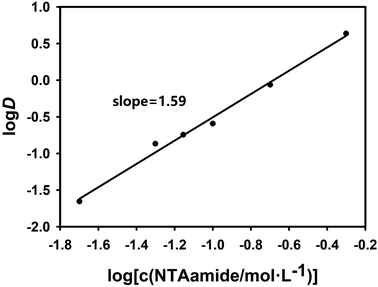 | ||
| Fig. 5 Effect of extractant concentration on distribution ratio. Organic phase: NTAamide(C8), diluent is kerosene; aqueous phase: tracer concentration of Cf(III) solution with acidity of 1.0 mol L−1. | ||
NTAamide(C8) is a neutral N/O extractant, and the acyl oxygen atoms in the molecule can easily form neutral complexes with metal ions, which are extracted into the organic phase. The extraction reaction of Cf(III) by NTAamide(C8) can be written in the form of formula (3). Combined with eqn (4) and (5), the relationship between the distribution ratio D and the extraction reaction equilibrium constant Kex can be expressed as:
 | (6) |
In the formula, L represents the ligand molecule NTAamide(C8). Taking the logarithm of both sides of the equal sign of the equilibrium reaction eqn (6), we can obtain equation (7):
 | (7) |
Since the extraction temperature, HNO3 concentration and other factors are fixed, the equilibrium constant Kex of the extraction reaction is a constant value. When the amount of NTAamide(C8) consumed by the reaction between NTAamide(C8) and the tracer dose of Cf(III) is neglected and the activity coefficient and nitrate concentration are constant values, the distribution ratio D is only a function of extractant concentration. If the distribution ratio of the extraction reaction at constant acidity is plotted as a function of extractant concentration, the number of extractant molecules in the complex can be determined from its slope value.25,26
As shown in Fig. 4 and 5, when plotting log(L) with log![[thin space (1/6-em)]](https://www.rsc.org/images/entities/char_2009.gif) D as a variable under two different acidities, the experimental data points are all in a straight line, which is consistent with the theory and proves that the extraction experiment has operational accuracy. When the acidity is 0.25 mol L−1, the slope value is 2.08, and the linear correlation coefficient r2 value is 0.994; when the acidity is 1.0 mol L−1, the slope value is 1.59, and the linear correlation coefficient r2 value is 0.992, indicating that each ligand–metal molecule contains 2 NTAamide(C8), the structure of the complex formed by the extraction reaction is Cf[NO3]3·2L, and the low acidity is conducive to the formation of a complex with a ligand–metal molar ratio of 2
D as a variable under two different acidities, the experimental data points are all in a straight line, which is consistent with the theory and proves that the extraction experiment has operational accuracy. When the acidity is 0.25 mol L−1, the slope value is 2.08, and the linear correlation coefficient r2 value is 0.994; when the acidity is 1.0 mol L−1, the slope value is 1.59, and the linear correlation coefficient r2 value is 0.992, indicating that each ligand–metal molecule contains 2 NTAamide(C8), the structure of the complex formed by the extraction reaction is Cf[NO3]3·2L, and the low acidity is conducive to the formation of a complex with a ligand–metal molar ratio of 2![[thin space (1/6-em)]](https://www.rsc.org/images/entities/char_2009.gif) :
:![[thin space (1/6-em)]](https://www.rsc.org/images/entities/char_2009.gif) 1. This has the same trend as the experimental data of NTAamide(C8) extraction of Am(III) and Cm(III) in the past research.22
1. This has the same trend as the experimental data of NTAamide(C8) extraction of Am(III) and Cm(III) in the past research.22
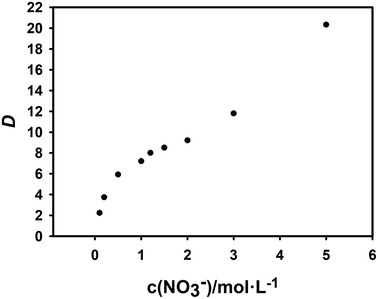
The salting-out agent is an inorganic salt that is soluble in the aqueous phase which is not extracted. But the experiments can be performed with its concentration as a variable to determine whether nitrate ions are involved in the extraction reaction. In this research, NaNO3 is used as the salting-out agent, and the total nitrate concentration are considered as the variable by changing their concentration.61 The effect of concentration change on the extraction efficiency of Cf(III) is shown in Fig. 6.
From Fig. 6, the distribution ratio gradually increased with the nitrate concentration, but the slope value first decreased and then increased. Therefore, we speculate that the decrease of the slope value is caused by the enhanced complexation of NO3− to Cf(III) in the aqueous phase with increasing concentration, NO3− acts as a masking agent, and the subsequent increase of the slope value is due to the salting out caused by the increase of NO3−.
In order to explore the mechanism of NTAamide(C8) extraction of Cf(III) and determine its coordination numbers, the extraction reaction temperature, NTAamide(C8) concentration and HNO3 concentration were fixed in the experiment, and only the nitrate concentration was changed. Taking the logarithm of the equilibrium reaction eqn (6) yields eqn (8):
 | (8) |
When log![[thin space (1/6-em)]](https://www.rsc.org/images/entities/char_2009.gif) D is plotted against log(NO3−) using slope analysis, the slope value s is 0.496. Its linear correlation coefficient r2 value is 0.984, which is obviously low.
D is plotted against log(NO3−) using slope analysis, the slope value s is 0.496. Its linear correlation coefficient r2 value is 0.984, which is obviously low.
Theoretically, the complex formed by the reaction of Cf(III) and NTAamide(C8) must be in the state of combining three nitrate ions, so that it can be extracted into the organic phase in a neutral form. The combination should result in a straight line with a slope value close to 3. However, the expected result was not obtained in the experiment. According to the previous experimental results, each ligand–metal molecule contains 2 NTAamide(C8), the structure of the complex formed by the extraction reaction is Cf[NO3]3·2L. In this case, it is difficult for NO3− to coordinate with Cf(III) due to steric hindrance. Based on the above reasons, we believe that NO3− did not directly participate in the extraction of Cf(III) by NTAamide(C8), but only played a role in balancing the charge in the outer layer.
In order to further explore the structures of the complexes formed by NO3−, Cf(III), and NTAamide(C8), the extraction complexes were studied with the simplified ligand (NTAamide(C4)) by quantum chemical calculations. The results of the optimization and frequency calculations are detailed in the DFT calculations section below.
The combined effect analysis of extractant concentration and nitrate concentration showed that about two NTAamide(C8) molecules participated in the coordination of Cf(III) during the extraction process, and each Cf(III) ion is extracted together into the organic phase combined with three NO3−. The three coordinating groups C![[double bond, length as m-dash]](https://www.rsc.org/images/entities/char_e001.gif) O in the NTAamide(C8) molecule coordinate with Cf(III), and the following reactions exist during the extraction process:
O in the NTAamide(C8) molecule coordinate with Cf(III), and the following reactions exist during the extraction process:
| Cf3+ + 3NO−3 + 2L(o) ⇌ Cf(NO3)3·2L(o) | (9) |
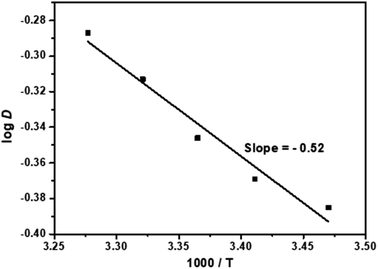
In order to study the effect of temperature on the extraction of Cf(III) by NTAamide(C8), the experiment was carried out in the temperature range of 298.15 K to 353.15 K, the concentration of NTAamide(C8) was kept at 0.1 mol L−1, and the concentration of nitric acid in the aqueous phase was kept at 0.5 mol L−1, n-dodecane is the diluent. The extraction data are shown in Fig. 7, and it can be seen that the distribution ratio increases with increasing temperature.
The enthalpy change ΔH of extraction can be calculated using the Van't Hoff equation:
 | (10) |
The relationship between temperature and extraction equilibrium constant can be known from eqn (10), and the thermodynamic relationship of extraction distribution ratio can be obtained by deriving eqn (11).
 | (11) |
From Fig. 7, the slope value δ = −0.52 of the straight line can be obtained. According to the equation ΔH = −2.303 × R × δ, the enthalpy of the extraction reaction can be obtained as ΔH = 9.96 kJ mol−1. The enthalpy change value is negative, indicating that the extraction of Cf(III) by NTAamide(C8) is an endothermic reaction. Properly increasing the temperature is beneficial to the extraction reaction.
We recovered and stripped Cf(III) after the extraction experiment, the experimental method was described in the previous section. After the stripping experiment, the acidity of the aqueous phase was kept at about 0.1 mol L−1, and the Cf(III) activity analysis was shown in ESI.†
3.2. DFT calculations
We investigated the ESP of NTAamide(C8) ligands at the B3LYP/6-31G(d) level of theory. Fig. S1† clearly shows that the most negative regions (red areas) mainly reside on the O atoms of ligands, which indicates that these atoms are the preferred binding sites for Cf3+ or Cm3+ ions. We chose to study the electrostatic potential of NTAamide(C8), which can obtain the real situation of the surface electrostatic potential of the organic ligand, and then guide the experimental work.Earlier studies have shown that trivalent actinide and lanthanide cations can form 1![[thin space (1/6-em)]](https://www.rsc.org/images/entities/char_2009.gif) :
:![[thin space (1/6-em)]](https://www.rsc.org/images/entities/char_2009.gif) 1 and 1
1 and 1![[thin space (1/6-em)]](https://www.rsc.org/images/entities/char_2009.gif) :
:![[thin space (1/6-em)]](https://www.rsc.org/images/entities/char_2009.gif) 2 complexes with the tetradentate extractant NTAamide(C8), and the specific complexes may depend on experimental conditions, such as pH, metal/ligand molar ratio, etc.31,33 We constructed neutral 1
2 complexes with the tetradentate extractant NTAamide(C8), and the specific complexes may depend on experimental conditions, such as pH, metal/ligand molar ratio, etc.31,33 We constructed neutral 1![[thin space (1/6-em)]](https://www.rsc.org/images/entities/char_2009.gif) :
:![[thin space (1/6-em)]](https://www.rsc.org/images/entities/char_2009.gif) 1 and 1
1 and 1![[thin space (1/6-em)]](https://www.rsc.org/images/entities/char_2009.gif) :
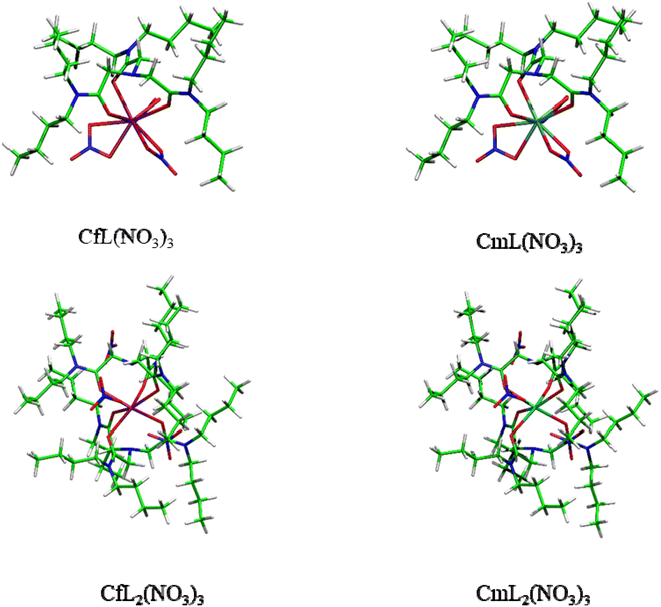
:![[thin space (1/6-em)]](https://www.rsc.org/images/entities/char_2009.gif) 2 complexes AnL(NO3)3 and AnL2(NO3)3 of Cf3+ and Cm3+ with NTAamide(C4). The gas-phase molecular geometries of these complexes were optimized at the PBE0/6-31G(d,p)/RECP theoretical level, and it was found that the ligands were coordinated to the central metal ion through amine nitrogen and carbonyl oxygen atoms. Fig. 8 shows the optimized molecular geometries of AnL(NO3)3 and AnL2(NO3)3 complexes. The An–N and An–O bond distances in these two complexes are shown in Table 1. After taking into account the difference in ionic radius of metal ions, the Cm–N and Cm–O bonds are slightly longer than the corresponding Cf–N and Cf–O bonds, respectively, indicating that the ligand may have stronger complexing ability to the Cf(III) ion.60,62–64
2 complexes AnL(NO3)3 and AnL2(NO3)3 of Cf3+ and Cm3+ with NTAamide(C4). The gas-phase molecular geometries of these complexes were optimized at the PBE0/6-31G(d,p)/RECP theoretical level, and it was found that the ligands were coordinated to the central metal ion through amine nitrogen and carbonyl oxygen atoms. Fig. 8 shows the optimized molecular geometries of AnL(NO3)3 and AnL2(NO3)3 complexes. The An–N and An–O bond distances in these two complexes are shown in Table 1. After taking into account the difference in ionic radius of metal ions, the Cm–N and Cm–O bonds are slightly longer than the corresponding Cf–N and Cf–O bonds, respectively, indicating that the ligand may have stronger complexing ability to the Cf(III) ion.60,62–64
| Species | M–O | M–N |
|---|---|---|
| CfL(NO3)3 | 2.524 | 2.929 |
| CmL(NO3)3 | 2.549 | 2.995 |
| CfL2(NO3)3 | 2.452 | — |
| CmL2(NO3)3 | 2.492 | — |
From the results of extraction experiments, we can know that each ligand–metal molecule contains 2 NTAamide(C8) at low acidity. Therefore, in DFT calculations, we constructed neutral 1![[thin space (1/6-em)]](https://www.rsc.org/images/entities/char_2009.gif) :
:![[thin space (1/6-em)]](https://www.rsc.org/images/entities/char_2009.gif) 1 and 1
1 and 1![[thin space (1/6-em)]](https://www.rsc.org/images/entities/char_2009.gif) :
:![[thin space (1/6-em)]](https://www.rsc.org/images/entities/char_2009.gif) 2 complexes AnL(NO3)3 and AnL2(NO3)3 of Cf3+ and Cm3+, and considered that the 1
2 complexes AnL(NO3)3 and AnL2(NO3)3 of Cf3+ and Cm3+, and considered that the 1![[thin space (1/6-em)]](https://www.rsc.org/images/entities/char_2009.gif) :
:![[thin space (1/6-em)]](https://www.rsc.org/images/entities/char_2009.gif) 2 complex model was dominant. In addition, according to the experiments in which the concentration of NO3− was used as a variable, we believed that the nitrate ion did not directly coordinate with the metal ion, so we constructed the structure of the complexes as shown in Fig. 8. In the process of constructing these models, we refer to a large number of experiments and calculations, and investigate the coordination model of NTAamide with metal ions, so we believe that the constructed models are reliable.23,26,32,49,50 In the 1
2 complex model was dominant. In addition, according to the experiments in which the concentration of NO3− was used as a variable, we believed that the nitrate ion did not directly coordinate with the metal ion, so we constructed the structure of the complexes as shown in Fig. 8. In the process of constructing these models, we refer to a large number of experiments and calculations, and investigate the coordination model of NTAamide with metal ions, so we believe that the constructed models are reliable.23,26,32,49,50 In the 1![[thin space (1/6-em)]](https://www.rsc.org/images/entities/char_2009.gif) :
:![[thin space (1/6-em)]](https://www.rsc.org/images/entities/char_2009.gif) 1 complex model, the N atom of NO3− directly participates in the coordination of metal ions; while in the 1
1 complex model, the N atom of NO3− directly participates in the coordination of metal ions; while in the 1![[thin space (1/6-em)]](https://www.rsc.org/images/entities/char_2009.gif) :
:![[thin space (1/6-em)]](https://www.rsc.org/images/entities/char_2009.gif) 2 complex model, the NO3− is distributed in the gap formed by the side chain of the ligand.
2 complex model, the NO3− is distributed in the gap formed by the side chain of the ligand.
To explore the bonding properties of metal–ligand (An–L) bonds, all the complexes were performed at the PBE0/6-31G(d)/RECP theoretical level. Mulliken population analysis can reflect the charge transfers ΔQ between metal ions and ligands.65–67 The charge transfers between metal and ligand–nitrate ions is also listed in Table S2.† Obviously, the Mulliken charge transfers on the Cf3+ is larger than that of the Cm3+ in the same type of complexes, which proves that Cf3+ has stronger coordination ability with ligand molecules than Cm3+.
We used Multiwfn software to perform topological analysis of the electron density of metal–ligand bonds by the QTAIM method, which is widely used to evaluate the ionic/covalent properties of actinide complexes.68,69 The electron density (ρ) and Laplacian of electron density (∇2ρ) at the BCPs (bond critical points) can provide valuable bonding information with strengths and properties. Generally, ρ > 0.20 a.u. and ∇2ρ < 0 a.u. at the BCPs are known as a typical covalent bond, while ρ < 0.10 a.u. and ∇2ρ > 0 a.u. at the BCPs denote an ionic bond. In Table 2, we list the ρ and ∇2ρ of the BCPs of Cf/Cm and the coordinated O/N atoms of the ligand in the 1![[thin space (1/6-em)]](https://www.rsc.org/images/entities/char_2009.gif) :
:![[thin space (1/6-em)]](https://www.rsc.org/images/entities/char_2009.gif) 1 complexes. Correspondingly, we list the average values of ρ and ∇2ρ of the BCPs of Cf/Cm and six coordinated O atoms of the ligand in the 1
1 complexes. Correspondingly, we list the average values of ρ and ∇2ρ of the BCPs of Cf/Cm and six coordinated O atoms of the ligand in the 1![[thin space (1/6-em)]](https://www.rsc.org/images/entities/char_2009.gif) :
:![[thin space (1/6-em)]](https://www.rsc.org/images/entities/char_2009.gif) 2 complexes in Table 3. The small ρ and positive values indicate that the An–N and An–O bonds are weak covalent interactions. At the An–O bond and An–N BCPs, the ρ values and ∇2ρ of the Cf complexes are slightly larger than those of the Cm complexes, indicating that the Cf–O bonds are stronger than the Cm–O bonds, which is consistent with the above analysis.
2 complexes in Table 3. The small ρ and positive values indicate that the An–N and An–O bonds are weak covalent interactions. At the An–O bond and An–N BCPs, the ρ values and ∇2ρ of the Cf complexes are slightly larger than those of the Cm complexes, indicating that the Cf–O bonds are stronger than the Cm–O bonds, which is consistent with the above analysis.
| CfL(NO3)3/CmL(NO3)3 | ||||
|---|---|---|---|---|
| An–O1 | An–O2 | An–O3 | An–N | |
| ρ | 0.0348/0.0346 | 0.0403/0.0398 | 0.0434/0.0419 | 0.0212/0.0196 |
| ∇2ρ | 0.1364/0.1378 | 0.1722/0.1693 | 0.1857/0.1796 | 0.0668/0.0614 |
| CfL2(NO3)3 | CmL2(NO3)3 | |
|---|---|---|
| An–O (average) | ||
| ρ(r) | 0.0459 | 0.0444 |
| ∇2ρ | 0.1967 | 0.1876 |
Partial density of states (PDOS) reflects the curve of a specific segment that contributes to the total density of states (TDOS). If the segment is properly defined, the orbital composition can be better grasped through the PDOS diagram.33,69 The PDOS plots of the CfL2(NO3)3 and CmL2(NO3)3 complexes were calculated using the Multiwfn3.8 program. Fig. 9 provides the PDOS between the 5f, 6d orbitals of Cf(III)/Cm(III) in the complexes and the 2p orbital of the coordinated N/O atoms in the ligands. The overlap of the O 2p orbitals with the An 5f orbitals is larger than that with the N 2p orbitals, which indicates that the An–O(L) bonding in these complexes is relatively stronger than the An–N bonding. Compared with the 6d orbitals of An, the 5f orbitals of An show higher metal–ligand bonding participation.70,71
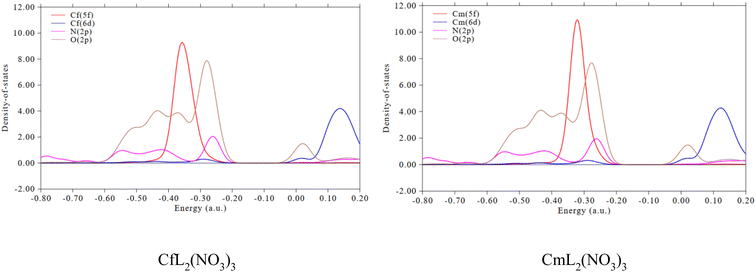 | ||
Fig. 9 Partial density of states between the An f/d orbitals and the 2p orbital of N/O atom of the ligand for the 2![[thin space (1/6-em)]](https://www.rsc.org/images/entities/char_2009.gif) : :![[thin space (1/6-em)]](https://www.rsc.org/images/entities/char_2009.gif) 1 type complexes. 1 type complexes. | ||
In the thermodynamic analysis, in order to obtain more accurate energies, single-point energy calculations are performed at the higher theoretical level (PBE0/6-311G(d,p)/RECP) based on the optimized molecular geometrical structures in the gas phase. At the same time, in order to consider solvation effect, the conductor-like screening model (COSMO) was used to simulate the organic phase (n-dodecane) and the aqueous environment by single-point energy calculations. The COSMO model uses scaled conductor boundary conditions to calculate the polarization charges of molecules in a continuum and is a reliable model for considering solvation effects in systems containing An(III) ions.72,73
For neutral extractant NTAamide(C4), the extraction of trivalent actinide cations from aqueous phase containing nitrate ions into the organic phase (n-dodecane) can be expressed as the equations in Table 4, and the changes in Gibbs free energy (ΔGext) for the extraction reactions were calculated at the PBE0/6-311G(d,p)/RECP level of theory.
| Extraction reactions | ΔGext (kcal mol−1) |
|---|---|
| [Cf(H2O)9]3+(aq) + L(org) + 3NO3−(aq) → CfL(NO3)3(org) + 9H2O(aq) | −49.99 |
| [Cm(H2O)9]3+(aq) + L(org) + 3NO3−(aq) → CmL(NO3)3(org) + 9H2O(aq) | −45.40 |
| [Cf(H2O)9]3+(aq) + 2L(org) + 3NO3−(aq) → CfL2(NO3)3(org) + 9H2O(aq) | −51.92 |
| [Cm(H2O)9]3+(aq) + 2L(org) + 3NO3−(aq) → CmL2(NO3)3(org) + 9H2O(aq) | −38.22 |
As shown in Table 4, the more negative values of ΔGext for Cf(III) complexes indicate that NTAamide has a stronger complexing ability toward Cf(III) than toward Cm(III).74 For reactions of NTAamide(C4) and Cf(III), the ΔGext value of the reaction forming 1![[thin space (1/6-em)]](https://www.rsc.org/images/entities/char_2009.gif) :
:![[thin space (1/6-em)]](https://www.rsc.org/images/entities/char_2009.gif) 2 type complex is relatively more negative than that of the 1
2 type complex is relatively more negative than that of the 1![[thin space (1/6-em)]](https://www.rsc.org/images/entities/char_2009.gif) :
:![[thin space (1/6-em)]](https://www.rsc.org/images/entities/char_2009.gif) 1 type complex. Although the difference is not obvious, this trend indicates that NTAamide(C4) is more prone to form 1
1 type complex. Although the difference is not obvious, this trend indicates that NTAamide(C4) is more prone to form 1![[thin space (1/6-em)]](https://www.rsc.org/images/entities/char_2009.gif) :
:![[thin space (1/6-em)]](https://www.rsc.org/images/entities/char_2009.gif) 2 with Cf(III) type complex with Cf(III). The small difference also imply that under certain conditions, the neutral 1
2 with Cf(III) type complex with Cf(III). The small difference also imply that under certain conditions, the neutral 1![[thin space (1/6-em)]](https://www.rsc.org/images/entities/char_2009.gif) :
:![[thin space (1/6-em)]](https://www.rsc.org/images/entities/char_2009.gif) 1 and 1
1 and 1![[thin space (1/6-em)]](https://www.rsc.org/images/entities/char_2009.gif) :
:![[thin space (1/6-em)]](https://www.rsc.org/images/entities/char_2009.gif) 2 type Cf(III) complexes may coexist in acidic media. The previous experimental results show that at low acidity ([H+] = 0.25 mol L−1), the 1
2 type Cf(III) complexes may coexist in acidic media. The previous experimental results show that at low acidity ([H+] = 0.25 mol L−1), the 1![[thin space (1/6-em)]](https://www.rsc.org/images/entities/char_2009.gif) :
:![[thin space (1/6-em)]](https://www.rsc.org/images/entities/char_2009.gif) 2 type coordination reaction is absolutely dominant; at high acidity ([H+] = 1.0 mol L−1), the ligand also undergoes a 1
2 type coordination reaction is absolutely dominant; at high acidity ([H+] = 1.0 mol L−1), the ligand also undergoes a 1![[thin space (1/6-em)]](https://www.rsc.org/images/entities/char_2009.gif) :
:![[thin space (1/6-em)]](https://www.rsc.org/images/entities/char_2009.gif) 1 type coordination reaction with Cf(III) in a certain ratio.22 Thus, the calculation results are consistent with the experimental results, that is, NTAamide tends to undergo a 1
1 type coordination reaction with Cf(III) in a certain ratio.22 Thus, the calculation results are consistent with the experimental results, that is, NTAamide tends to undergo a 1![[thin space (1/6-em)]](https://www.rsc.org/images/entities/char_2009.gif) :
:![[thin space (1/6-em)]](https://www.rsc.org/images/entities/char_2009.gif) 2 type coordination reaction with Cf(III), but the actual situation also depends on the specific experimental conditions such as acidity. Because the actual extraction process is quite complex, it is generally affected by many factors, such as counterions, solvents, ionic strength, pH, and phase modifiers. Although the calculated ΔGext values seem to be inconsistent with the experimental results, it is reliable in qualitatively predicting the reasonable complexation trend of the multiply charged f-block metal ions.74,75
2 type coordination reaction with Cf(III), but the actual situation also depends on the specific experimental conditions such as acidity. Because the actual extraction process is quite complex, it is generally affected by many factors, such as counterions, solvents, ionic strength, pH, and phase modifiers. Although the calculated ΔGext values seem to be inconsistent with the experimental results, it is reliable in qualitatively predicting the reasonable complexation trend of the multiply charged f-block metal ions.74,75
Since Cf3+ and Cm3+ show similar ionic radii and coordination properties, they may have the same influencing factors in the solvent extraction process, the difference between the extraction reaction equations can be written as:
| [Cf(H2O)9]3+(aq) + [CmLn(NO3)m](3−m)+(org) → [Cm(H2O)9]3+(aq) + [CfLn(NO3)m](3−m)+(org), ΔΔGext(Cf/Cm) |
The selectivity of Cf(III) relative to Cm(III) for NTAamide(C4) ligand was calculated according to the above reactions (Table 4), and the ΔΔGext(Cf/Cm) for the 1![[thin space (1/6-em)]](https://www.rsc.org/images/entities/char_2009.gif) :
:![[thin space (1/6-em)]](https://www.rsc.org/images/entities/char_2009.gif) 1 and 1
1 and 1![[thin space (1/6-em)]](https://www.rsc.org/images/entities/char_2009.gif) :
:![[thin space (1/6-em)]](https://www.rsc.org/images/entities/char_2009.gif) 2 type complexes were −4.59 kcal mol−1 and −13.70 kcal mol−1, respectively. These negative values of ΔΔGext(Cf/Cm) indicate that the NTAamide(C8) ligand is experimentally selective for Cf(III) over Cm(III), which is in line with the experimental results.
2 type complexes were −4.59 kcal mol−1 and −13.70 kcal mol−1, respectively. These negative values of ΔΔGext(Cf/Cm) indicate that the NTAamide(C8) ligand is experimentally selective for Cf(III) over Cm(III), which is in line with the experimental results.
4. Conclusion
In this work, we investigated the extraction behavior of the amide ligand, NTAamide (N,N,N′,N′,N′′,N′′-hexaocactyl-nitrilotriacetamide, C8) toward Cf3+ and Cm3+. NTAamide(C8) can effectively extract Cf(III). The extractability and selectivity to Cf3+ over Cm3+ by the ligand were also elucidated by DFT calculations. In the process of extracting Cf(III) with NTAamide(C8) as extractant in nitric acid medium, the slope analysis suggests that Cf3+ was extracted as the 2![[thin space (1/6-em)]](https://www.rsc.org/images/entities/char_2009.gif) :
:![[thin space (1/6-em)]](https://www.rsc.org/images/entities/char_2009.gif) 1 type (ligand
1 type (ligand![[thin space (1/6-em)]](https://www.rsc.org/images/entities/char_2009.gif) :
:![[thin space (1/6-em)]](https://www.rsc.org/images/entities/char_2009.gif) metal) species into the organic phase (kerosene). The extraction process is an endothermic process, and an appropriate increase in temperature is beneficial to the extraction reaction. The main extraction reaction equation is:
metal) species into the organic phase (kerosene). The extraction process is an endothermic process, and an appropriate increase in temperature is beneficial to the extraction reaction. The main extraction reaction equation is:| Cf3+ + 2L + 3NO3 → CfL2·3NO3 |
In addition, the DFT calculation results show that the studied complexes possess similar molecular geometries, and the bonds lengths of the Cf3+ complexes are shorter. Thermodynamic analysis confirmed that the formation of the 1![[thin space (1/6-em)]](https://www.rsc.org/images/entities/char_2009.gif) :
:![[thin space (1/6-em)]](https://www.rsc.org/images/entities/char_2009.gif) 2 complex had more thermodynamic advantages than the 1
2 complex had more thermodynamic advantages than the 1![[thin space (1/6-em)]](https://www.rsc.org/images/entities/char_2009.gif) :
:![[thin space (1/6-em)]](https://www.rsc.org/images/entities/char_2009.gif) 1 complex under the extraction conditions, which is consistent with the results of extraction experiments. The study clearly shows that NTAamide(C8) can effectively extract Cf(III), and this ligand has potential application value for the separation and purification of Cf(III)/Cm(III). It also provides valuable experimental and theoretical guidance for designing more efficient N/O-donor ligands for An3+ separation in the future.
1 complex under the extraction conditions, which is consistent with the results of extraction experiments. The study clearly shows that NTAamide(C8) can effectively extract Cf(III), and this ligand has potential application value for the separation and purification of Cf(III)/Cm(III). It also provides valuable experimental and theoretical guidance for designing more efficient N/O-donor ligands for An3+ separation in the future.
Author contributions
Yilin Wang: investigation, writing – original draft. Hui He: writing – review & editing, conceptualization, resources, project administration. Feng-feng Li: methodology, data curation, supervision. Zhe Xiao: formal analysis, methodology. Wei-Qun Shi: resources, supervision, software. Cong-zhi Wang: methodology, software. Yang Liu: methodology, validation.Conflicts of interest
The authors declare that they have no known competing financial interests or personal relationships that could have appeared to influence the work reported in this paper.Acknowledgements
This study was supported by China Institute of Atomic Energy (EE202312100303).References
- G. R. Choppin, S. G. Thompson, A. Ghiorso and B. G. Harvey, Phys. Rev., 1954, 94, 1080 CrossRef CAS.
- F. D. White, D. Dan and T. E. Albrecht-Schmitt, Chem.–Eur. J., 2019, 25, 10251–10261 CrossRef CAS PubMed.
- S. G. Thompson, K. Street Jr, A. Ghiorso and G. T. Seaborg, Phys. Rev., 1950, 80, 790 CrossRef CAS.
- I. W. Osborne-Lee and C. Alexander, Californium-252: a Remarkable Versatile Radioisotope, Oak Ridge National Lab, 1995 Search PubMed.
- L. R. Morss, N. M. Edelstein, J. Fuger, J. J. Katz and L. Morss, The Chemistry of The Actinide and Transactinide Elements, Springer, 2006 Search PubMed.
- W. Burch, E. Arnold and A. Chetham-Strode, Nucl. Sci. Eng., 1963, 17, 438–442 CrossRef CAS.
- J. Knauer and R. Martin, in Californium-252 Isotope for 21st Century Radiotherapy, Springer, 1997, pp. 7–24 Search PubMed.
- S. M. Robinson, D. E. Benker, E. D. Collins, J. G. Ezold, J. R. Garrison and S. L. Hogle, Radiochim. Acta, 2020, 108, 737–746 CrossRef CAS.
- H. Claiborne and M. Lietzke, Californium Production in the High Flux Isotope Reactor, Oak Ridge National Lab, Tennessee, 1959 Search PubMed.
- D. Stoddard, USAEC Report DP-986, Savannah River Laboratory, Aiken, SC, USA, 1965 Search PubMed.
- V. Spiegel, Nucl. Sci. Eng., 1974, 53, 326–327 CrossRef.
- J. Bigelow, B. Corbett, L. King, S. McGuire and T. Sims, Production of transplutonium elements in the high flux isotope reactor, in Transplutonium Elements—Production and Recovery, 1981, pp. 3–18 Search PubMed.
- R. Malmbeck, C. Apostolidis, R. Carlos, J.-P. Glatz, R. Molinet, A. Morgenstern, A. Nicholl, G. Pagliosa, K. Römer and M. Schädel, Radiochim. Acta, 2001, 89, 543–550 CrossRef CAS.
- K. L. Nash, C. Madic, J. N. Mathur and J. m. Lacquement, in The Chemistry of The Actinide And Transactinide Elements, Springer, 2008, pp. 2622–2798 Search PubMed.
- A. S. Medina, N. A. Wall, C. F. Ivory, S. B. Clark and H. Beyenal, Electrochemical Preconcentration of Lanthanides and Actinides, 2019, p. 57 Search PubMed.
- E. Horwitz, C. Bloomquist and D. Henderson, J. Inorg. Nucl. Chem., 1969, 31, 1149–1166 CrossRef CAS.
- T. Kimura and J. Akatsu, J. Radioanal. Nucl. Chem., 1991, 149, 25–34 CrossRef CAS.
- N. J. Hannink, D. C. Hoffman and B. F. Smith, Solvent Extr. Ion Exch., 1992, 10, 431–438 CrossRef CAS.
- L. King, J. Bigelow and E. Collins, Experience in the separation and purification of transplutonium elements in the transuranium processing plant at the Oak Ridge National Laboratory, Oak Ridge National Lab, TN (USA), 1980 Search PubMed.
- G. Choppin, S. Thompson, A. Ghiorso and B. Harvey, Phys. Rev., 1954, 94, 1080 CrossRef CAS.
- H. Huang, S. Ding, D. Su, N. Liu, J. Wang, M. Tan and J. Fei, Sep. Purif. Technol., 2014, 138, 65–70 CrossRef CAS.
- Y. Sasaki, Y. Tsubata, Y. Kitatsuji and Y. Morita, Chem. Lett., 2013, 42, 91–92 CrossRef CAS.
- Y. Sasaki, Y. Tsubata, Y. Kitatsuji, Y. Sugo, N. Shirasu, Y. Morita and T. Kimura, Solvent Extr. Ion Exch., 2013, 31, 401–415 CrossRef CAS.
- Z. Wang, S. Ding, X. Hu, S. Li, D. Su, L. Zhang, Y. Liu and Y. Jin, Sep. Purif. Technol., 2017, 181, 148–158 CrossRef CAS.
- Z. Wang, F. Li, X. Wang, B. Li, L. Song, X. Yang, Q. Xiao, H. Tang and S. Ding, Sep. Purif. Technol., 2021, 261, 118285 CrossRef CAS.
- Z. Wang, J. Wang, S. Ding, Y. Liu, L. Zhang, L. Song, Z. Chen, X. Yang and X. Wang, Sep. Purif. Technol., 2019, 210, 107–116 CrossRef CAS.
- P. Ruikar, M. Nagar, M. Subramanian, K. Gupta, N. Varadarajan and R. Singh, J. Radioanal. Nucl. Chem., 1995, 196, 171–178 CrossRef CAS.
- Z. Kolarik, Chem. Rev., 2008, 108, 4208–4252 CrossRef CAS PubMed.
- P. Ruikar, M. Nagar and M. Subramanian, J. Radioanal. Nucl. Chem., 1993, 176, 103–111 CrossRef CAS.
- R. G. Haire, in The Chemistry of the Actinide and Transactinide Elements, Springer, 2008, pp. 1499–1576 Search PubMed.
- A. Bhattacharyya, P. K. Mohapatra, A. S. Kanekar, K. Dai, R. J. Egberink, J. Huskens and W. Verboom, ChemistrySelect, 2020, 5, 3374–3384 CrossRef CAS.
- M. Kaneko, M. Watanabe and T. Matsumura, Dalton Trans., 2016, 45, 17530–17537 RSC.
- C.-Z. Wang, J.-H. Lan, Q.-Y. Wu, Z.-F. Chai and W.-Q. Shi, J. Radioanal. Nucl. Chem., 2019, 322, 993–1002 CrossRef CAS.
- C.-Z. Wang, J.-H. Lan, Q.-Y. Wu, Q. Luo, Y.-L. Zhao, X.-K. Wang, Z.-F. Chai and W.-Q. Shi, Inorg. Chem., 2014, 53, 9466–9476 CrossRef CAS PubMed.
- C.-Z. Wang, J.-H. Lan, Q.-Y. Wu, Y.-L. Zhao, X.-K. Wang, Z.-F. Chai and W.-Q. Shi, Dalton Trans., 2014, 43, 8713–8720 RSC.
- C. Wang, Q.-Y. Wu, X.-H. Kong, C.-Z. Wang, J.-H. Lan, C.-M. Nie, Z.-F. Chai and W.-Q. Shi, Inorg. Chem., 2019, 58, 10047–10056 CrossRef CAS PubMed.
- Q.-Y. Wu, J.-H. Lan, C.-Z. Wang, Y.-L. Zhao, Z.-F. Chai and W.-Q. Shi, J. Phys. Chem. A, 2014, 118, 10273–10280 CrossRef CAS PubMed.
- R. A. Penneman and T. K. Keenan, The radiochemistry of americium and curium, National Research Council. Committee on Nuclear Science, Los Alamos, 1960 Search PubMed.
- R. J. Abergel and E. Ansoborlo, Nat. Chem., 2016, 8, 516 CrossRef CAS PubMed.
- S. K. Cary, M. A. Silver, G. Liu, J. C. Wang, J. A. Bogart, J. T. Stritzinger, A. A. Arico, K. Hanson, E. J. Schelter and T. E. Albrecht-Schmitt, Inorg. Chem., 2015, 54, 11399–11404 CrossRef CAS PubMed.
- S. Ansari, P. Pathak, V. Manchanda, M. Husain, A. Prasad and V. Parmar, Solvent Extr. Ion Exch., 2005, 23, 463–479 CrossRef CAS.
- Y. Sasaki, P. Rapold, M. Arisaka, M. Hirata, T. Kimura, C. Hill and G. Cote, Solvent Extr. Ion Exch., 2007, 25, 187–204 CrossRef CAS.
- S. Tachimori, Y. Sasaki and S.-i. Suzuki, Solvent Extr. Ion Exch., 2002, 20, 687–699 CrossRef CAS.
- S. Ansari, P. Pathak, M. Husain, A. Prasad, V. Parmar and V. Manchanda, Radiochim. Acta, 2006, 94, 307–312 CrossRef CAS.
- G. Modolo, H. Asp, C. Schreinemachers and H. Vijgen, Solvent Extr. Ion Exch., 2007, 25, 703–721 CrossRef CAS.
- K. Bell, A. Geist, F. McLachlan, G. Modolo, R. Taylor and A. Wilden, Procedia Chem., 2012, 7, 152–159 CrossRef CAS.
- M. Kaneko, H. Suzuki and T. Matsumura, Inorg. Chem., 2018, 57, 14513–14523 CrossRef CAS PubMed.
- M. e. Frisch, G. Trucks, H. Schlegel, G. Scuseria, M. Robb, J. Cheeseman, G. Scalmani, V. Barone, G. Petersson and H. Nakatsuji, Gaussian 16, Gaussian, Inc., Wallingford, CT, 2016 Search PubMed.
- M. Kaneko, M. Watanabe, S. Miyashita and S. Nakashima, J. Nucl. Radiochem. Sci., 2017, 17, 9–15 CrossRef CAS.
- Y. Sasaki, Y. Sugo, S. Suzuki and S. Tachimori, Solvent Extr. Ion Exch., 2001, 19, 91–103 CrossRef CAS.
- S. K. Cary, J. Su, S. S. Galley, T. E. Albrecht-Schmitt, E. R. Batista, M. G. Ferrier, S. A. Kozimor, V. Mocko, B. L. Scott and C. E. Van Alstine, Dalton Trans., 2018, 47, 14452–14461 RSC.
- C. Adamo and V. Barone, J. Chem. Phys., 1999, 110, 6158–6170 CrossRef CAS.
- M. P. Kelley, G. J.-P. Deblonde, J. Su, C. H. Booth, R. J. Abergel, E. R. Batista and P. Yang, Inorg. Chem., 2018, 57, 5352–5363 CrossRef CAS PubMed.
- W. Küchle, M. Dolg, H. Stoll and H. Preuss, J. Chem. Phys., 1994, 100, 7535–7542 CrossRef.
- X. Cao and M. Dolg, J. Mol. Struct.: THEOCHEM, 2004, 673, 203–209 CrossRef CAS.
- X. Cao, M. Dolg and H. Stoll, J. Chem. Phys., 2003, 118, 487–496 CrossRef CAS.
- P. Politzer, P. R. Laurence and K. Jayasuriya, Environ. Health Perspect., 1985, 61, 191–202 CrossRef CAS PubMed.
- R. F. Bader, J. Phys. Chem. A, 2009, 113, 10391–10396 CrossRef CAS PubMed.
- T. Lu and F. Chen, J. Comput. Chem., 2012, 33, 580–592 CrossRef CAS PubMed.
- A. R. Mountain and N. Kaltsoyannis, Dalton Trans., 2013, 42, 13477–13486 RSC.
- W. F. Furter and R. Cook, Int. J. Heat Mass Transfer, 1967, 10, 23–36 CrossRef CAS.
- C. Wang, Q.-Y. Wu, C.-Z. Wang, J.-H. Lan, C.-M. Nie, Z.-F. Chai and W.-Q. Shi, Dalton Trans., 2020, 49, 4093–4099 RSC.
- Q.-Y. Wu, C.-Z. Wang, J.-H. Lan, C.-L. Xiao, X.-K. Wang, Y.-L. Zhao, Z.-F. Chai and W.-Q. Shi, Inorg. Chem., 2014, 53, 9607–9614 CrossRef CAS PubMed.
- M. Kaupp, D. Danovich and S. Shaik, Coord. Chem. Rev., 2017, 344, 355–362 CrossRef CAS.
- X. Cao, D. Heidelberg, J. Ciupka and M. Dolg, Inorg. Chem., 2010, 49, 10307–10315 CrossRef CAS PubMed.
- A. Bhattacharyya, T. K. Ghanty, P. K. Mohapatra and V. K. Manchanda, Inorg. Chem., 2011, 50, 3913–3921 CrossRef CAS PubMed.
- J. Narbutt, A. Wodyński and M. Pecul, Dalton Trans., 2015, 44, 2657–2666 RSC.
- O. A. Syzgantseva, V. Tognetti and L. Joubert, J. Phys. Chem. A, 2013, 117, 8969–8980 CrossRef CAS PubMed.
- F. Cortés-Guzmán and R. F. Bader, Coord. Chem. Rev., 2005, 249, 633–662 CrossRef.
- B. Vlaisavljevich, P. Miró, C. J. Cramer, L. Gagliardi, I. Infante and S. T. Liddle, Chem.–Eur. J., 2011, 17, 8424–8433 CrossRef CAS PubMed.
- X. Fradera, M. A. Austen and R. F. Bader, J. Phys. Chem. A, 1999, 103, 304–314 CrossRef CAS.
- A. Klamt, Wiley Interdiscip. Rev.: Comput. Mol. Sci., 2011, 1, 699–709 CAS.
- T. Brennan, South Atl. Q., 2001, 100, 659–691 CrossRef.
- S. M. Ali, S. Pahan, A. Bhattacharyya and P. Mohapatra, Phys. Chem. Chem. Phys., 2016, 18, 9816–9828 RSC.
- E. Macerata, E. Mossini, S. Scaravaggi, M. Mariani, A. Mele, W. Panzeri, N. Boubals, L. Berthon, M.-C. Charbonnel and F. Sansone, J. Am. Chem. Soc., 2016, 138, 7232–7235 CrossRef CAS PubMed.
Footnote |
| † Electronic supplementary information (ESI) available: Appendix A. Supplementary material. Actual concentration of Cf3+ (converted from liquid scintillation number), optimized structures of the NTAamide(C8) ligand in the gas phase, the electrostatic potential (ESP) of NTAamide(C8) based on optimized structures, Mulliken population analysis (MPA) and Cartesian coordinates of optimized structures (PDF). See DOI: https://doi.org/10.1039/d2ra07660h |
| This journal is © The Royal Society of Chemistry 2023 |

