DOI:
10.1039/D2RA07334J
(Paper)
RSC Adv., 2023,
13, 8934-8941
Preparation of highly dispersed SnO/TiO2 catalysts and their performances in catalyzing polyol ester
Received
18th November 2022
, Accepted 13th March 2023
First published on 17th March 2023
Abstract
A series of stannous oxide supported on rutile titanium dioxide (SnO/TiO2) were prepared by a conventional incipient wetness impregnation method, and their performance as catalysts for fatty acid esterification reactions was investigated. The effects of Sn precursors (SnCl2·2H2O or SnC2O4), loading amounts (5–15%), and treating ambiences (air and N2) were explored. The optimized 10% SnO/TiO2–Cl with SnCl2·2H2O as the Sn precursor and thermal treatment in N2 showed the best esterification performance. Specifically, 10% SnO/TiO2–Cl catalyzed the esterification process of trimethylolpropane and n-octanoic acid with a conversion of 99.6% over 5 h at 160 °C, and 10% SnO/TiO2–Cl was efficient for six catalytic cycles. Based on the results of X-ray diffraction (XRD), Raman spectra, high-resolution transmission electron microscopy (HRTEM), infrared spectra of pyridine adsorption (Py-IR), and ammonia temperature programmed desorption (NH3-TPD), the improved catalytic performance is supposed to be attributable to the high dispersion of the Sn species on 10% SnO/TiO2–Cl as the moderate Lewis acid sites.
1. Introduction
Polyol esters (POEs) are a class of green and renewable synthetic lubricants with high thermal stability, biodegradability, and viscosity index, which are mainly used for engine cooling and anti-wear, fire-resistant transformer cooling, industrial furnace chain lubrication, etc.1–3 Furthermore, compared with mineral-based lubricants obtained by adding additives to form a thick oil film between frictional substrates, POEs with polar functional groups easily adsorb to form a stable oil film, and thus have significantly better lubricating properties than mineral base oils.4 The esterification between polyols and carboxylic acids to POEs is generally catalyzed by conventional homogeneous acid catalysts, such as concentrated sulfuric acid, phosphoric acid, p-toluenesulfonic acid, etc.5 Although the conventional homogeneous acid catalysts have high catalytic efficiency and lower cost, they also suffer from serious equipment corrosion, more side reactions, and complicated subsequent separation processes.6–8 In contrast, heterogeneous acid catalysts are more economical and environmentally friendly than traditional homogeneous acid catalysts, and are becoming one of the research hotspots for catalytic reactions of POEs.
Recently, heterogeneous catalysts for fatty acid esterification reactions, such as immobilized mineral acids (sulfated ZrO2, WO3, SiO2, SnO),9–11 heteropolyacids (H3PW12O40/ZrO2, H3PW12O40),12–14 and oxides (SnO, WO3/AlPO4, WO3/ZrO2, SnO2/SiO2, zeolites),15–20 have been reported. Notably, stannous (Sn2+)-based catalysts such as stannous chloride (SnCl2),21 stannous octanoate,22 and SnO16 have been increasingly considered as potential catalysts for esterification and ester exchange as a result of their high safety and low cost.23–25 However, as heterogeneous acidic catalysts, the main drawbacks of SnO are the low surface area and the inevitable presence of Sn residues in the product, which greatly restricts their practical application.26 Despite substantial progress in supported Sn catalysts,27,28 more research is still necessary to improve the activity and stability of Sn-based catalysts for the synthesis of POEs.
Herein, a series of SnO supported on rutile titanium dioxide (SnO/TiO2) catalysts were prepared by the conventional incipient wetness impregnation method to investigate the structure–activity relationship between Sn species and the esterification reaction. By adjusting the Sn precursors (SnCl2·2H2O or SnC2O4), loading amounts (5–15%), and treating ambiences (air and N2), we found that 10% SnO/TiO2–Cl with SnCl2·2H2O as precursors upon roasting in N2 showed the excellent esterification properties. 10% SnO/TiO2–Cl catalyzed the esterification of trimethylolpropane and n-octanoic acid with 99.6% conversion for 5 h at 160 °C, and 10% SnO/TiO2–Cl was efficient after six catalytic cycles. The results indicated that the increased catalytic activity is due to the highly dispersed Sn species as the moderate Lewis acid sites on 10% SnO/TiO2–Cl.
2. Experimental
2.1. Preparation of SnO/TiO2 catalysts
A series of SnO/TiO2 catalytic systems were prepared via an incipient wetness impregnation method. In a typical preparation of 10% SnO/TiO2–Cl, a certain amount of SnCl2·2H2O (93 mg, Sinopharm) was dissolved in anhydrous ethanol (2.5 mL, Sinopharm). TiO2 (0.5 g, rutile, Aladdin) was added into the above solution, and continuously stirred for 1 h. Subsequently, the above mixture was dried overnight in vacuum drying chamber at 30 °C. Finally, the dried mixture was heated to 450 °C at a rate of 10 °C min−1 in N2 (100 mL min−1) and maintained for 2 h, to obtain 10% SnO/TiO2–Cl. The preparation process of SnO/TiO2-ox was similar as that of SnO/TiO2–Cl except changing SnCl2·2H2O to stannous (II) oxalate (SnC2O4, Macklin). By turning calcination atmosphere (N2) of SnO/TiO2–Cl to air, SnO/TiO2–Cl-A was obtained. The synthesis parameters and abbreviations of catalysts in this work are summarized in Table 1.
Table 1 Summary of synthesis parameters and abbreviations of catalysts
| Catalyst |
Tin precursor |
Heat treatment atmosphere |
| 5% SnO/TiO2–Cl |
SnCl2·2H2O (44 mg) |
N2 |
| 7.5% SnO/TiO2–Cl |
SnCl2·2H2O (68 mg) |
N2 |
| 10% SnO/TiO2–Cl |
SnCl2·2H2O (93 mg) |
N2 |
| 15% SnO/TiO2–Cl |
SnCl2·2H2O (148 mg) |
N2 |
| 2.5% SnO/TiO2-ox |
SnC2O4 (20 mg) |
N2 |
| 10% SnO/TiO2-ox |
SnC2O4 (85 mg) |
N2 |
| 10% SnO/TiO2–Cl-A |
SnCl2·2H2O (93 mg) |
Air |
2.2. Catalyst characterization
Crystal structures of catalysts were obtained using X-ray diffraction (XRD, Bruker D8) with an automated transmission diffractometer, Cu Kα1 radiation (40 kV/40 mA), the scanning speed of 8° min−1, and the scanning range of 5–80°. Transmission electron microscopy (TEM) and high-resolution TEM (HRTEM) were performed on a Tecnai G2 F30 S-Twin at an acceleration voltage of 200 kV. Raman spectra were used by HORIBA HR evolution Raman spectrometer with laser wavelength of 532 nm and the scanning range of 3500–55 cm−1. X-ray photoelectron spectroscopy (XPS) were carried out on Thermo ESCALAB 250Xi with the excitation source of Al Kα (hν = 1486.6 eV). To calibrate the sample's binding energy, the binding energy of the indeterminate carbon (C 1s) was set to 284.6 eV.
Infrared spectra of pyridine adsorption (Py-IR) were obtained by Bruker Tensor27 Fourier transform infrared spectrometer. The procedure is as follows: the sample was pretreated for 2 h at 450 °C and vacuum (10−2 Pa), subsequently cooled to 40 °C, and background was collected. Then, pyridine was introduced into in situ IR cell, and the physically adsorbed pyridine was removed for 1 h with argon. Finally, a Py-IR spectrum was collected with resolution of 4 cm−1, acquisition times of 64, and a scanning range of 1700–1400 cm−1.
Ammonia temperature programmed desorption (NH3-TPD) was performed on the TP-5080-B temperature-programmed chemisorption instrument. The procedure is as follows: the sample (100 mg) was pretreated for 1 h at 450 °C with helium (99.999%, 50 mL min−1), subsequently cooled to 50 °C, and pure NH3 (99.99%, 10 mL min−1) was introduced for 0.5 h. Then, physically adsorbed NH3 was removed for 2 h with helium. Finally, the sample was heated from 50 °C to 750 °C at a rate of 10 °C min−1, and continuously record NH3 in the effluent through a thermal conductivity detector.
2.3. Activity test
In a typical synthetic process of lubricating ester oils, catalyst (0.5 wt%, 35 mg), trimethylolpropane (TMP, 15 mmol, 2.0 g), and n-octanoic acid (45 mmol, 5.1 g) were added into a three-necked flask (100 mL). Then, 3 mL toluene was added as a water-removing agent and the reaction system was heated to 160 °C under stirring and maintained for the desired time. After the reaction, the catalyst was removed by filtration. The produce was obtained by rotational evaporation to remove water and unreacted substrates. The conversion rate of the reaction product was determined by testing the acid value.
3. Results and discussion
3.1. Catalytic performance
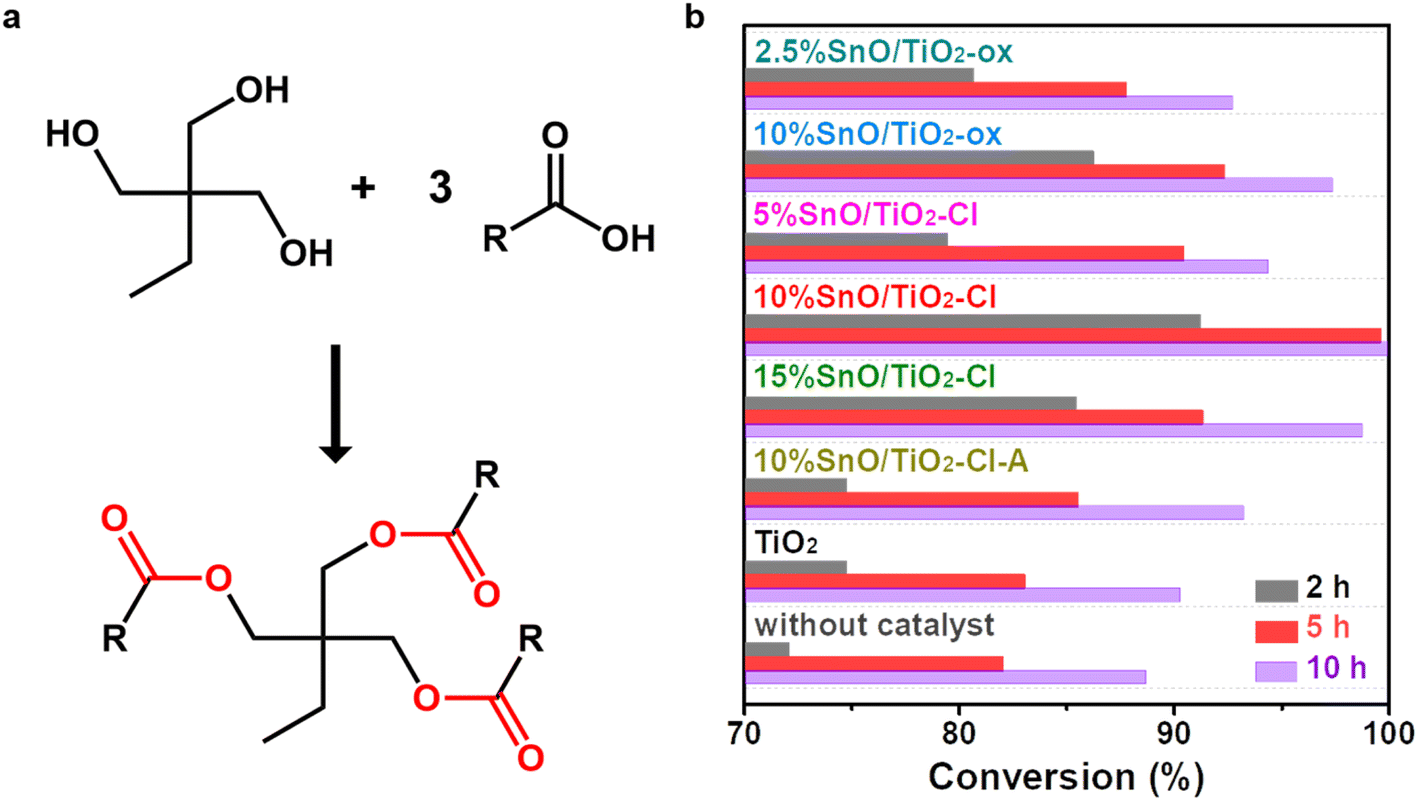
Esterification reactions between TMP and n-octanoic acid were carried out (Fig. 1a). Fig. 1b summarizes the effect of the preparation conditions (Sn precursor, loading amount, and treatment performed atmosphere) on the catalytic activity of these SnO/TiO2. As a comparison, the conversions in the absence of catalyst were 72.0%, 82.0% and 88.7% at 2 h, 5 h and 10 h, respectively, while these conversions were 74.7%, 83.0% and 90.3% with the addition of TiO2. This indicates that in the absence of catalyst or addition of TiO2, the esterification takes a long time to reach complete conversion, which severely reduces the product efficiency. The addition of SnO/TiO2 catalysts significantly improved the esterification process of TMP and n-octanoic acid. Among these SnO/TiO2, 10% SnO/TiO2–Cl showed the best esterification performance with conversions of 91.2% and 99.6% at 2 h and 5 h, which was equivalent to or better than the catalytic esterification performance reported in the literature (Table 2).29–36 By changing the Sn precursor from SnCl2·2H2O to SnC2O4, the conversion was reduced to 86.2% and 92.3% at 2 h and 5 h on 10% SnO/TiO2-ox. Then, the effect of Sn loading on the catalytic activity was investigated. Catalytic activity showed a volcanic trend with increasing Sn loading. Moreover, the catalytic performance of 10% SnO/TiO2-ox was slightly better than that of pure SnO (89.7% and 98.2% at 2 h and 5 h, 3.5 mg), using the reported preparation method.32 Finally, when SnO/TiO2–Cl-A was used as the catalyst, the conversions decreased to 74.7% and 85.5% at 2 h and 5 h, respectively. Considering that SnO can be converted to SnO2 by roasting in the air, the decrease in the activity of SnO/TiO2–Cl-A should be due to the oxidation of SnO.
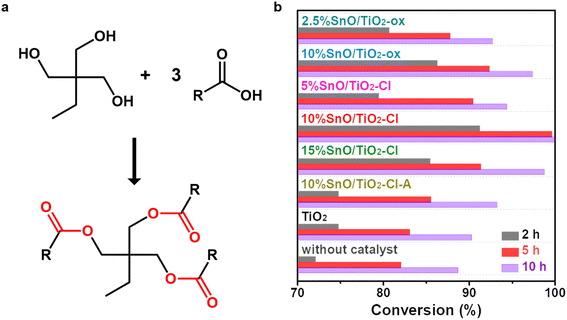 |
| | Fig. 1 (a) Schematic diagram of lubricating ester synthesis reaction. (b) Catalytic activities of different supported SnO/TiO2 for lubricating ester synthesis reaction between TMP and n-octanoic acid. | |
Table 2 Comparison of catalytic performance for esterification reaction
| Catalyst |
Amounta (wt%) |
Reactant |
Tem. (°C) |
Time (h) |
Yield (%) |
|
| Amounts: mass percentage of the total amount of catalyst with substrate. |
| 10% SnO/TiO2–Cl |
0.5 |
TMP + n-octanoic acid |
160 |
5 |
99.6 |
This work |
| p-toluene sulfonic acid |
1.5 |
Fatty acid + TMP |
130 |
5 |
89 |
29 |
| SnCl2 |
0.1 |
TMP + undecylenic acid |
150 |
8 |
96.2 |
30 |
| SnO |
0.9 |
Pentaerythrotol + ricinoleic acid |
170 |
4 |
99.7 |
31 |
| SnO@GO |
0.5 |
TMP + n-capric acid |
160 |
5 |
98.3 |
32 |
| COK-15b |
2.2 |
Pentaerythrotol + n-octanoic acid |
160 |
6 |
97 |
33 |
| Zr-ZSM-5-st |
0.5 |
TMP + n-caprylic acid |
160 |
5 |
94.41 |
34 |
| ZrO2- imidazolium sulfonic acid chloride |
0.84 |
CH3OH + oleic acid |
60 |
1 |
98.9 |
35 |
| Thermomyces lanuginosus lipase/Fe3O4-CA |
5 |
Free fatty acids + neopentyl glycol |
45 |
6 |
68 |
36 |
Following six cycles of TMP–n-caprylic esterification (Fig. 2), the obtained catalyst (10% SnO/TiO2–Cl and 10% SnO/TiO2-ox) exhibited reduced activity. The yield of TMP ester reflected catalyst stability, and the value over 10% SnO/TiO2–Cl was approximately 95%, higher than 10% SnO/TiO2-ox (92.1%).
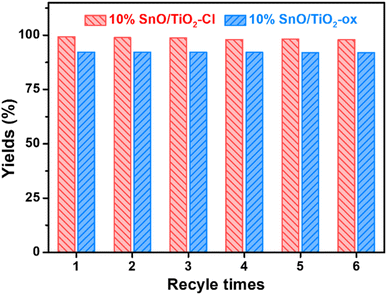 |
| | Fig. 2 The reusability of 10% SnO/TiO2–Cl and 10% SnO/TiO2-ox for esterification. | |
3.2. Characterization
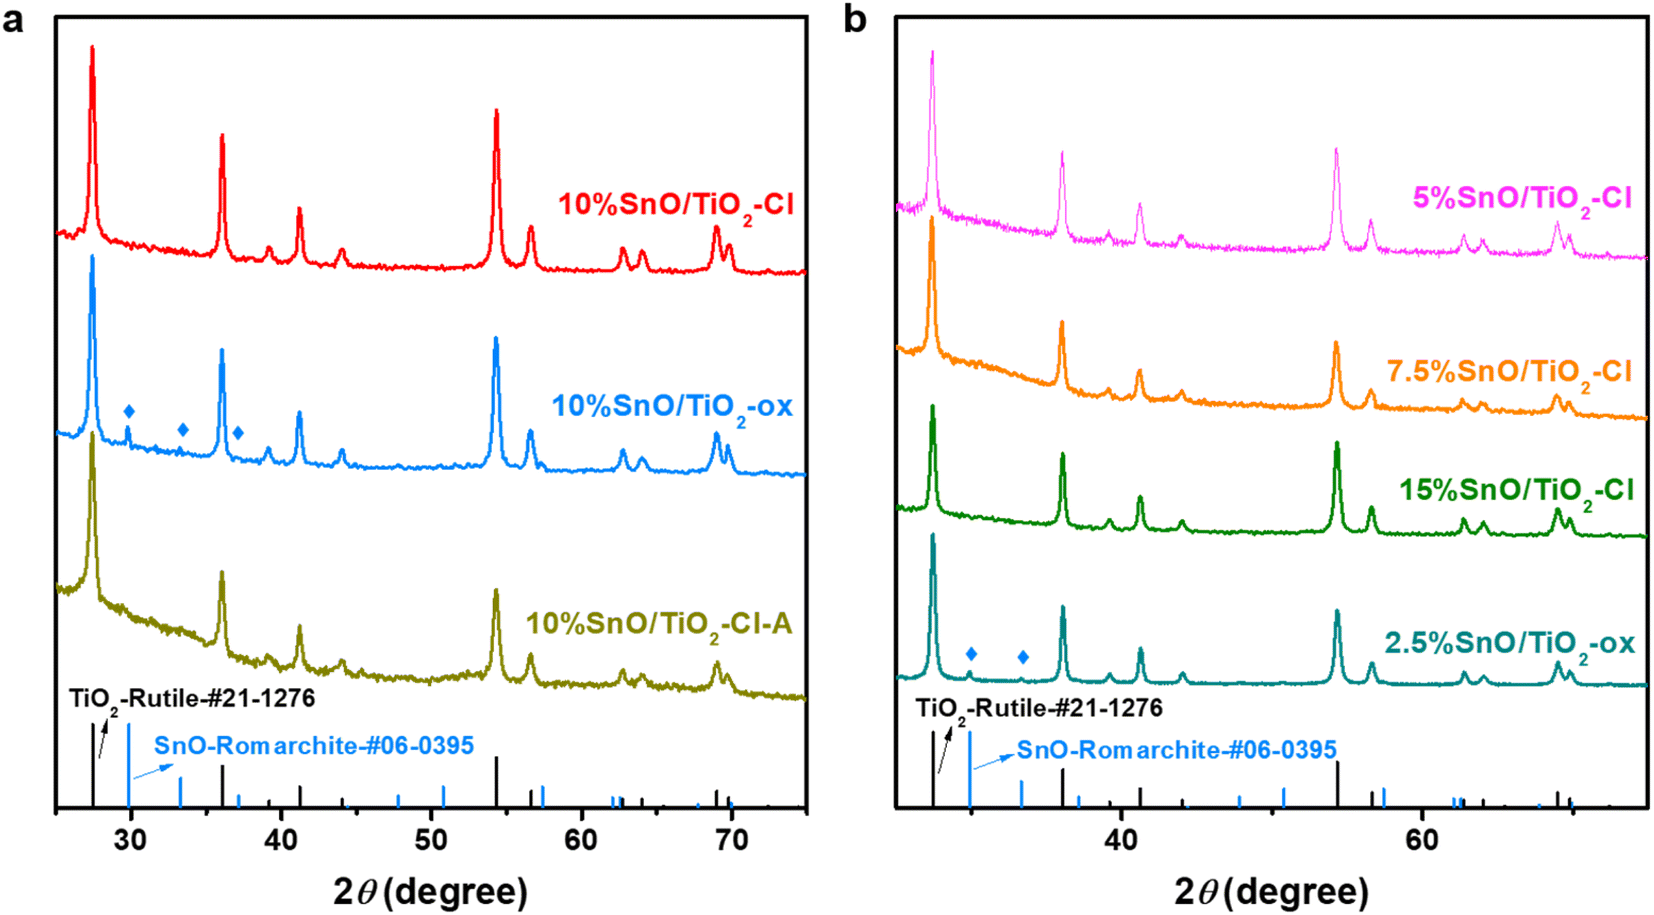
The crystal phases of these SnO/TiO2 were characterized by XRD (Fig. 3). In addition to these XRD pattern peaks matching rutile TiO2 (PDF No. 21-1276), no new diffraction peaks corresponding to Sn, SnO or SnO2 appear in the XRD pattern of 10% SnO/TiO2–Cl, indicating that Sn species are highly dispersed on 10% SnO/TiO2–Cl.37 In contrast, the 10% SnO/TiO2-ox shows three new diffraction peaks at 29.8°, 33.2° and 57.3°, which correspond to (101), (110) and (211) diffraction planes of the romanite-type SnO (PDF No. 06-0395) with the tetragonal crystal structure.38 In addition, SnO species on 2.5% SnO/TiO2-ox and 10% SnO/TiO2-ox have average particle sizes of 33.9 and 76.7 nm, calculated by Scherer's formula (D = Kλ/B![[thin space (1/6-em)]](https://www.rsc.org/images/entities/char_2009.gif) cosθ, K is Scherrer's constant (0.89); B is the half-height width of the measured sample diffraction peak; θ is the diffraction angle; γ is X-ray wavelength, 0.154056 nm). Considering that the catalytic activity of 10% SnO/TiO2-ox was lower than that of 10% SnO/TiO2–Cl (Fig. 1b), the highly dispersed Sn species should be responsible for the improved catalytic performance. Furthermore, XRD results of SnO/TiO2–Cl with different SnO loadings indicated the highly dispersed SnO on rutile TiO2.
cosθ, K is Scherrer's constant (0.89); B is the half-height width of the measured sample diffraction peak; θ is the diffraction angle; γ is X-ray wavelength, 0.154056 nm). Considering that the catalytic activity of 10% SnO/TiO2-ox was lower than that of 10% SnO/TiO2–Cl (Fig. 1b), the highly dispersed Sn species should be responsible for the improved catalytic performance. Furthermore, XRD results of SnO/TiO2–Cl with different SnO loadings indicated the highly dispersed SnO on rutile TiO2.
 |
| | Fig. 3 XRD pattern of TiO2 and different SnO/TiO2. | |
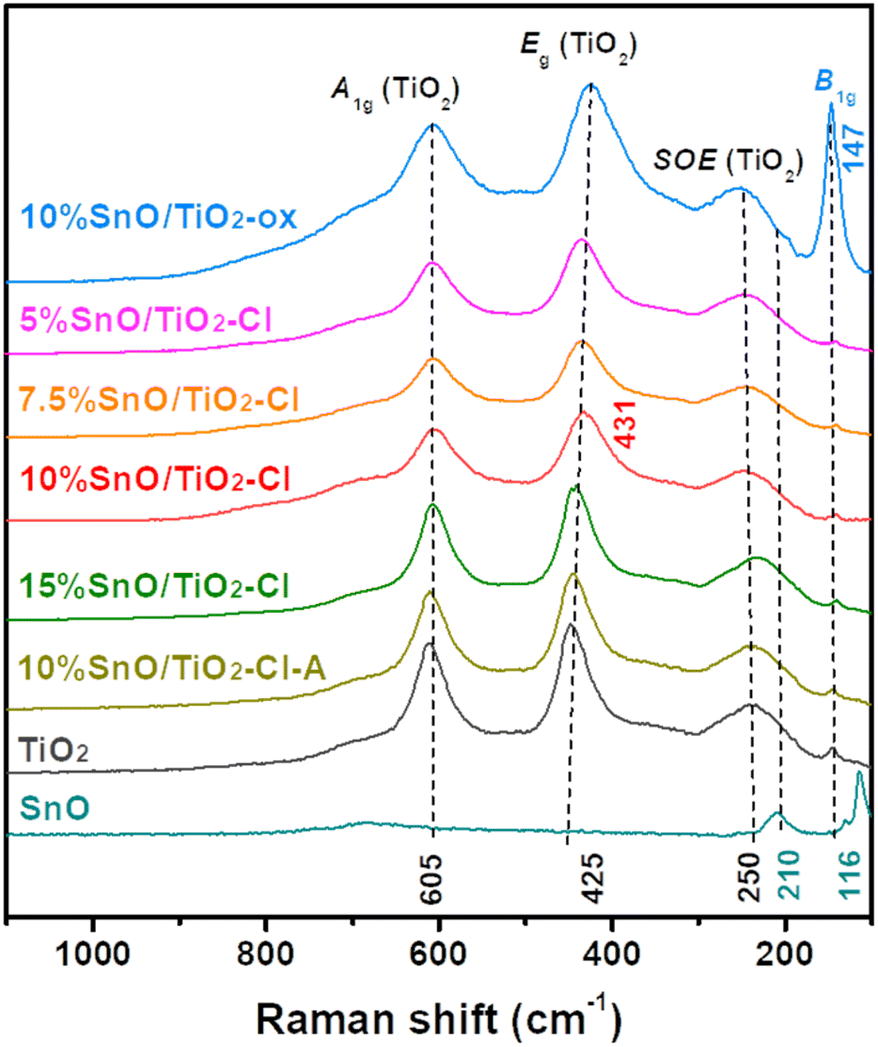
Fig. 4 illustrates Raman spectra of these SnO/TiO2 catalysts. For Raman spectrum of rutile TiO2, three strong peaks at 250, 425, and 605 cm−1 are assigned to the second order effect (SOE) mode, Eg mode (asymmetric bending of the O–Ti–O bond in the {001} plane), and A1g (symmetric stretching of O–Ti–O) mode of rutile TiO2, respectively.39 In contrast, the peak of SnO (210 and 116 cm−1) does not appear in the Raman spectrum of 10% SnO/TiO2–Cl, where the peak for Eg mode of vibration shifts to a higher Raman shift (431 cm−1). This indicates that the structure of TiO2 is slightly distorted, due to the insertion of Sn ions. To verify this observation, we examined the Raman spectra of SnO/TiO2–Cl with different Sn contents, where the Eg peak shifts to 441 cm−1 (15% SnO/TiO2–Cl) from 436 cm−1 (5% SnO/TiO2–Cl). For Raman spectrum of 10% SnO/TiO2-ox, one new peak at 147 cm−1 (Fig. 4), assigned to a stoichiometric SnOx phase (1 < x < 2).40
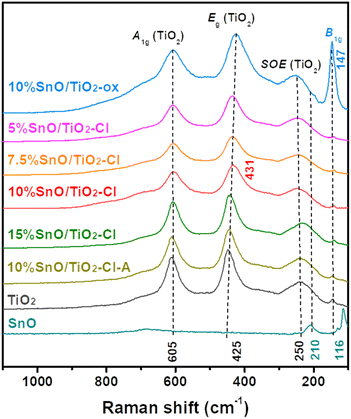 |
| | Fig. 4 Raman spectra of TiO2 and different SnO/TiO2. | |
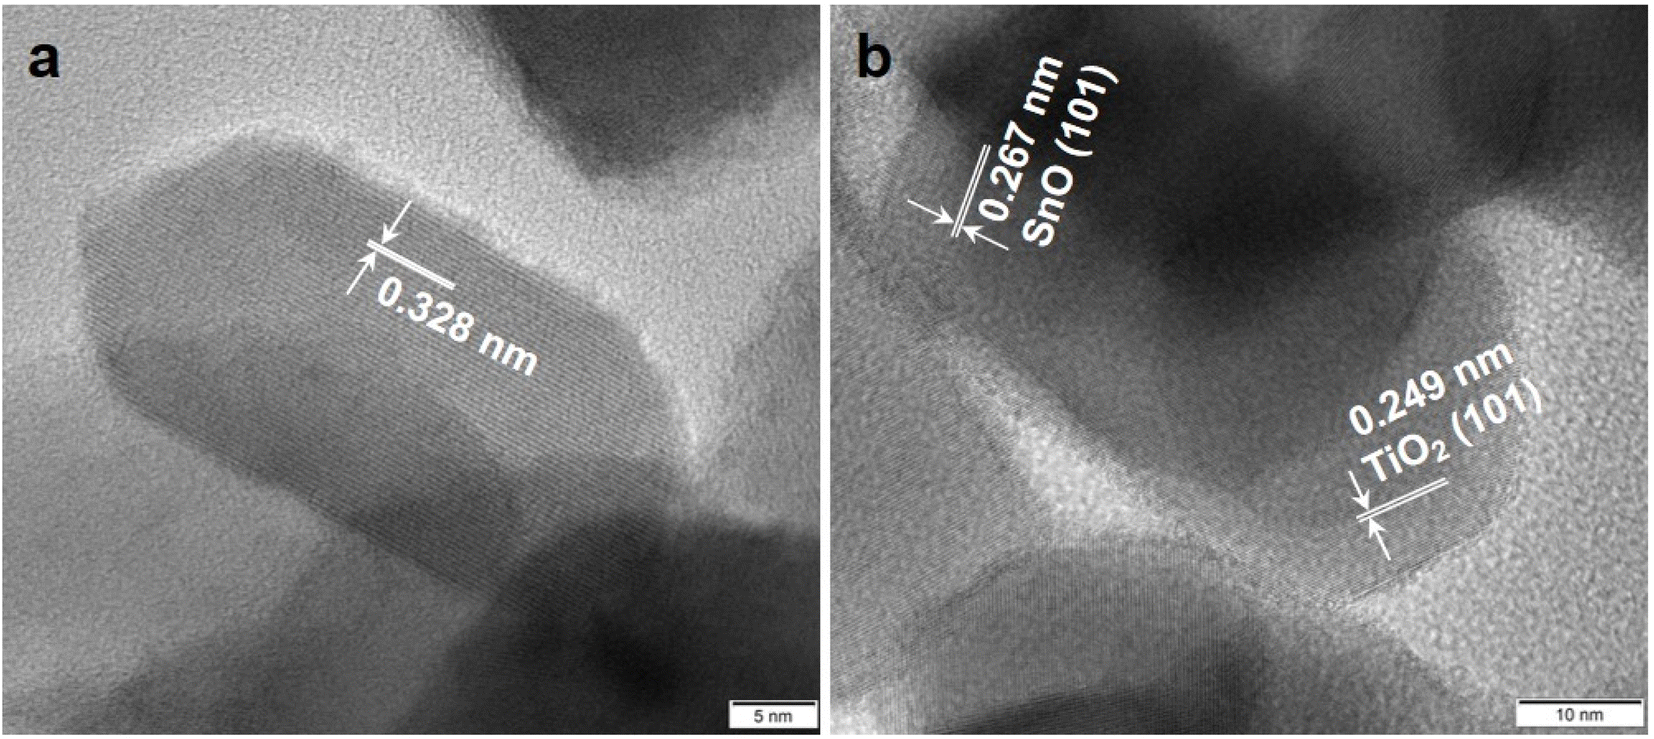
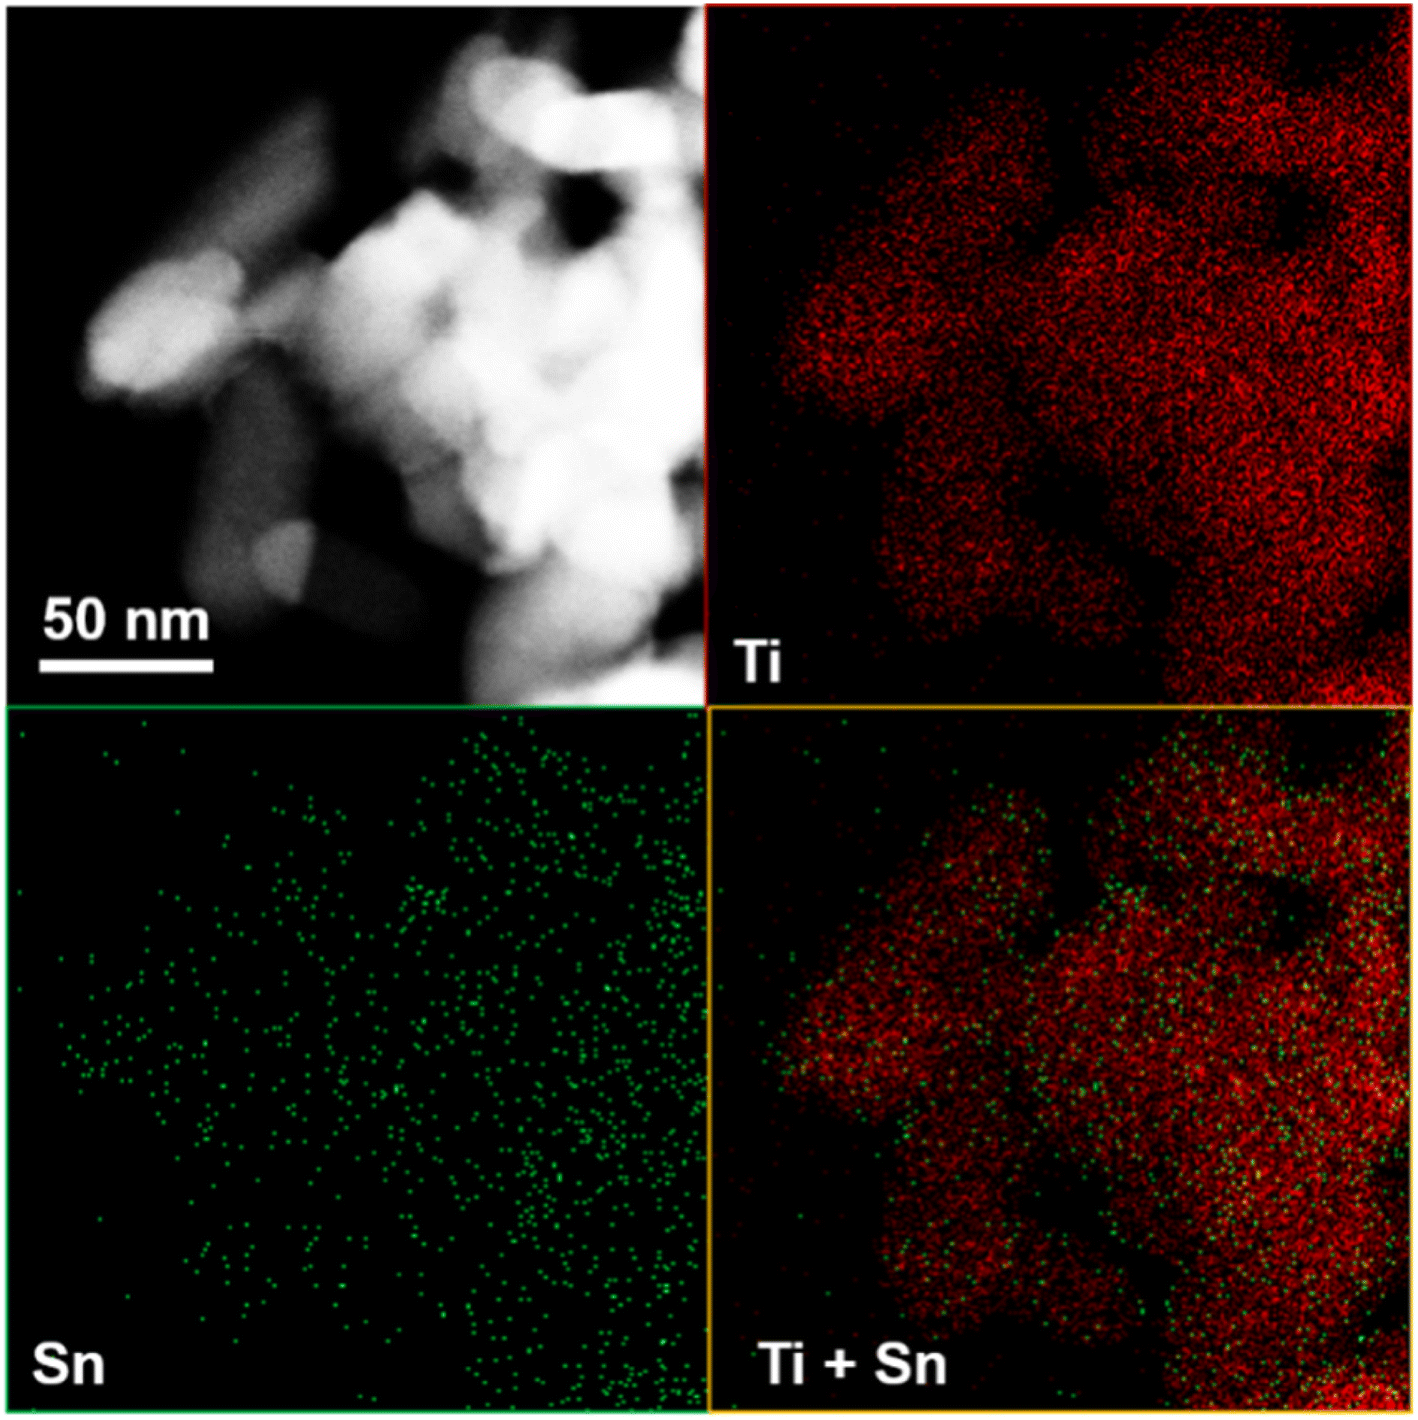
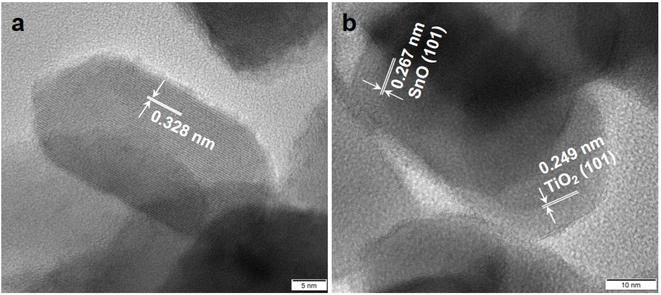
As shown in Fig. 5, TEM images of 10% SnO/TiO2–Cl and 10% SnO/TiO2-ox show uniform polyhedral in the range of 50–150 nm. SnO shows uniform spheroidal in the range of 20–50 nm (Fig. 5c). After the magnification, HRTEM image of 10% SnO/TiO2–Cl (Fig. 6a) shows a clear lattice distance of 0.328 nm, which is larger than the (110) plane (0.325 nm) of rutile TiO2. This demonstrates the entry of Sn ions into the lattice of rutile TiO2, which is consistent with the XRD and Raman results (Fig. 3 and 4). In contrast, HRTEM image of 10% SnO/TiO2-ox (Fig. 6b) displays clear lattice distances of 0.249 nm and 0.267 nm, which perfectly match with the (101) planes of rutile TiO2 and romanite-type SnO. In HAADF-STEM-EDX element mapping images (Fig. 7), Sn elements (green) of 10% SnO/TiO2–Cl are evenly distributed on TiO2. In conclusion, the Sn species are highly dispersed on 10% SnO/TiO2–Cl, whereas Sn species exist in the form of SnO NPs on 10% SnO/TiO2-ox.
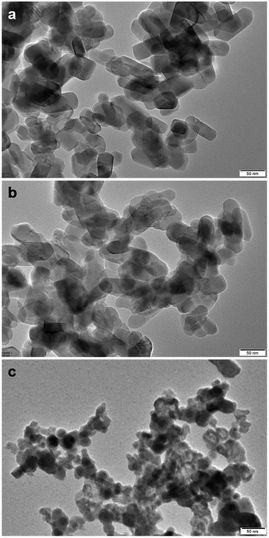 |
| | Fig. 5 TEM images of (a) 10% SnO/TiO2–Cl, (b) 10% SnO/TiO2-ox, and (c) SnO. | |
 |
| | Fig. 6 HRTEM images of (a) 10% SnO/TiO2–Cl and (b) 10% SnO/TiO2-ox. | |
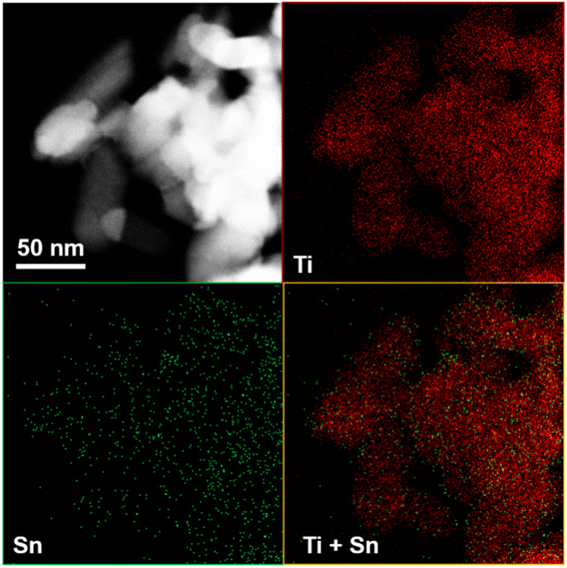 |
| | Fig. 7 HAADF-STEM-EDX elemental mapping images of 10% SnO/TiO2–Cl. | |
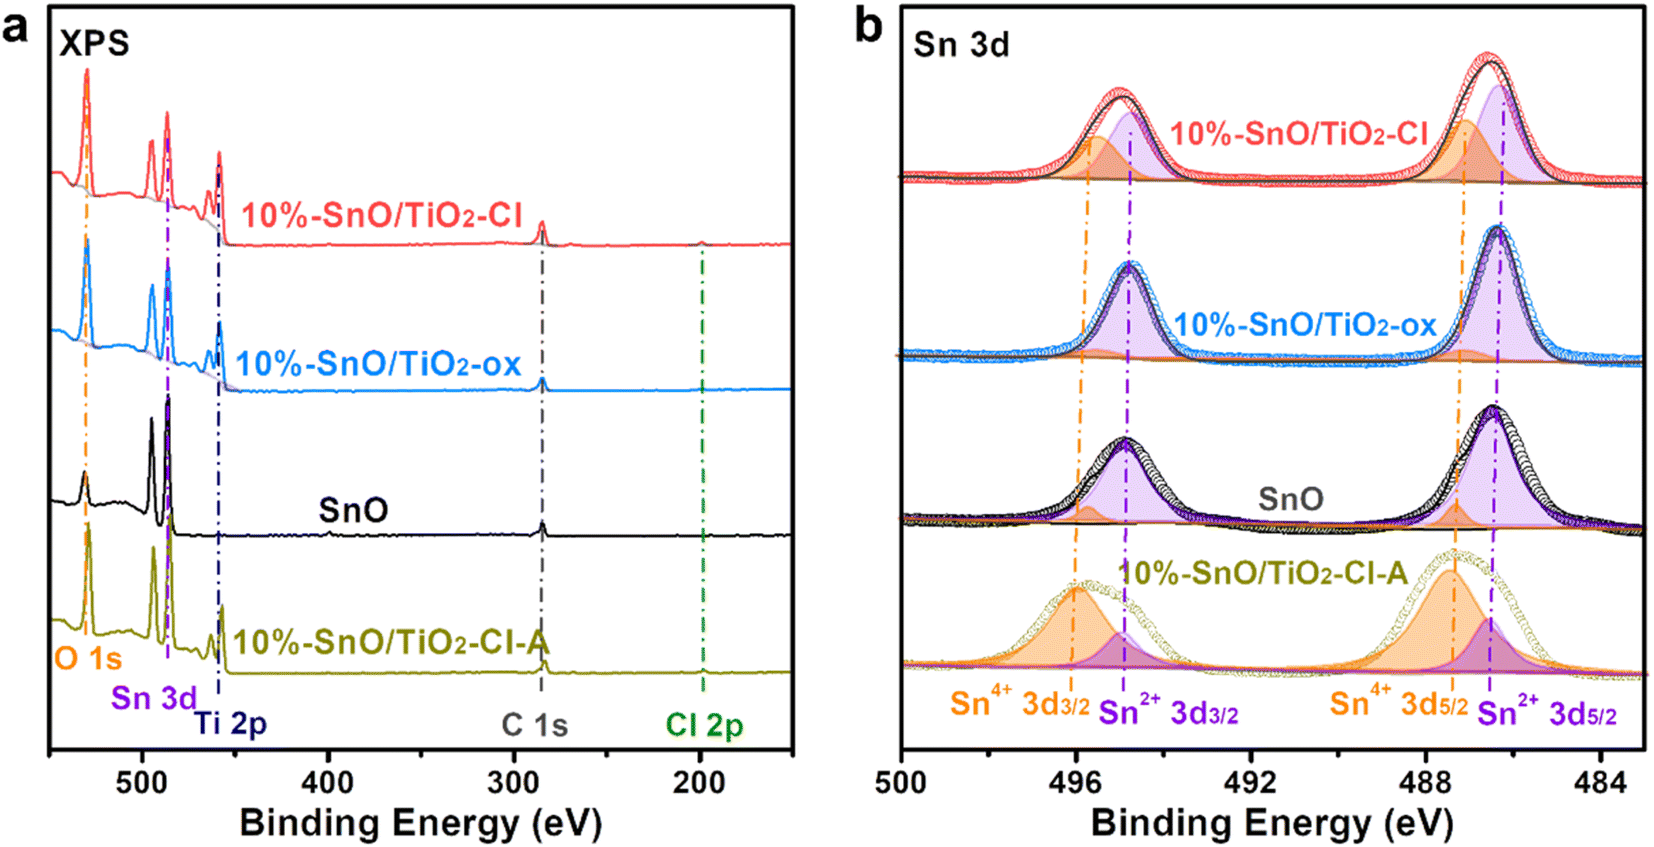
The composition and valence of various elements on the surface of SnO and SnO/TiO2 were determined by XPS. Fig. 8a shows the XPS full spectra of these samples. For SnO/TiO2, four groups of XPS peaks at ∼529.7, 486.2, 458.3, and 284.8 eV, correspond to O 1s, Sn 3d, Ti 2p, and C 1s. In contrast, a weak peak in 10% SnO/TiO2–Cl (Fig. 8a) appears at 198.9 eV, assigned to Cl 2p, due to the introduction of SnCl2·2H2O as the precursor. The atomic ratio of Sn/Cl (36.9%/0.75%, Table 3) is much higher than that of SnCl2·2H2O (1/2), suggesting that SnCl2·2H2O should transform into Sn oxides during synthesis. Moreover, atomic ratios of Sn/O on the surface of 10% SnO/TiO2–Cl and 10% SnO/TiO2-ox are 36.9%/35.5% and 35.6%/31.8%, indicating that Sn species should exist in the form of SnO. As shown in Fig. 8b, after calibrating and fitting of Sn 3d XPS, two groups of peaks at 486.3, 494.8 eV, and 487.1, 495.5 eV correspond to Sn2+ 3d5/2, 3d3/2 and Sn4+ 3d5/2, 3d3/2, respectively.41 The ratios of Sn4+/Sn2+ on 10% SnO/TiO2–Cl, 10% SnO/TiO2-ox, 10% SnO/TiO2–Cl-A, and SnO are 41.6/58.4, 9.8/90.2, 77.5/22.5, 8.8/91.2, indicating the coexistence of Sn4+ and Sn2+. Combining the result of XRD, Raman, HRTEM, and XPS with the fact that the ion radii of Sn4+ (69 pm) is slightly larger than that of Ti4+ (60.5 pm), we deduce that Sn4+ should enter rutile TiO2 lattice to lead to slight crystal expansion, meanwhile, highly dispersed SnO species are present on the surface of 10% SnO/TiO2-ox.
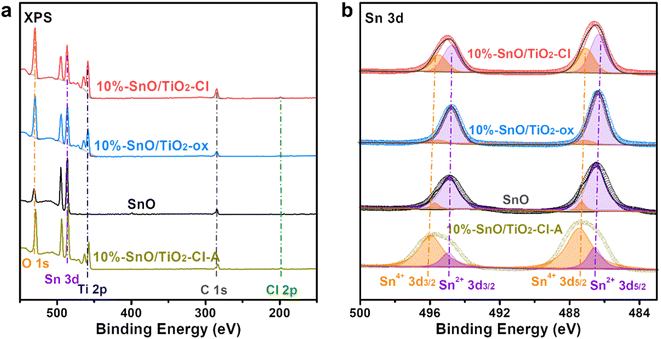 |
| | Fig. 8 (a) XPS full-spectra and (b) Sn 3d XPS spectra of 10% SnO/TiO2–Cl, 10% SnO/TiO2-ox, 10% SnO/TiO2–Cl-A, and SnO. | |
Table 3 XPS spectra results of SnO and different SnO/TiO2
| Sample |
Atom proportions |
Sn 3d |
| Sn (%) |
O (%) |
Ti (%) |
Cl (%) |
Sn4+/Sn2+ (%/%) |
| 10% SnO/TiO2–Cl |
36.9 |
35.5 |
26.7 |
0.75 |
41.6/58.4 |
|
| 10% SnO/TiO2-ox |
35.6 |
31.8 |
22.6 |
— |
9.8/90.2 |
|
| 10% SnO/TiO2–Cl-A |
34.3 |
39.2 |
26.5 |
— |
77.5/22.5 |
|
| SnO |
72.3 |
27.7 |
— |
— |
8.8/91.2 |
|
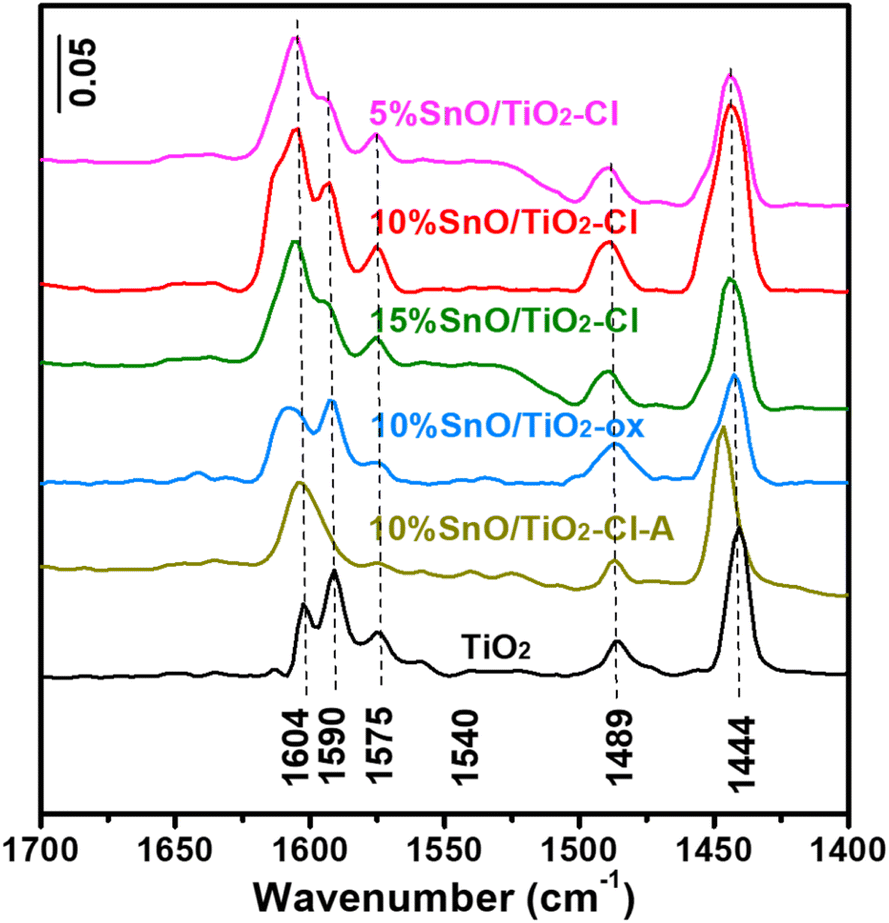
Fig. 9 shows Py-IR adsorption spectra on TiO2 and SnO/TiO2. Firstly, no obvious ![[triple bond, length as m-dash]](https://www.rsc.org/images/entities/char_e002.gif) N+–H and C
N+–H and C![[double bond, length as m-dash]](https://www.rsc.org/images/entities/char_e001.gif) N infrared adsorption peaks of pyridine hydrogen ion (PyH+) species were observed at 1540 and 1635 cm−1 on these samples, indicating the absence of Brønsted acid sites.42 Secondly, these Py-IR adsorption peaks on TiO2 at 1444, 1489, 1575, 1590 and 1604 cm−1 are all caused by the vibration of Py adsorbed on Lewis acid sites with the vibration modes of 19a (B1), 19a (A1), 8b (B1), and 8a (A1), respectively.43 Compared with TiO2, the 19a (B1) and 8a (A1) vibrational adsorption peaks of SnO/TiO2 became significantly broaden and enhanced. The amounts of Lewis acid on these samples were semi-quantitatively analyzed by Py-IR results (Table 4). It turned out that 10% SnO/TiO2–Cl has the highest Lewis acid amount on (69.8 μmolPy g−1), which is 2.0 and 2.1 times than that on TiO2 (34.5 μmolPy g−1) and 10% SnO/TiO2-ox (32.8 μmolPy g−1), indicating that the highly dispersed Sn species provided more Lewis acid sites.
N infrared adsorption peaks of pyridine hydrogen ion (PyH+) species were observed at 1540 and 1635 cm−1 on these samples, indicating the absence of Brønsted acid sites.42 Secondly, these Py-IR adsorption peaks on TiO2 at 1444, 1489, 1575, 1590 and 1604 cm−1 are all caused by the vibration of Py adsorbed on Lewis acid sites with the vibration modes of 19a (B1), 19a (A1), 8b (B1), and 8a (A1), respectively.43 Compared with TiO2, the 19a (B1) and 8a (A1) vibrational adsorption peaks of SnO/TiO2 became significantly broaden and enhanced. The amounts of Lewis acid on these samples were semi-quantitatively analyzed by Py-IR results (Table 4). It turned out that 10% SnO/TiO2–Cl has the highest Lewis acid amount on (69.8 μmolPy g−1), which is 2.0 and 2.1 times than that on TiO2 (34.5 μmolPy g−1) and 10% SnO/TiO2-ox (32.8 μmolPy g−1), indicating that the highly dispersed Sn species provided more Lewis acid sites.
 |
| | Fig. 9 Py-IR adsorption spectra of TiO2 and different SnO/TiO2. | |
Table 4 The Py-IR results of TiO2 and different SnO/TiO2
| Sample |
Adsorbed Py on Lewis acid |
Acidity (μmolPy g−1) |
| 8a (A1) |
8b (B1) |
19a (A1) |
19a (B1) |
| TiO2 |
1604 |
1590 |
1575 |
1489 |
1444 |
34.5 |
| 5% SnO/TiO2–Cl |
1604 |
1595 |
1576 |
1489 |
1444 |
36.3 |
| 10% SnO/TiO2–Cl |
1608 |
1593 |
1576 |
1487 |
1442 |
69.8 |
| 15% SnO/TiO2–Cl |
1606 |
1595 |
1576 |
1489 |
1444 |
38.1 |
| 10% SnO/TiO2-ox |
1603 |
1591 |
1576 |
1485 |
1441 |
32.8 |
| 10% SnO/TiO2–Cl-A |
1605 |
— |
1576 |
1487 |
1446 |
35.5 |
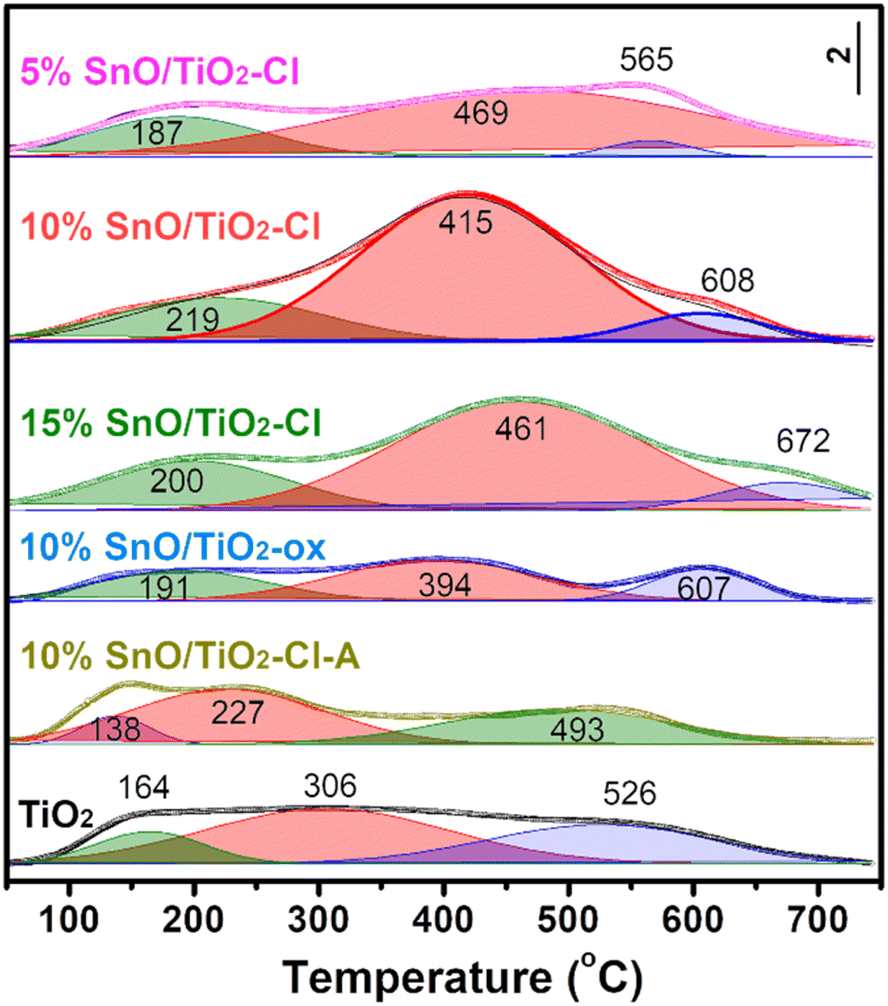
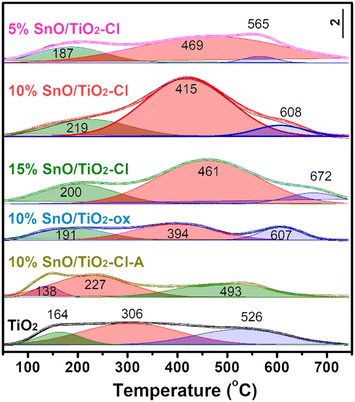
NH3-TPD was used to quantify the acid amount (Fig. 10). The peaks at low temperature region (α, 100–250 °C), medium temperature zone (β, 250–500 °C), and high temperature area (γ, 500–700 °C) corresponded to weak acid sites, medium strong acid sites, and strong acid sites, respectively. The acid distribution and amount of 10% SnO/TiO2-ox and 10% SnO/TiO2–Cl-A are similar as that of TiO2, while NH3-TPD curve of SnO/TiO2 has changed greatly with the obvious increase of medium strong acid sites. Through the peak fitting of NH3-TPD curves (Table 5), the amount of weak and strong acid sites on SnO/TiO2–Cl were as much as those of TiO2 and 10% SnO/TiO2-ox, while the amount of medium strong acid sites (0.29–0.61 mmolNH3 g−1) on SnO/TiO2–Cl was higher than those of TiO2 and 10% SnO/TiO2-ox (0.20 mmolNH3 g−1). With the increase of Sn content, the amount of medium strong acid sites from 0.29 mmolNH3 g−1 (5% SnO/TiO2–Cl) first increases to 0.61 mmolNH3 g−1 (10% SnO/TiO2–Cl), and then decreases to 0.35 mmolNH3 g−1 (15% SnO/TiO2–Cl).
 |
| | Fig. 10 NH3-TPD of TiO2 and different SnO/TiO2. | |
Table 5 The NH3-TPD results of TiO2 and different SnO/TiO2
| Sample |
NH3-TPD temperature (°C) |
Acidity (mmolNH3 g−1) |
| Weak |
Middle |
Strong |
Weak |
Middle |
Strong |
| TiO2 |
164 |
306 |
526 |
0.05 |
0.20 |
0.14 |
| 5% SnO/TiO2–Cl |
187 |
469 |
565 |
0.08 |
0.29 |
0.02 |
| 10% SnO/TiO2–Cl |
219 |
415 |
608 |
0.14 |
0.61 |
0.04 |
| 15%SnO/TiO2–Cl |
200 |
461 |
672 |
0.12 |
0.35 |
0.05 |
| 10% SnO/TiO2-ox |
191 |
394 |
607 |
0.12 |
0.20 |
0.08 |
| 10% SnO/TiO2–Cl-A |
138 |
227 |
493 |
0.03 |
0.14 |
0.11 |
4. Conclusion
The catalytic behaviors of esterifying fatty acid and TMP over SnO/TiO2 were studied. The structure–activity relationships between Sn species and lubricating ester synthesis reaction were dissected by changing Sn precursors, loading amounts, and treating ambiences. The optimized 10% SnO/TiO2–Cl with SnCl2·2H2O as precursor after roasting in N2 reveals the excellent esterification performance. The detailed structure and surface acidity characterization results show that Sn species highly dispersed on 10% SnO/TiO2–Cl, as the moderate Lewis acid sites to accelerate esterification reactions between TMP and n-octanoic acid.
Conflicts of interest
The authors declare no competing financial interest.
Acknowledgements
Financial support was provided by the National Natural Science Foundation of China NSFC (NSFC 52105226).
References
- J. A. Cecilia, D. Ballesteros Plata, R. M. Alves Saboya, F. M. Tavares de Luna, C. L. Cavalcante and E. Rodríguez-Castellón, Processes, 2020, 8, 257 CrossRef CAS.
- L. Qin, H. Mao, C. Lei, Q. Wang and Z. Gao, Microporous Mesoporous Mater., 2019, 289, 109623 CrossRef.
- M. Kuzminska, R. Backov and E. M. Gaigneaux, Appl. Catal., A, 2015, 504, 11 CrossRef CAS.
- M. Cai, Q. Yu, W. Liu and F. Zhou, Chem. Soc. Rev., 2020, 49, 7753 RSC.
- R. A. Perkins and M. L. Huber, Int. J. Thermophys., 2020, 41, 153 CrossRef CAS.
- R. V. Pawar, D. B. Hulwan and M. B. Mandale, J. Cleaner Prod., 2022, 378, 134454 CrossRef CAS.
- M. Hájek, A. Vávra, H. de Paz Carmona and J. Kocík, Catalysts, 2021, 11, 1118 CrossRef.
- S. Chen, T. Wu and C. Zhao, Green Chem., 2020, 22, 7348 RSC.
- K. F. Yee, K. T. Lee, R. Ceccato and A. Z. Abdullah, Bioresour. Technol., 2011, 102, 4285 CrossRef CAS PubMed.
- S. Furuta, H. Matsuhashi and K. Arata, Catal. Commun., 2004, 5, 721 CrossRef CAS.
- C. S. Caetano, I. M. Fonseca, A. M. Ramos, J. Vital and J. E. Castanheiro, Catal. Commun., 2008, 9, 1996 CrossRef CAS.
- K. Jacobson, R. Gopinath, L. C. Meher and A. K. Dalai, Appl. Catal., B, 2008, 85, 86 CrossRef CAS.
- A. L. Cardoso, R. Augusti and M. J. Da Silva, J. Am. Oil Chem. Soc., 2008, 85, 555 CrossRef CAS.
- J. Zhao, H. Guan, W. Shi, M. Cheng, X. Wang and S. Li, Catal. Commun., 2012, 20, 103 CrossRef CAS.
- B. M. Russbueldt and W. F. Hoelderich, Appl. Catal., A, 2009, 362, 47 CrossRef CAS.
- Y. Wang, Y. Liu and C. Liu, Energy Fuels, 2008, 22, 2203 CrossRef CAS.
- W. Xie and D. Yang, Bioresour. Technol., 2012, 119, 60 CrossRef CAS PubMed.
- Y. M. Park, S. H. Chung, H. J. Eorn, J. S. Lee and K. Y. Lee, Bioresour. Technol., 2010, 101, 6589 CrossRef CAS PubMed.
- W. Xie, H. Wang and H. Li, Ind. Eng. Chem. Res., 2012, 51, 225 CrossRef CAS.
- M. J. Ramos, A. Casas, L. Rodríguez, R. Romero and A. Pérez, Appl. Catal., A, 2008, 346, 79 CrossRef CAS.
- A. L. Cardoso, S. C. G. Neves and M. J. Da Silva, Energies, 2008, 1, 79 CrossRef CAS.
- A. Galia, A. Centineo, G. Saracco, B. Schiavo and O. Scialdone, Biomass Bioenergy, 2014, 67, 193 CrossRef CAS.
- M. K. Lam, K. T. Lee and A. R. Mohamed, Appl. Catal., B, 2009, 93, 134 CrossRef CAS.
- P. Ganji and S. Roy, Catal. Commun., 2020, 134, 105864 CrossRef CAS.
- M. R. Kamaruzaman, S. Y. Chin, E. C. L. Pui, H. Prasetiawan and N. Azizan, Ind. Eng. Chem. Res., 2019, 58, 510 CrossRef CAS.
- L. Interrante, S. Bensaid, C. Galletti, R. Pirone, B. Schiavo, O. Scialdone and A. Galia, Fuel Process. Technol., 2018, 177, 336 CrossRef CAS.
- C. Chen, W. Mei, C. Wang, Z. Yang, X. A. Chen, X. Chen and T. Liu, J. Alloys Compd., 2020, 826, 154122 CrossRef CAS.
- B. Liang, D. Han, C. Sun, W. Zhang and Q. Qin, Ceram. Int., 2018, 44, 7315 CrossRef CAS.
- B. Lakkoju and V. Vemulapalli, AIP Conf. Proc., 2020, 2297, 020002 CrossRef CAS.
- I. M. Cavalcante, N. R. D. C. Rocha, D. H. A. de Brito, A. P. D. Schuller, J. F. Camara Neto, S. M. de Morais, F. M. T. de Luna, M. T. G. F. Schanz, M. E. Maier and N. M. P. S. Ricardo, J. Am. Oil Chem. Soc., 2019, 96, 75 CrossRef CAS.
- S. Gao, F. Y. Ren, W. H. Xie, L. N. He and H. R. Li, J. Am. Oil Chem. Soc., 2022, 99, 91 CrossRef CAS.
- H. Su, Q. Zhao, Y. Wang, Q. Zhao, C. Jang, Y. Niu, W. Lou and Y. Qi, Catal. Commun., 2022, 162, 106370 CrossRef CAS.
- Y. Wang, R. Ma, C. Jiang, W. Lou and X. Wang, Catal. Commun., 2019, 122, 28 CrossRef CAS.
- H. Su, Z. Zong, W. Lou, Q. Zhao, X. Wang, X. Feng, Y. Qi and Z. Song, Catalysts, 2022, 12, 901 CrossRef CAS.
- D. Chakraborty, M. Devi, B. Das and S. S. Dhar, Environ. Sci. Pollut. Res., 2023, 30, 13846 CrossRef PubMed.
- M. Sarno, M. Iuliano and C. Cirillo, Chem. Eng. J., 2019, 377, 120273 CrossRef CAS.
- H. Huang, Q. Dai and X. Wang, Appl. Catal., B, 2014, 158, 96 CrossRef.
- Q. Yan, J. Wang, X. Han and Z. Liu, J. Mater. Res., 2013, 28, 1862 CrossRef CAS.
- Y. Zhang, C. X. Harris, P. Wallenmeyer, J. Murowchick and X. Chen, J. Phys. Chem. C, 2013, 117, 24015 CrossRef CAS.
- K. Mcguire, Z. W. Pan, Z. L. Wang, D. Milkie, J. Menéndez and A. M. Rao, J. Nanosci. Nanotechnol., 2002, 2, 499 CrossRef CAS PubMed.
- H. Liang, F. Yuan, A. Johnston, C. Gao, H. Choubisa, Y. Gao, Y.-K. Wang, L. K. Sagar, B. Sun, P. Li, G. Bappi, B. Chen, J. Li, Y. Wang, Y. Dong, D. Ma, Y. Gao, Y. Liu, M. Yuan, M. I. Saidaminov, S. Hoogland, Z.-H. Lu and E. H. Sargent, Adv. Sci., 2020, 7, 1903213 CrossRef CAS PubMed.
- T. Bezrodna, G. Puchkovska, V. Shimanovska, I. Chashechnikova, T. Khalyavka and J. Baran, Appl. Surf. Sci., 2003, 214, 222 CrossRef CAS.
- Y. I. Tarasevich, V. P. Telichkun and F. D. Ovcharenko, Theor. Exp. Chem., 1973, 6, 658 CrossRef.
|
| This journal is © The Royal Society of Chemistry 2023 |
Click here to see how this site uses Cookies. View our privacy policy here. 
 Open Access Article
 This Open Access Article is licensed under a Creative Commons Attribution-Non Commercial 3.0 Unported Licence
 ab,
Qin Zhaoa,
Cheng Jiangac,
Yanan Wanga,
Yongfang Niuab,
Xuelian Liab,
Wenjing Lou
ab,
Qin Zhaoa,
Cheng Jiangac,
Yanan Wanga,
Yongfang Niuab,
Xuelian Liab,
Wenjing Lou