
 Open Access Article
 This Open Access Article is licensed under a Creative Commons Attribution-Non Commercial 3.0 Unported Licence
Coupling Au-loaded magnetic frameworks to photonic crystal for the improvement of photothermal heating effect in SERS†
Tianxing Wanga,
Panpan Xiaob,
Li Yea,
Pengcheng Zhua and
Lin Zhuang *a
*a
aSchool of Physics, Institute for Solar Energy Systems, Guangdong Provincial Key Laboratory of Photovoltaics Technologies, Sun Yat-sen University, Guangzhou 510006, China. E-mail: stszhl@mail.sysu.edu.cn
bSchool of Electronics and Information Technology, Sun Yat-sen University, Guangzhou 510006, China
First published on 8th February 2023
Abstract
The combination of plasmonic metals and photonic crystal (PC) structure is considered to have potential for further enhancement of the surface-enhanced Raman scattering (SERS) effect in comparison with conventional metal SERS substrates. Many studies have suggested that SERS signals probably suffer from an often-neglected effect of strong surface plasmon resonance (SPR)-induced photothermal heating during SERS detection. Herein, we have discovered that the photothermal heating problem arises in a traditional hybrid substrate that is prepared by doping plasmonic Au nanoparticles (NPs) into the voids of an opal PC (Au-PC). This happens mainly because excess Au agglomerates formed by non-uniformly distributed Au NPs can cause a strong SPR effect under laser illumination. To fully address this issue, we have employed an improved hybrid substrate that is fabricated by substituting Au NPs in Au-PC with an Au-loaded magnetic framework (AuMF). The AuMF can effectively prevent the aggregation of Au NPs and ensure sufficient hot spots for SERS. This novel substrate prepared by doping AuMFs into a PC (AuMF-PC) was free of strong photothermal heating and showed high SERS intensity and reproducibility of the SERS signal compared with Au-PC. For practical applications, we have demonstrated AuMF-PC as an appropriate candidate for the SERS assay of the trace thiol pesticide thiram, and it enables recycling and reuse to achieve low cost.
1. Introduction
SERS is a powerful tool widely renowned for its role as an analytical technique1–3 with sensitivity several orders of magnitude higher than the conventional Raman signal. This is mainly attributed to the strong electromagnetic effect achieved by exciting SPRs on metal substrates.4,5 Hence, the benefit of SERS is dependent on hot spots formed by the aggregates of plasmonic metal NPs that possess intense absorption properties arising from the SPR effect and promote the enhancement factor (EF). Due to the strong SPR band, a highly enhanced electric field as well as photothermal heating effect will be generated on the excited metal surface under laser illumination.6–14 Recently, numerous researchers have reported the potential role of the photothermal heating effect in SERS studies, however, the results are mixed.15–24 For example, mild photothermal heating plays a positive role in SERS and has been widely employed in the field of optical sensing and biological imaging.25 On the other hand, the heat-induced degradation of analytes can produce carbonaceous species, cause desorption of the adsorbates in the excitation area, and lead to the catalytic transformation of analytes to produce other species. These results have demonstrated that the inevitable strong SPR-induced photothermal heating during SERS detection is caused due to two main reasons: the plasmonic metal NPs are directly illuminated by a high-power laser and the presence of excessive amounts of plasmonic metal NPs within the laser excitation area. Furthermore, heating may have detrimental effects on SERS, such as reducing the SERS performance (e.g., sensitivity, reproducibility, uniformity, etc.) severely or leading to disturbance in the SERS signal.6–11In recent years, PC structures (e.g., opal, inverse opal, etc.) have been suggested as suitable platforms that provide structural support for metal NPs in SERS studies.26–31 Such hybrid substrates are considered to have the potential for further enhancement of the SERS effect compared with conventional metal substrates. The photonic stop band (PSB) structure of a PC can modulate light propagation, resulting in the transmission of light in a specific direction being forbidden within a certain wavelength range. Therefore, the multiple scattering effect improves the light-matter interaction and leads to an additional SERS enhancement.32,33 However, many researchers34–37 have reported that the SERS signals recorded using hybrid substrates often suffer from some inevitable problems, such as loss and confusion. This is mainly because SPR-induced photothermal heating is enhanced as the number of metal NPs in the PC structure increases.
To solve these problems, more efforts have been dedicated to improving the PC structure. Subramanian et al.38 proposed a hexagonal inverse opal PC for Au NPs embedded in the silica matrix. It could prevent the formation of excess Au agglomerates and avoid SPR-induced local heating under a laser power of 4![[thin space (1/6-em)]](https://www.rsc.org/images/entities/char_2009.gif) mW. Chen et al.39 prepared an Au NP-decorated inverse opal mask silica PC on indium tin oxide glass. The results indicated that the SERS signal did not decline when the Au NP deposition time was increased to five minutes under a laser power of 1 mW. Skrabic et al.40 reported a SERS-active substrate made of silver-coated porous silicon PC. It provided advantages in terms of reduction of plasmonic heating and avoidance of photodegradation in the near-infrared wavelength range under high laser power between 250–500 mW. However, complicated preparation procedures and the use of hazardous reagents are required for the methods mentioned above. These will probably limit their extensive application in SERS. Many studies41–43 have reported that Au-PC, which is prepared by doping plasmonic Au NPs into the voids of opal PC, acts as a traditional hybrid SERS substrate. The highly facile method of vertical deposition is conducive due to the lack of any need for hazardous reagents, and thus, Au-PC has received wide attention.
mW. Chen et al.39 prepared an Au NP-decorated inverse opal mask silica PC on indium tin oxide glass. The results indicated that the SERS signal did not decline when the Au NP deposition time was increased to five minutes under a laser power of 1 mW. Skrabic et al.40 reported a SERS-active substrate made of silver-coated porous silicon PC. It provided advantages in terms of reduction of plasmonic heating and avoidance of photodegradation in the near-infrared wavelength range under high laser power between 250–500 mW. However, complicated preparation procedures and the use of hazardous reagents are required for the methods mentioned above. These will probably limit their extensive application in SERS. Many studies41–43 have reported that Au-PC, which is prepared by doping plasmonic Au NPs into the voids of opal PC, acts as a traditional hybrid SERS substrate. The highly facile method of vertical deposition is conducive due to the lack of any need for hazardous reagents, and thus, Au-PC has received wide attention.
In this paper, after extensive experimentation, we have discovered that excess Au NP agglomerates are unexpectedly formed in Au-PC and are distributed non-uniformly. The experimental results confirm that obvious Au agglomerates are formed in some voids of the PC even at a low Au NP amount. Moreover, the non-uniform distribution of high-concentration Au NPs leads to the structural failure of PCs, and thus, further enhancement of the SERS signal based on the orderly PC structure is affected. Notably, the excess Au agglomerates may initiate strong SPR-induced photothermal heating, which may cause the loss of SERS intensity and reduce the reproducibility and uniformity of the SERS signal. In the experiments, para-aminothiophenol (PATP) has been used as the analyte to verify these phenomena due to its strong interaction with Au, intense Raman signal, and no fluorescence.7 To the best of our knowledge, photothermal heating has not been reported to have a detrimental effect on the SERS signal when using Au-PC as the SERS substrate to date. To fully address these issues, we fabricated an improved hybrid substrate by substituting Au NPs in Au-PC with AuMFs. As shown in Fig. 1, firstly, Au NPs were loaded onto the surface of an MF assembled using several Fe3O4@SiO2 magnetic nanoparticles (MNPs) to obtain AuMF. Secondly, the AuMFs were doped into the voids of the opal silica PC by the combination of solvent evaporation and self-assembly. AuMF could effectively prevent the aggregation of Au NPs and ensure sufficient hot spots for SERS. Hence, AuMF-PC as a SERS substrate was free of strong photothermal heating and showed high intensity and reproducibility of the SERS signal compared with Au-PC. Strikingly, AuMF-PC was also validated to be applicable to the SERS assay of the trace thiol pesticide thiram. Notably, AuMF-PC could be recycled and reused by magnetically separating the AuMF from the silica PC, thanks to the magnetic response of MFs.
 | ||
| Fig. 1 Schematic illustration of Au-PC and AuMF-PC as SERS substrates: the preparation and reversible behavior of the AuMF-PC substrate. The enlarged and cross-sectional pictures of the Au-loaded Fe3O4@SiO2 MNP from AuMF. SERS detection by the Au-PC substrate and the AuMF-PC substrate, respectively, using PATP as the analyte. The SERS signal of PATP obtained using the Au-PC substrate shows a significant loss and the SERS signal of PATP obtained from the AuMF-PC substrate shows a significant improvement. | ||
2. Materials and methods
2.1 Materials
Ethanol, ethylene glycol (EG), ammonia solution, crystal violet, and PATP were purchased from Macklin Biochemical Co. Tetraethyl orthosilicate (TEOS) and 3-aminopropyl triethoxysilane (APTES) were acquired from Sigma-Aldrich Chemicals Co. Sodium acetate anhydrous and trisodium citrate dehydrate were obtained from Sinopharm Chemical Co. Ferric chloride hexahydrate (FeCl3·6H2O) and thiram were purchased from Tianjin ZhiYuan Reagent Co. Ascorbic acid, cetyltrimethylammonium bromide (CTAB), and gold chloride trihydrate (HAuCl4·3H2O) were purchased from Shanghai Aladdin Biochemical Co. DI water was obtained from a Milli-Q system.2.2 Synthesis of the PC film
The monodisperse silica nanospheres were synthesized by using a modified Stöber method. Firstly, the ammonia solution (18 mL) was injected into a mixture of DI water (42.5 mL) and ethanol (32.5 mL) under vigorous stirring for 10 min. Then, another series of mixtures consisting of ethanol (90 mL) and TEOS (4.5, 4.8, 5, 5.5, 5.8, and 6.2 mL) were prepared, respectively. Next, they were mixed by stirring for 2 h in a 30 °C water bath. After that, the white silica nanospheres with different diameters were obtained by centrifugation at 12000×g for 0.5 h and washed five times with a mixture of DI water and ethanol. The different silica nanospheres were re-dispersed in ethanol (100 mL) respectively for further use. According to the vertical deposition method, clean glass slides (as substrates) were vertically introduced into the prepared silica suspensions (50 mL), respectively, and evaporated at 55 °C for 3 h in a vacuum drying oven. Finally, the silica PC films were formed on the glass slides by self-assembly.
2.3 Synthesis of AuMFs
The MFs assembled from Fe3O4@SiO2 MNPs were prepared by using a solvothermal method and a modified sol–gel method. Firstly, FeCl3·6H2O (0.819 g), trisodium citrate dehydrate (0.318 g), and sodium acetate anhydrous (1.5 g) were added to a mixture of EG (30 mL) and DI water (1 mL) under vigorously stirring for 20 min until the particulates were completely dissolved in the solvent. The mixture was then sealed in a Teflon-lined stainless-steel autoclave and heated at 200 °C in a vacuum drying oven for 10 h. The resulting Fe3O4 MNPs were collected using a magnet, washed five times with a mixture of DI water and ethanol, and then suspended in DI water (24 mL) again. Secondly, ethanol (160 mL) and an ammonia solution (16 mL) were introduced into the suspension of Fe3O4 MNPs (24 mL) under vigorous stirring for 0.5 h. Next, TEOS (240 μL) was added under stirring for 2 h in a 55 °C water bath, followed by APTES (500 μL) addition under stirring at room temperature for 1 h. After magnetic separation, cleaning five times and drying under a vacuum at 60 °C, the aminated Fe3O4@SiO2 MNPs were obtained.In a typical citrate reduction reaction to synthesize Au NPs with small particle size, the HAuCl4·3H2O solution (1 mM, 100 mL) was heated to boiling in a two-necked flask. The trisodium citrate solution (19.4 mM, 20 mL) was rapidly decanted into the flask and allowed to boil under vigorous mechanical stirring for 1 h. Finally, a colloidal Au solution (100 mL) consisting of dark red Au NPs was obtained. The flask was removed from the heat and cooled down to room temperature for further use.
Finally, the aminated Fe3O4@SiO2 MNPs (0.2 g) were completely dissolved in DI water (50 mL) under stirring. Next, the different amounts of the colloidal Au solution (12, 15, 18, 22, 25, 28, 31, 35, 40, 50, and 60 mL) were slowly added under ultrasonication for 1 h, respectively. The final Au-loaded Fe3O4@SiO2 MNPs were purified five times by a combination of mechanical stirring and ultrasonic cleaning to remove excess Au NPs and then dried in a vacuum drying oven. The resulting Au-loaded Fe3O4@SiO2 MNPs (0.2 g) were re-dispersed in DI water (100 mL) for further use.
2.4 Synthesis of the Au-PC film
The Au NPs prepared by the citrate reduction reaction were used as the Au seeds and diluted with the same volume of a 0.03 M CTAB solution. Next, the ascorbic acid solution was added to a mixture of HAuCl4·3H2O solution and CTAB (20 mM) at 35 °C for 0.5 h, followed by the addition of the Au seed solution to obtain a solution of Au NPs (100 mL) with good dispersion.The prepared colloidal Au solutions (10, 15, 20, 25, 30, 40, and 50 mL) were added to the silica suspension (50 mL) under ultrasonic dispersion for 1 h, respectively. Next, based on the vertical deposition method, clean glass slides were vertically introduced into these mixtures, respectively, and evaporated at 55 °C for 3 h. Finally, the Au-PC films with different amounts of Au NPs were obtained on the surface of the glass slides by self-assembly.
2.5 Synthesis of the AuMF-PC film
The process employed to prepare AuMF-PC films with different amounts of AuMF was the same as that mentioned for Au-PC above. The silica suspension (50 mL) and Au-loaded Fe3O4@SiO2 suspensions (5, 20, 50, and 70 mL) were mixed separately to obtain the homogeneous mixtures under ultrasonic dispersion for 1 h. Then, clean glass slides were vertically introduced into the mixtures, respectively, and evaporated at 55 °C for 3 h. In the end, the AuMF-PC films with different amounts of AuMF were formed on the glass slides by self-assembly.2.6 SERS measurement
PATP was used as the analyte to evaluate the SERS properties. The analyte solutions (2 mL) with different concentrations of PATP molecules, including 10−8, 10−7, 10−6, 10−5, and 10−4 M, were prepared. Next, the substrate samples were processed to the size of 1 cm × 1 cm. Then, the substrate samples were immersed respectively in different PATP solutions for 3 h and dried at room temperature. In this case, the PATP molecules with a thiol group could sufficiently bind to the surface of Au NPs. Prolonged immersion also enabled good adsorption of the PATP molecules at the hot spots. The stock solution of thiram (100 ppm) was prepared by dissolving thiram (5 mg) in ethanol (50 mL). Thiram solutions were prepared at different concentrations by diluting the thiram stock solution with ethanol. The test sample was obtained by adding the thiram solution (5 mL) to apple juice (5 mL) and diluting it with DI water (20 mL). The SERS spectra were recorded using the 50× objective in a Renishaw confocal Raman spectrometer. A 633 nm He–Ne laser at different powers (0.37, 0.5, 0.8, 1, and 2 mW) was used for excitation.3. Results and discussion
The surface and cross-section images of the PC film obtained by scanning electron microscopy (SEM) are illustrated in Fig. 2(a) and (b). The results demonstrate that the silica nanospheres self-assembled into an ordered three-dimensional opal PC structure. The reflection spectra of the PC films with different diameters of silica nanospheres were measured to detect the PSB positions. As shown in Fig. 2(c), the reflection peak wavelength clearly red-shifted as the diameter of the silica nanospheres increased. The PSB positions of the PC films with silica nanospheres of different diameters, including 200, 218, 241, 285, 320, and 359 nm, were measured to be 382, 453, 503, 547, 630, and 694 nm, respectively. The results also corresponded with the distinctly different structural colors observed in the optical microscopic images, which are displayed in Fig. 2(d). The change in color is mainly due to the PSB property and the Bragg diffraction of the ordered face-centred cubic structure.44 According to Fig. 2(c), the PSB position of PC film assembled using silica nanospheres with a 320 nm diameter was located at 630 nm. Strikingly, this position almost aligned with the 633 nm laser wavelength used in the SERS measurements. As reported in previous works,32,33 the SERS enhancement strongly depends on spectral alignment between the PSB position and the wavelength of the Raman laser. Therefore, the silica nanospheres with a diameter of 320 nm were selected to prepare the hybrid substrates Au-PC and AuMF-PC.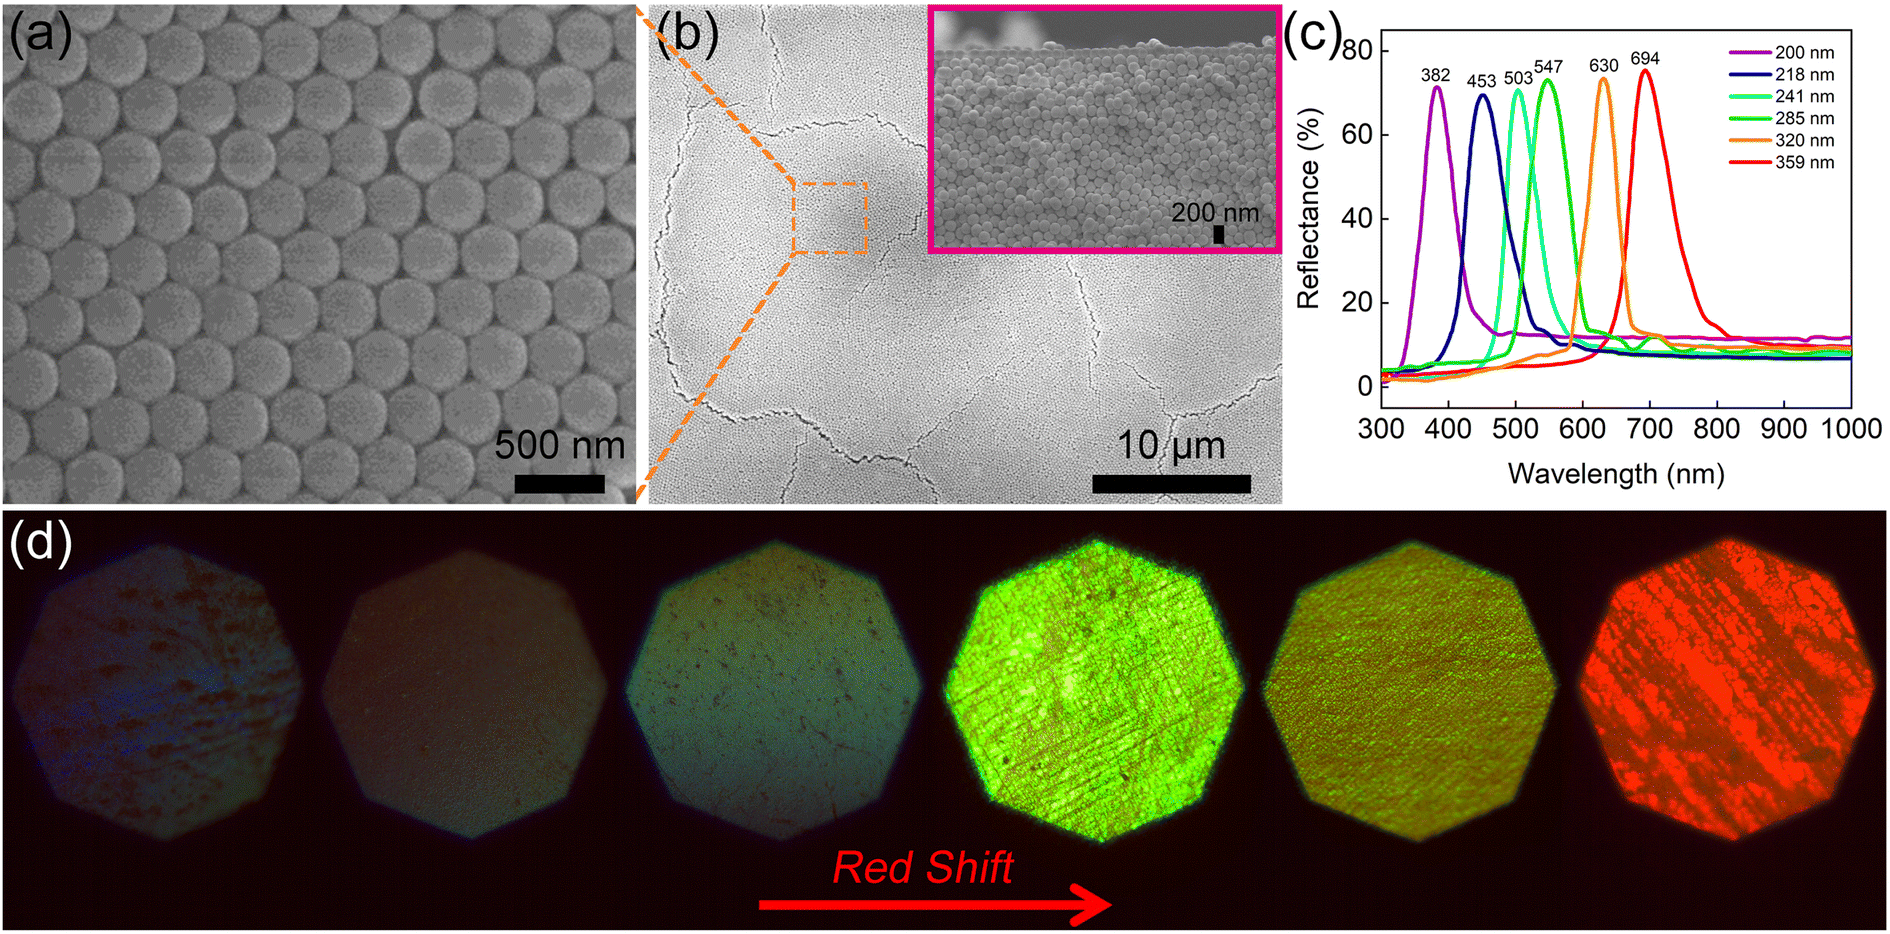 | ||
| Fig. 2 (a), (b) The SEM images of the surface of the PC film prepared from self-assembled silica nanospheres with a diameter of 320 nm. The inset in (b) shows the cross-section of the three-dimensional PC film. (c) The reflectance spectra of the PC films fabricated with silica nanospheres of different diameters, including 200, 218, 241, 285, 320, and 359 nm. (d) The microscopic optical images of the PC films listed in (c), respectively. | ||
Fig. S1† shows the traditional Au-PC film prepared by adding a low volume of the Au solution (10 mL). Obvious Au agglomerates were formed in some voids of the PC even with the low amount of Au. Notably, these agglomerates are not necessarily detrimental to SERS and only illustrate the phenomenon. Fig. S2† shows the Au-PC film fabricated with an excess volume of the Au solution (70 mL); significant agglomerates formed by non-uniformly distributed Au NPs could be observed in the voids of PC. For a fair comparison, the standard Au-PC film with a uniform distribution of Au NPs is shown in Fig. S3,† which was prepared by adding 25 mL of the Au solution. In the AuMF-PC substrate, each AuMF was assembled from several Au-loaded Fe3O4@SiO2 core–shell MNPs. The silica shell provided a platform with limited external surface area for loading the Au NPs, effectively preventing the formation of Au agglomerates during the preparation. When the surface of MF is filled with Au NPs, the excess Au NPs are not loaded onto MF successfully. The morphologies of AuMF at each stage are illustrated by the transmission electron microscopy (TEM) images in Fig. 3(a)–(c), respectively. As shown in Fig. 3(c) and S4,† the Au NPs were distributed dispersedly, and no significant excess Au agglomerates were observed on the external surface of MF, while there were enough Au NPs for SERS. As for the Au NPs, the lattice spacing was 0.235 nm, as shown in the inset of Fig. 3(c), corresponding to the (111) plane of the crystallite of the face-centered cubic Au.45 Further, we performed energy-dispersive X-ray (EDX) mapping to confirm the elemental distribution in AuMF. The results presented in Fig. 3(d) indicate that Fe was fully covered by Si, and Au was well-dispersed around the surface. Such a distribution of Au NPs created a high-density electric field and hot spots, which are beneficial to the SERS effect. Further, the AuMF-PC films prepared by adding different amounts of Au-loaded Fe3O4@SiO2 suspension (5, 20, and 50 mL) are shown in Fig. 4(a)–(c). Due to van der Waals forces and magnetic dipole–dipole attraction, several Au-loaded Fe3O4@SiO2 MNPs aggregated together to form the AuMF. We could see that the AuMF-PC films still possessed the opal PC structure despite the presence of different amounts of AuMFs, which may lead to a slight failure in the formation of a perfect closely packed opal PC structure. There were no obvious agglomerates on the local surface of these films. The large number of negatively charged Au NPs on the MF surface resulted in a strong electrostatic repulsive force among AuMFs, thereby favoring the prevention of AuMF agglomeration. Moreover, it is essential to clearly demonstrate the absence of agglomerates by fairly comparing the AuMF-PC film and the Au-PC film. Fig. 4(d) displays the Au-PC film prepared by adding a high volume of the Au solution (50 mL), while all other preparation conditions were the same as the AuMF-PC film in Fig. 4(c). We could see that the Au NPs were doped into the voids of the PC, and the non-uniform distribution of a large number of Au NPs would lead to the severe structural failure of the PC. The further enhancement of SERS based on the orderly PC structure will be affected. Meanwhile, some excess agglomerates could be clearly observed (labeled by the dashed line). In comparison with unlabeled Au NPs, these may initiate strong SPR-induced photothermal heating, which may cause the loss of SERS intensity and reduce the reproducibility and uniformity of the SERS signals. For the convenience of comparison, the compositions of all films mentioned above are tabulated in ESI, Table S1.†
 | ||
| Fig. 3 (a)–(c) The TEM images of Fe3O4 MNPs, Fe3O4@SiO2 MNPs, and Au-loaded Fe3O4@SiO2 MNPs, respectively. The inset in (c) shows the high-resolution TEM (HRTEM) image of Au NPs. (d) The EDX mapping images of elements Fe (pink), Si (red), Au (green), and O (cyan) in AuMF. | ||
 | ||
| Fig. 4 (a)–(c) The SEM images of the AuMF-PC films prepared by adding different volumes of Au-loaded Fe3O4@SiO2 suspension (5, 20, and 50 mL), respectively. (d) The SEM image of the Au-PC film prepared by adding 50 mL of the Au solution. The preparation conditions of the film samples in (c) and (d) are exactly the same. The thickness of all films is approximately 3 μm. | ||
To verify whether the amount of doped Au NPs increased with the use of increasing Au solution volume in Au-PC preparation, the absorbance spectra of the Au-PC films prepared by adding different amounts of the Au solution were measured, as shown in Fig. 5(a). We could see that the absorption peak was clearly red-shifted, and the absorption band broadened as the volume of Au solution added was increased. The results are mainly attributed to the enhanced SPR effect resulting from the increased aggregation of neighboring Au NPs. Moreover, the SP resonance frequency changed with the increasing size of the Au agglomerates. When the amount of Au solution added was 50 mL (corresponding to sample M7), the morphology of sample M7 presented bigger agglomerates and uneven distribution, as shown in Fig. 4(d) and discussed above. To investigate whether the strong SPR-induced heating problem occurred in sample M7, we examined the SERS signal for spot-to-spot reproducibility at ten random spots. As shown in Fig. 5(b), for better visualization, we separated the reduced SERS signals (labeled by the dashed line) from the standard signals. In contrast, the reduced signals showed blurred characteristic peaks, which may be due to the surface reaction of the PATP molecules induced by the strong photothermal heating effect under laser illumination.7 Notably, the peaks of the reduced SERS signals at positions 1140, 1391, and 1440 cm−1 were not disrupted, which can be attributed to the b2 modes of the PATP molecules induced by the local heating effect.46,47 This further demonstrated that the local heating problem may occur on the surface of sample M7 and have a detrimental effect on the SERS signal and SERS reproducibility. The results discussed above are also consistent with the conjecture from Fig. 4(d). To further exclude the influence of the high laser power, we used sample M7 as the SERS substrate. The SERS spectra were recorded by varying the laser power with an integration time of 10 s. As shown in Fig. 5(c), when the laser power was increased from 0.37 to 2 mW, the peak intensities at 1140, 1391, and 1440 cm−1 were enhanced accordingly. The variation in these spectral features is also attributed to the b2 modes of the PATP molecules. The occurrence of these b2 modes is dependent on the laser-induced SPR effect caused by a laser with sufficient power.7 In addition, the strong SPR effect can lead to the photothermal heating problem. When the laser power was as low as 0.37 mW, there was no signal related to the b2 modes and thus no photothermal heating. In the presence of excess Au agglomerates, photothermal heating occurred even the laser power was as low as 0.5 mW. In addition, we also considered the effect of integration time, as shown in Fig. 5(d). Photothermal heating was confirmed when the laser power was 0.5 and 2 mW. The changes in the decreased peaks were not obvious with an increase in integration time. The peak intensities at 1140, 1391, and 1440 cm−1 related to the b2 modes were also observed, consistent with the discussion above. These results indicate that the detrimental reduction of signals caused by photothermal heating is independent of the integration time. The degree of signal disruption mainly depends on high laser power and the excess amount of Au agglomerates.
 | ||
| Fig. 5 (a) The absorbance spectra of the Au-PC films fabricated by adding different volumes of the Au solution. (M1–M7 correspond to the Au solution volumes of 10, 15, 20, 25, 30, 40, and 50 mL, respectively). (b) The SERS spectra of 10−6 M PATP recorded at 10 random spots on the Au-PC substrate of sample M7 using a laser with a power of 1 mW and an integration time of 10 s. (c) The SERS spectra of 10−6 M PATP obtained using the Au-PC substrate M7 under different laser powers, including 0.37, 0.5, 0.8, 1, and 2 mW. The integration time is 10 s. (d) The SERS spectra of 10−6 M PATP obtained using the Au-PC substrate M7 under laser powers of 0.5 and 2 mW with different integration times (5 and 20 s), respectively. | ||
To confirm whether the MFs assembled using Fe3O4@SiO2 MNPs could effectively prevent an excess amount of Au NPs, and the absorption spectra of the AuMFs prepared by adding different amounts of the Au solution were measured. Fig. 6(a) shows that the absorption band sharpened as the added volume of the Au solution increased, and the absorption peak slightly red-shifted towards a higher wavelength and remained constant at 522 nm. These results may represent the strong interactions between the increasing number of Au NPs and the enhanced SPR effect due to more neighboring Au NPs. Notably, the peak position did not shift when the added amount of Au solution was greater than 35 mL. This is mainly because the limited external surface of the MFs is filled with a sufficient amount of Au NPs, and thus, the excess Au NPs cannot be loaded onto the MFs despite the increase in added Au amount. To verify whether increasing the added amount of AuMFs influences the optical benefits of the PC, we performed the following analysis. Fig. 6(b) shows that the reflection peak wavelength red-shifted as the amount of AuMFs was increased. The PSB positions were located at 634, 640, 649, and 671 nm, corresponding to the different added volumes of the Au-loaded Fe3O4@SiO2 suspension (5, 20, 50, and 70 mL), respectively. Further discussions are indicated in ESI, Section 1.† Compared with the reflectance spectrum of the bare PC film (corresponding to the diameter of 320 nm) in Fig. 2(c), the reflectance of AuMF-PC was significantly decreased. This is mainly because the doped AuMFs may cause a slight failure of the perfect close-packed opal PC structure and introduce lots of defects into the PC. Furthermore, both loaded Au and the Fe3O4 cores have high absorption properties. It was found that the reflectance of AuMF-PC gradually decreased with the increasing amount of AuMFs. Strikingly, the PSB positions of the AuMF-PC films from 634 to 649 nm were close to those of the bare PC film (630 nm); thus, the benefit of the PSB property was largely preserved. Further, the reflectance spectra of AuMF-PC and Au-PC prepared under the same condition (film samples corresponding to Fig. 4(c) and (d)) were compared, as shown in Fig. 6(c). We could see that the wavelength of the PSB position of Au-PC was longer than that of AuMF-PC. This may have happened because the dopants in Au-PC were much more than in AuMF-PC, resulting in a more severe degree of failure to opal PC. This result is also confirmed by the SEM image in Fig. 4(d). In contrast, the decreased reflectance of AuMF-PC is mainly attributed to the high absorption of the Fe3O4 cores in the MFs.
 | ||
| Fig. 6 (a) The absorbance spectra of the AuMFs prepared by adding different amounts of the Au solution, including 12, 15, 18, 22, 25, 28, 31, 35, 40, 50, and 60 mL. (b) The reflectance spectra of the AuMF-PC films prepared by adding different amounts of the Au-loaded Fe3O4@SiO2 suspension, including 5, 20, 50, and 70 mL. (c) The reflectance spectra of AuMF-PC and Au-PC prepared under the same condition. The film samples correspond to Fig. 4(c) and (d), respectively. | ||
In order to evaluate the SERS performance (e.g., SERS activity, sensitivity, uniformity, reproducibility, etc.) of AuMF-PC as a SERS substrate and verify whether it is totally free of the strong photothermal heating effect, the following SERS experiments were conducted. First, we recorded the SERS spectra of 10−6 M PATP using the PC film, Au NPs, AuMFs, Au-PC film, and AuMF-PC film as substrates under the same test conditions. The integration time was set to 10 s, and a moderate laser power of 1 mW was used for excitation. For a valid comparison of SERS intensity, the main characteristic peaks from the recorded signals using different substrates are clearly visible and free of the photothermal heating problem. As shown in Fig. 7(a), because the number of hot spots created by the SP materials from Au-PC was less than that in AuMFs within the laser excitation area, AuMF-PC exhibited a stronger SERS intensity than Au-PC in the presence of the PC structure. In comparison with other substrates, the AuMF-PC substrate displayed the highest intensity of the SERS signal, showing its high SERS activity originating from the synergistic effect of the SPR effect and the PSB property. Furthermore, the EF value of SERS is critical for the quantitative evaluation of SERS activity. The EF value of PATP for the AuMF-PC substrate was calculated to be approximately 4.76 × 10⁵, and the detailed calculation is described in ESI, Section 2.† Besides, in order to evaluate the sensitivity of the AuMF-PC substrate, we measured the SERS spectra of PATP with decreasing concentration. Fig. 7(b) shows that the detectable concentration limit for PATP reached as low as 10−8 M, indicating good sensitivity. In addition, to assess the uniformity of the SERS signals obtained using the AuMF-PC substrate, we collected the SERS spectra of 10−6 M PATP at ten random spots on the substrate under a strong laser power of 2 mW. As displayed in Fig. 7(c), high signal uniformity could be observed since the values of the relative standard deviation (RSD) of the intensities at the main peak positions (1077 and 1581 cm−1) were less than 10%. Finally, we performed a reproducibility test with fifteen AuMF-PC substrates under a strong laser power of 2 mW. The results presented in Fig. 7(d) reveal high reproducibility as the RSD values of the peak intensities at 1077, 1140, 1391, 1440, and 1581 cm−1 were calculated to be 8.7%, 15.3%, 9.5%, 12%, and 12.5%, respectively, all less than 15%. The above results confirm that AuMF-PC is highly suitable for reliable SERS detection and is entirely free of the undesired SPR-induced photothermal heating effect under a vast majority of test conditions.
 | ||
| Fig. 7 (a) The SERS spectra of 10−6 M PATP using the PC film, Au NPs, AuMFs, Au-PC film, and AuMF-PC film as SERS substrates under a laser power of 1 mW with an integration time of 10 s. The PC film, Au-PC film, and AuMF-PC film correspond to Fig. 2(a), 4(c) and (d), respectively. (b) The SERS spectra of PATP at different concentrations ranging from 10−4 to 10−8 M using AuMF-PC as the SERS substrate under a laser power of 1 mW with an integration time of 10 s. (c) The SERS spectra of 10−6 M PATP at 10 random spots on the AuMF-PC substrate under a laser power of 2 mW with an integration time of 10 s. (d) The SERS spectra of 10−6 M PATP using fifteen AuMF-PC substrates under a laser power of 2 mW with an integration time of 10 s. The main peak intensities at 1077, 1140, 1391, 1440, and 1581 cm−1 were selected for comparison. | ||
In terms of practical applications, the AuMF-PC substrate proved highly appropriate for the SERS assay of trace thiol pesticides. In particular, thiram, which is classified as a dithiocarbamate, is commonly used to prevent the canker of apple. Therefore, the overuse of this pesticide will lead to excess levels of thiram in apple juice and may affect the physical health of people. Here, AuMF-PC was employed as the assay substrate for the direct SERS detection of thiram in apple juice samples. The detection process was highly facile and free of any pretreatments. After drying the sample droplets on the AuMF-PC substrate, SERS spectra could be directly recorded. For comparison, we recorded the SERS spectra of thiram at different concentrations in ethanol and apple juice, respectively. As shown in Fig. 8(a) and (b), the SERS spectra of thiram in apple juice were almost the same as the standard SERS spectra of thiram in ethanol. These results demonstrate that other carbohydrates in apple juice had negligible interference with the SERS assay of thiram. The only difference noted was in the peak located at 728 cm−1. This peak showed a decrease as the concentration of thiram increased but had no significant influence on other characteristic peaks of thiram. In addition, the detectable concentration limit of thiram using the AuMF-PC substrate was as low as 50 ppb.
 | ||
| Fig. 8 (a) and (b) The SERS spectra of thiram at different concentrations in ethanol and apple juice, including 50, 100, 200, 400, 600, 800, and 1000 ppb, respectively. | ||
It is disheartening that the fabrication of hybrid substrates remains challenging due to complicated conditions, time-consuming procedures, and high cost. AuMF-PC fabricated in this work can circumvent these issues as it can be recycled and reused by magnetic separation, thanks to the magnetic properties of the Fe3O4 cores in the MF. Fig. 9(a) shows that the magnetic saturation values of Fe3O4, Fe3O4@SiO2, and Au-loaded Fe3O4@SiO2 MNPs were about 75, 46, and 25 emu g−1, respectively. It is clear that the magnetism was weakened by the outer silica shell and loaded Au NPs. Nevertheless, the magnetic response of Au-loaded Fe3O4@SiO2 MNPs was enough to separate the AuMFs from the silica nanospheres. After magnetic separation and collection, the physically adsorbed analyte molecules, such as crystal violet, were removed from the substrate by thorough washing.48 The collected Au-loaded Fe3O4@SiO2 MNPs and silica nanospheres could be directly used to prepare the substrate again. The strategy of magnetic separation is illustrated in Fig. 9(b). Subsequently, we used the re-fabricated AuMF-PC substrate and 10−6 M crystal violet as the analyte to examine SERS reproducibility. As indicated in Fig. 9(c), the SERS signals exhibited no obvious loss after cycles of reuse and revealed the reversible behavior of AuMF-PC. This feature is highly promising for practical use.
 | ||
| Fig. 9 (a) The magnetic hysteresis loops of Fe3O4, Fe3O4@SiO2, and Au-loaded Fe3O4@SiO2 MNPs, respectively. (b) The strategy of magnetic separation. AuMF-PC can be separated into its components, namely Au-loaded Fe3O4@SiO2 MNPs and silica nanospheres, by using a magnet. (c) The SERS spectra of 10−6 M crystal violet using AuMF-PC as the substrate over two cycles of reuse. | ||
4. Conclusions
In summary, we have demonstrated that the undesired effect of strong SPR-induced photothermal heating observed in the traditional hybrid substrate Au-PC even under low-power laser illumination can be effectively avoided by using AuMF-PC as the SERS substrate, which is prepared by substituting the Au NPs in Au-PC with AuMFs. The AuMF-PC substrate fabricated by adding 50 mL AuMF suspension has been validated to be the most appropriate for SERS detection, showing the highest SERS intensity under the laser power of 1 mW and integration time of 10 s in comparison with the other substrates investigated in this work. Under strong laser power, the recorded SERS signals showed excellent SERS reproducibility and uniformity. In practice, the AuMF-PC substrate was applied to the SERS assay of a trace thiol pesticide, and the detectable concentration limit of thiram in apple juice was as low as 50 ppb. Due to the unique magnetic response of MF, the AuMF-PC substrate can be easily recycled by using a magnet and reused.Conflicts of interest
There are no conflicts to declare.Acknowledgements
This work was supported by National Key R&D Program of China under grants (No. 2021YFA1400900, 2021YFA0718300, 2021YFA1402100), National Natural Science Foundation of China under grants (Nos. 61835013, 12174461, 12234012), Space Application System of China Manned Space Program.References
- S. Nie and S. R. Emory, Science, 1997, 275, 1102–1106 CrossRef CAS PubMed.
- K. Kneipp, W. Yang, H. Kneipp, L. T. Perelman, I. Itzkan, R. R. Dasari and M. S. Feld, Phys. Rev. Lett., 1997, 78, 1667–1670 CrossRef CAS.
- J. Kneipp, H. Kneipp and K. Kneipp, Chem. Soc. Rev., 2008, 37, 1052–1060 RSC.
- S.-Y. Ding, J. Yi, J.-F. Li, B. Ren, D.-Y. Wu, R. Panneerselvam and Z.-Q. Tian, Nat. Rev. Mater., 2016, 1, 1–16 Search PubMed.
- S. L. Kleinman, B. Sharma, M. G. Blaber, A. I. Henry, N. Valley, R. G. Freeman, M. J. Natan, G. C. Schatz and R. P. Van Duyne, J. Am. Chem. Soc., 2013, 135, 301–308 CrossRef CAS PubMed.
- K. W. Kho, Z. X. Shen, Z. Lei, F. Watt, K. C. Soo and M. Olivo, Anal. Chem., 2007, 79, 8870–8882 CrossRef CAS PubMed.
- Y. F. Huang, H. P. Zhu, G. K. Liu, D. Y. Wu, B. Ren and Z. Q. Tian, J. Am. Chem. Soc., 2010, 132, 9244–9246 CrossRef CAS PubMed.
- H. Yang, L. Q. He, Y. W. Hu, X. Lu, G. R. Li, B. Liu, B. Ren, Y. Tong and P. P. Fang, Angew. Chem., Int. Ed., 2015, 54, 11462–11466 CrossRef CAS PubMed.
- Y. F. Huang, M. Zhang, L. B. Zhao, J. M. Feng, D. Y. Wu, B. Ren and Z. Q. Tian, Angew. Chem., Int. Ed., 2014, 53, 2353–2357 CrossRef CAS PubMed.
- J.-H. Kim, K. M. Twaddle, L. M. Cermak, W. Jang, J. Yun and H. Byun, Colloids Surf., A, 2016, 498, 20–29 CrossRef CAS.
- N. Chen, T. H. Xiao, Z. Luo, Y. Kitahama, K. Hiramatsu, N. Kishimoto, T. Itoh, Z. Cheng and K. Goda, Nat. Commun., 2020, 11, 4772 CrossRef CAS PubMed.
- B. J. Liu, K. Q. Lin, S. Hu, X. Wang, Z. C. Lei, H. X. Lin and B. Ren, Anal. Chem., 2015, 87, 1058–1065 CrossRef CAS PubMed.
- J. Huang, M. Guo, H. Ke, C. Zong, B. Ren, G. Liu, H. Shen, Y. Ma, X. Wang, H. Zhang, Z. Deng, H. Chen and Z. Zhang, Adv. Mater., 2015, 27, 5049–5056 CrossRef CAS PubMed.
- S. Hu, B. J. Liu, J. M. Feng, C. Zong, K. Q. Lin, X. Wang, D. Y. Wu and B. Ren, J. Am. Chem. Soc., 2018, 140, 13680–13686 CrossRef CAS PubMed.
- J.-H. Sim, S. H. Lee, J.-Y. Yang, W.-C. Lee, C. Mun, S. Lee, S.-G. Park and Y.-R. Cho, Sens. Actuators, B, 2022, 354, 131110 CrossRef CAS.
- K. Wu, L. Q. Nguyen, T. Rindzevicius, S. S. Keller and A. Boisen, Adv. Opt. Mater., 2019, 7, 1901413 CrossRef CAS.
- Y. Yin, M. Wang, T. Xu, C. Yin and Y. Jin, Appl. Opt., 2020, 59, 11070–11075 CrossRef CAS PubMed.
- S. Jones, S. S. Sinha, A. Pramanik and P. C. Ray, Nanoscale, 2016, 8, 18301–18308 RSC.
- H. Zhang, Z. Liu, X. Kang, J. Guo, W. Ma and S. Cheng, Nanoscale, 2016, 8, 2242–2248 RSC.
- K. Sinthiptharakoon, T. Wutikhun, A. Treetong, K. Lapawae, N. Khemasiri, J. Santatiwongchai, P. Hirunsit, K. Lohawet, T. Sodsai, T. Muangnapoh, P. Kumnorkaew and A. Klamchuen, J. Phys. Chem. C, 2022, 126, 20437–20447 CrossRef CAS.
- M. I. Anik, A. Pan, M. G. Jakaria, S. A. Meenach and G. D. Bothun, ACS Appl. Nano Mater., 2022, 5, 14356–14366 CrossRef CAS.
- Z. Fusco, K. Catchpole and F. J. Beck, J. Mater. Chem. C, 2022, 10, 7511–7524 RSC.
- T. Zhou, J. Huang, W. Zhao, R. Guo, S. Cui, Y. Li, X. Zhang, Y. Liu and Q. Zhang, Nanomaterials, 2022, 12, 4232 CrossRef CAS PubMed.
- L. Li, J. Jin, J. Liu, J. Yang, W. Song, B. Yang and B. Zhao, Nanoscale, 2021, 13, 1006–1015 RSC.
- F. Hu, Y. Zhang, G. Chen, C. Li and Q. Wang, Small, 2015, 11, 985–993 CrossRef CAS PubMed.
- C. Zhang, J. Xu and Y. Chen, Nanomaterials, 2020, 10, 1205 CrossRef CAS PubMed.
- D. Yan, L. Qiu, M. Xue, Z. Meng and Y. Wang, Mater. Des., 2019, 165, 107601 CrossRef CAS.
- X. Li, Y. Wu, Y. Shen, Y. Sun, Y. Yang and A. Xie, Appl. Surf. Sci., 2018, 427, 739–744 CrossRef CAS.
- B. Ankudze, A. Philip, T. T. Pakkanen, A. Matikainen and P. Vahimaa, Appl. Surf. Sci., 2016, 387, 595–602 CrossRef CAS.
- M. Fränzl, S. Moras, O. D. Gordan and D. R. T. Zahn, J. Phys. Chem. C, 2018, 122, 10153–10158 CrossRef.
- R. S. Hyam, J. Jeon, S. Chae, Y. T. Park, S. J. Kim, B. Lee, C. Lee and D. Choi, Langmuir, 2017, 33, 12398–12403 CrossRef CAS PubMed.
- D. Tuyen le, A. C. Liu, C. C. Huang, P. C. Tsai, J. H. Lin, C. W. Wu, L. K. Chau, T. S. Yang, Q. Minh le, H. C. Kan and C. C. Hsu, Opt. Express, 2012, 20, 29266–29275 CrossRef PubMed.
- D. Qi, L. Lu, L. Wang and J. Zhang, J. Am. Chem. Soc., 2014, 136, 9886–9889 CrossRef CAS PubMed.
- J. Wang, Z. Jia and Y. Liu, IEEE Sens. J., 2019, 19, 11221–11227 CAS.
- F. Zhong, Z. Wu, J. Guo and D. Jia, Nanomaterials, 2018, 8, 872 CrossRef PubMed.
- M. Y. Tsvetkov, B. N. Khlebtsov, V. A. Khanadeev, V. N. Bagratashvili, P. S. Timashev, M. I. Samoylovich and N. G. Khlebtsov, Nanoscale Res. Lett., 2013, 8, 9 CrossRef PubMed.
- S.-G. Park, T. Y. Jeon, H. C. Jeon, J.-D. Kwon, C. Mun, M. Lee, B. Cho, C. S. Kim, M. Song and D.-H. Kim, IEEE Sens. J., 2016, 16, 3382–3386 CAS.
- B. Subramanian, G. Theriault, J. Robichaud, N. Tchoukanova and Y. Djaoued, Mater. Chem. Phys., 2020, 244, 122630 CrossRef CAS.
- L. Y. Chen, K. H. Yang, H. C. Chen, Y. C. Liu, C. H. Chen and Q. Y. Chen, Analyst, 2014, 139, 1929–1937 RSC.
- M. Skrabic, M. Kosovic, M. Gotic, L. Mikac, M. Ivanda and O. Gamulin, Nanomaterials, 2019, 9, 421 CrossRef CAS PubMed.
- L. A. Romero-Cruz, A. Santos-Gómez, M. A. Palomino-Ovando, O. Hernández-Cristobal, E. Sánchez-Mora, A. L. González and M. Toledo-Solano, Superlattices Microstruct., 2018, 123, 71–80 CrossRef CAS.
- M.-X. Wei, C.-H. Liu, H. Lee, B.-W. Lee, C.-H. Hsu, H.-P. Lin and Y.-C. Wu, Coatings, 2020, 10, 679 CrossRef CAS.
- C. Gu, S.-Q. Man, J. Tang, Z. Zhao, Z. Liu and Z. Zheng, Optik, 2020, 221, 165274 CrossRef CAS.
- Y. Zhao, L. Shang, Y. Cheng and Z. Gu, Acc. Chem. Res., 2014, 47, 3632–3642 CrossRef CAS PubMed.
- M. Ye, Z. Wei, F. Hu, J. Wang, G. Ge, Z. Hu, M. Shao, S. T. Lee and J. Liu, Nanoscale, 2015, 7, 13427–13437 RSC.
- Y. F. Huang, D. Y. Wu, H. P. Zhu, L. B. Zhao, G. K. Liu, B. Ren and Z. Q. Tian, Phys. Chem. Chem. Phys., 2012, 14, 8485–8497 RSC.
- G. K. Liu, J. Hu, P. C. Zheng, G. L. Shen, J. H. Jiang, R. Q. Yu, Y. Cui and B. Ren, J. Phys. Chem. C, 2008, 112, 6499–6508 CrossRef CAS.
- Y. Ye, J. Chen, Q. Ding, D. Lin, R. Dong, L. Yang and J. Liu, Nanoscale, 2013, 5, 5887–5895 RSC.
Footnote |
| † Electronic supplementary information (ESI) available. See DOI: https://doi.org/10.1039/d2ra07262a |
| This journal is © The Royal Society of Chemistry 2023 |